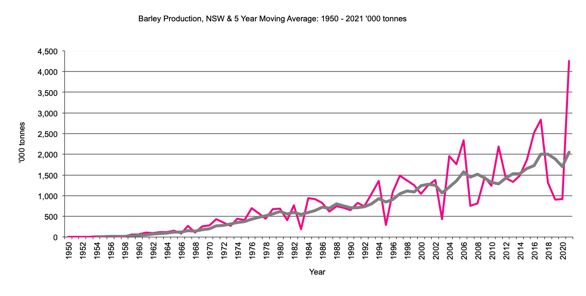
Production of barley '000 tonnes,
5 year moving average
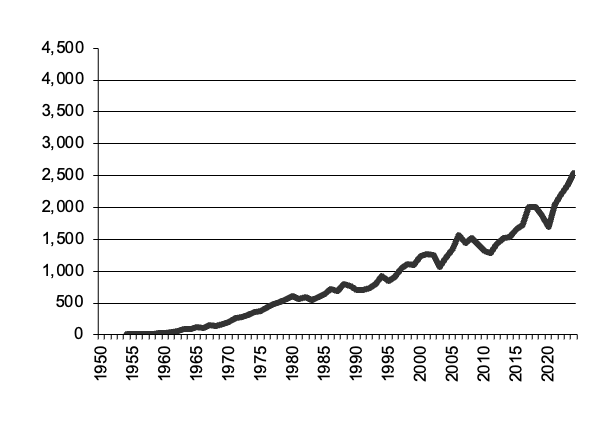
NSW Barley Production graph
NSW Barley Production data
Return to top of page
Back to data for States
Back to front page
This page has NSW data for crops production from 1950 to the present and the 3 year moving average.
The crops included here are: barley, oats, wheat, triticale, maize, rice, sorghum, sugar, grapes, cotton, potatoes and tobacco.
|
|
|
Production of barley '000 tonnes,
|
NSW Barley Production graph |
Return to top of page |
|
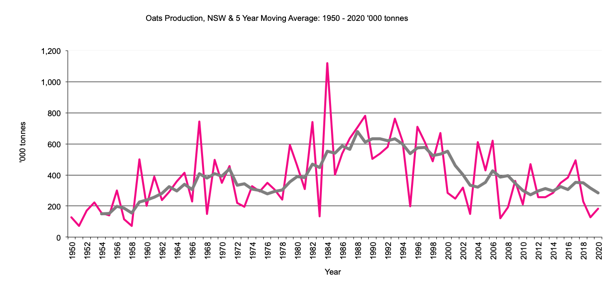
Production of Oats '000 tonnes, 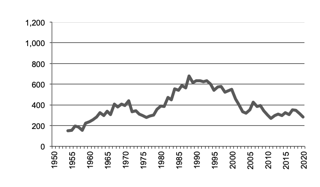
|
NSW Oats Production graph |
Return to top of page |
|
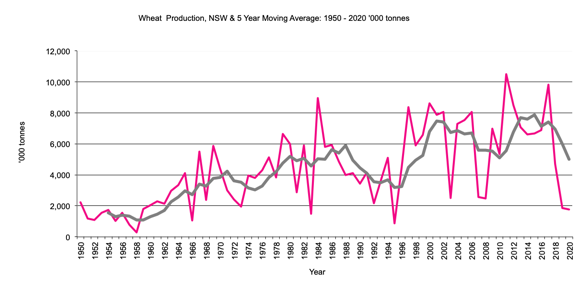
Production of Wheat '000 tonnes, 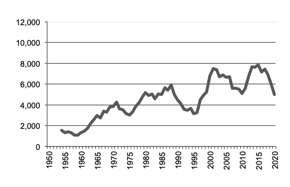
|
NSW Wheat Production graph |
Return to top of page |
|
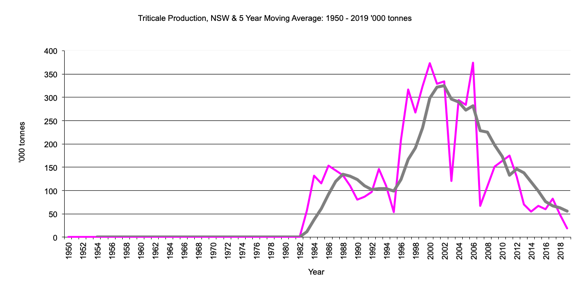
Production of Triticale '000 tonnes. 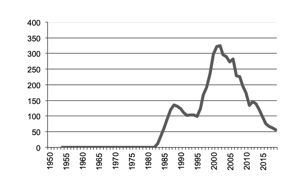
|
NSW Triticale Production graph |
Return to top of page |
|
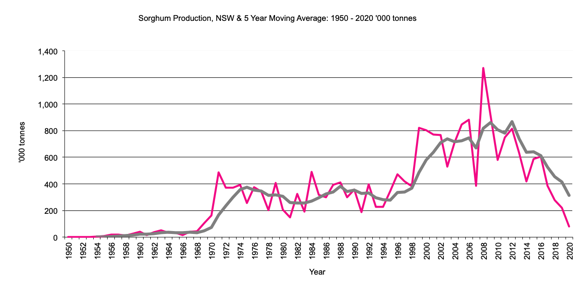
Production of Sorghum '000 tonne, 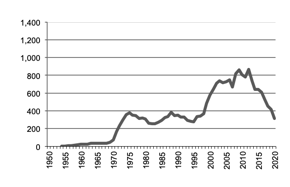
|
NSW Sorghum Production graph |
Return to top of page |
|
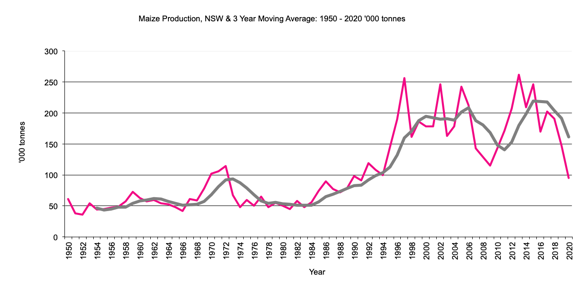
Production of Maize '000 tonnes. 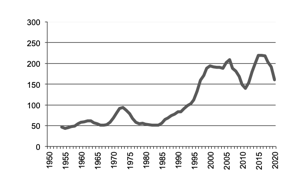
|
NSW Maize Production graph |
Return to top of page |
|
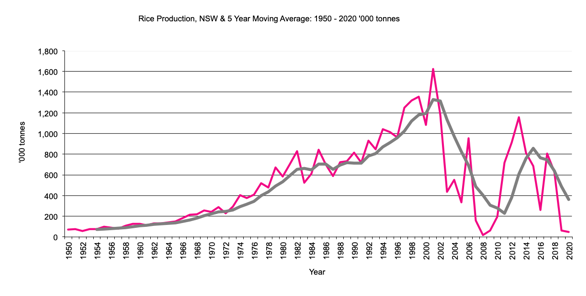
Production of Rice '000 tonnes, 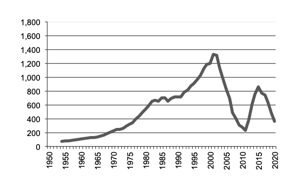
|
NSW Rice Production graph |
Return to top of page |
|
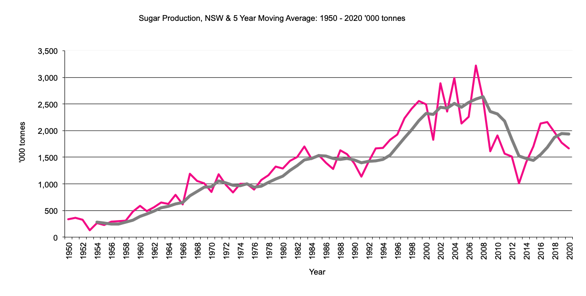
Production of Sugar '000 tonnes, 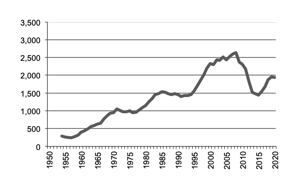
|
NSW Sugar Production graph |
Return to top of page |
|
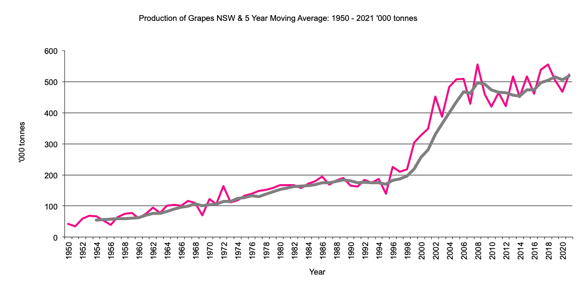
Production of Grapes '000 tonnes. 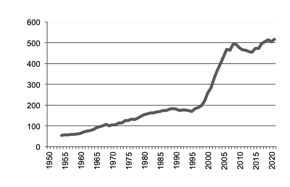
|
NSW Grapes Production graph |
Return to top of page |
|
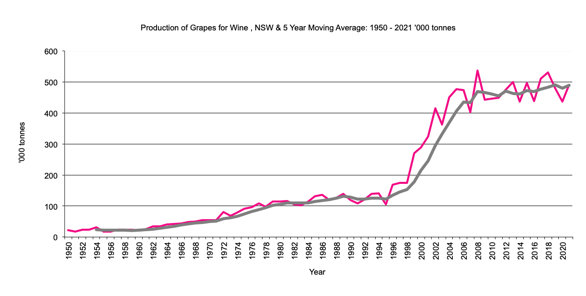
Production of Grapes - for Wine '000 tonnes. 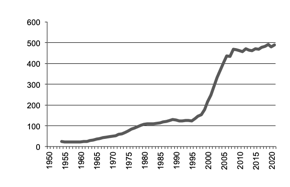
|
NSW Grapes - Production for Wine graph |
Return to top of page |
|
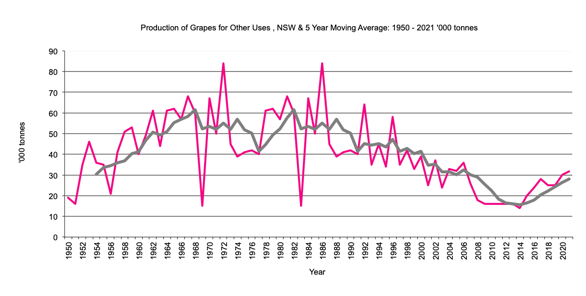
Other Grapes Production '000 tonnes. 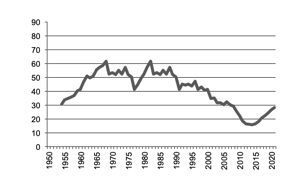
|
NSW Other Grapes Production graph |
Return to top of page |
|
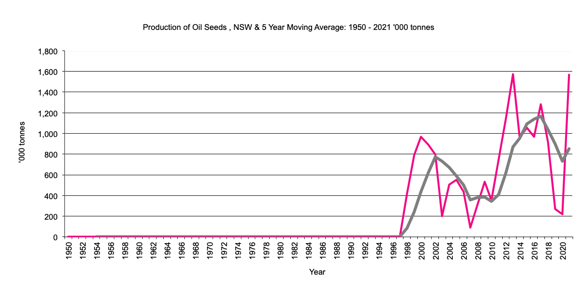
Production of Oil Seeds '000 tonnes. 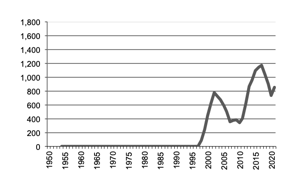
|
NSW Oil Seeds Production graph |
Return to top of page |
|
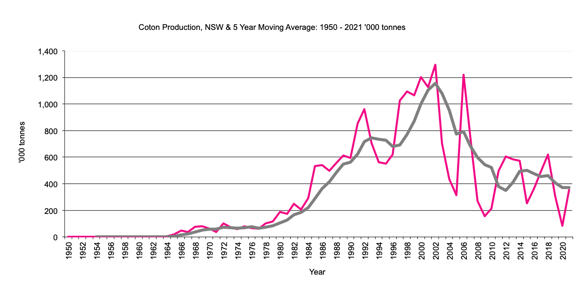
Production of Cotton '000 tonnes. 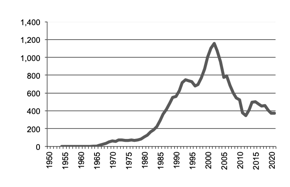
|
NSW Cotton Production graph |
Return to top of page |
|
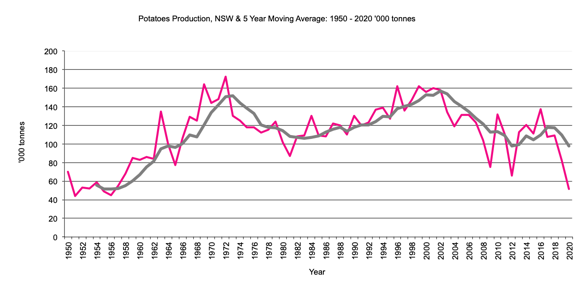
Production of Potato '000 tonnes, 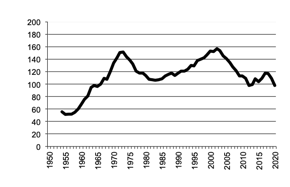
|
NSW Potato Production graph |
Return to top of page |
|
Production of Tobacco '000 tonnes. 
|
NSW Tobacco Production graph |
Return to top of page |