Area of all crops in million hectares 5 year moving average
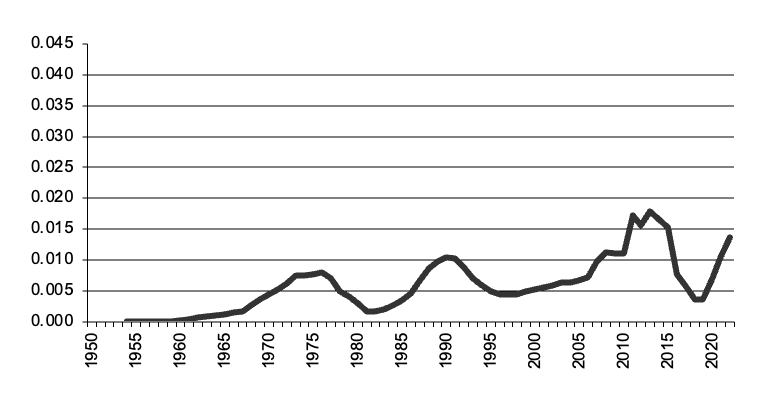
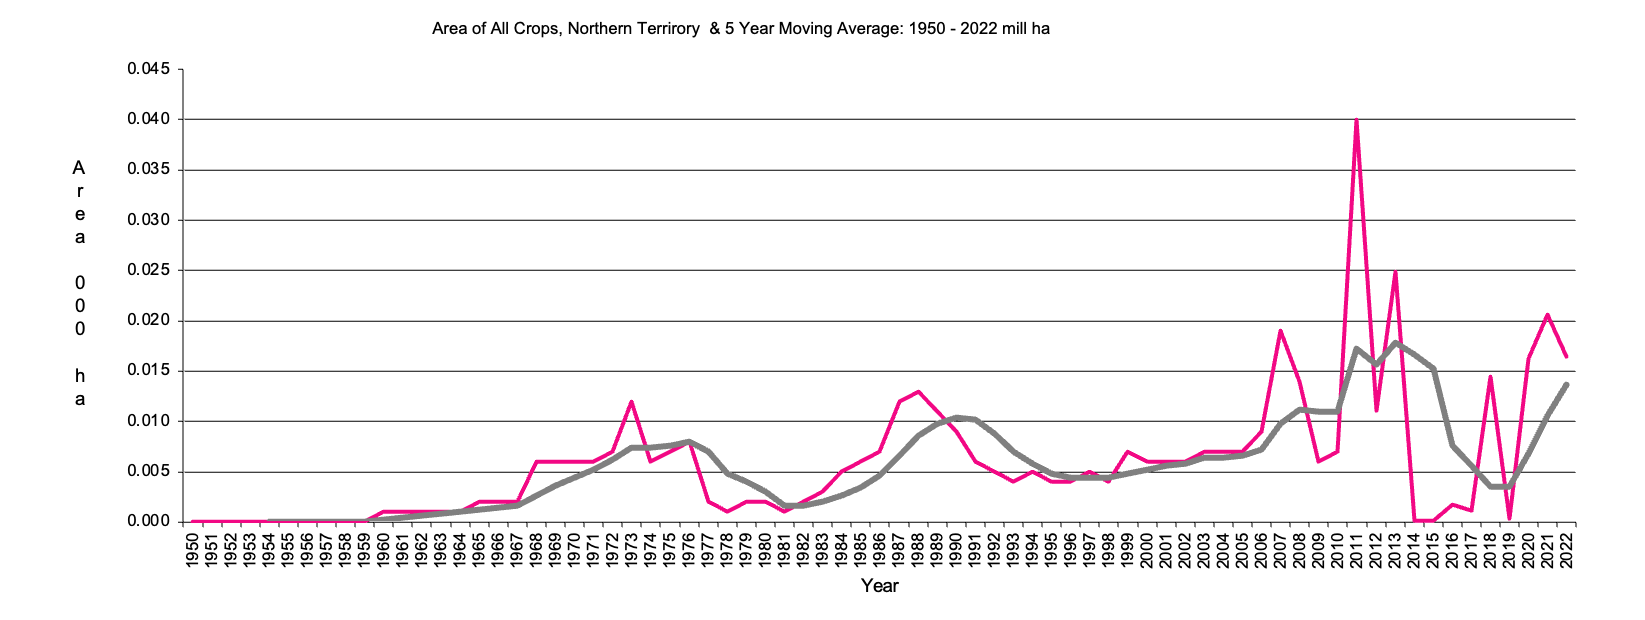
Northern Territory All Crops graph
Northern Territory All Crops data
Return to top of page
Back to data for States
Back to front page
This page has Northern Territory data for crops from 1950 to the present and the 5 year moving average. There is data for the area sown. Data for production and value of production will be added later.
| valign = top> |
|
|
Northern Territory All Crops - Area
|
Area of all crops in million hectares 5 year moving average
|
Northern Territory All Crops graph |
Return to top of page |
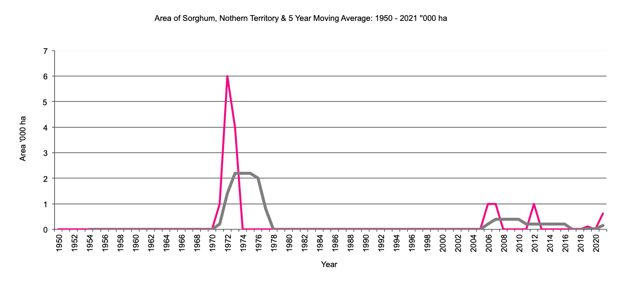
Northern Territory Sorghum - Area
|
Area of all Sorghum in '000 hectares, 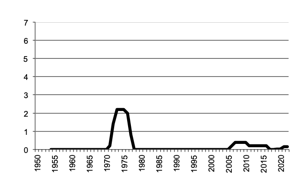
|
Northern Territory Sorghum graph |
Return to top of page |
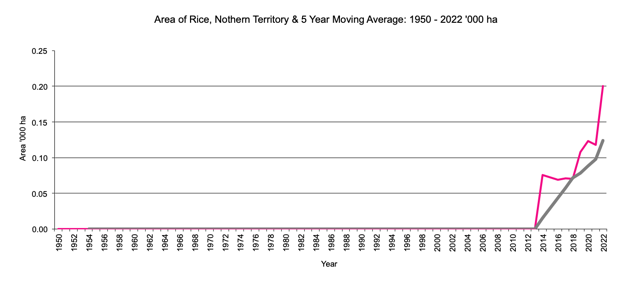
Northern Territory Rice - Area
|
Area of Rice in '000 hectares 5 year moving average 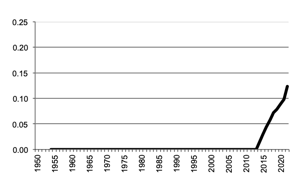
|
Northern Territory Rice graph |
Return to top of page |
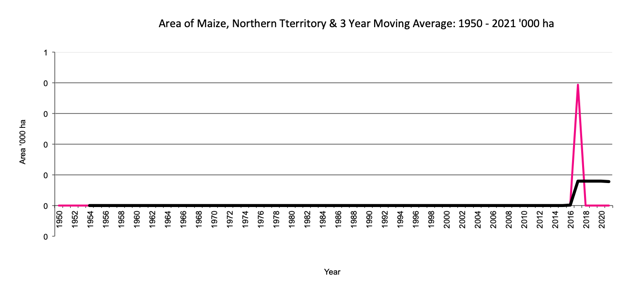
Northern Territory Maize - Area
|
Area of Maize in '000 hectares 5 year moving average 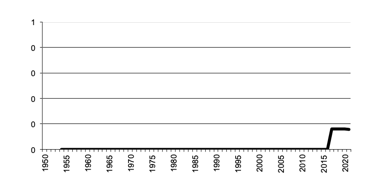
|
Northern Territory Maize graph |
Return to top of page |
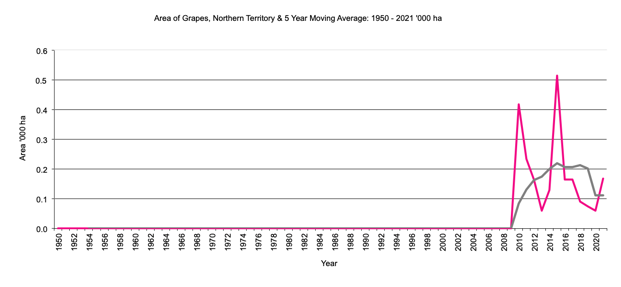
Northern Territory Grapes - Area
|
Area of Grapes in '000 hectares 5 year moving average 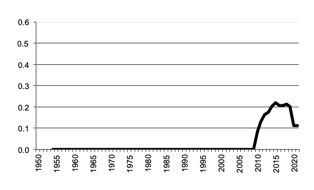
|
Northern Territory Grapes Area graph |
Return to top of page |
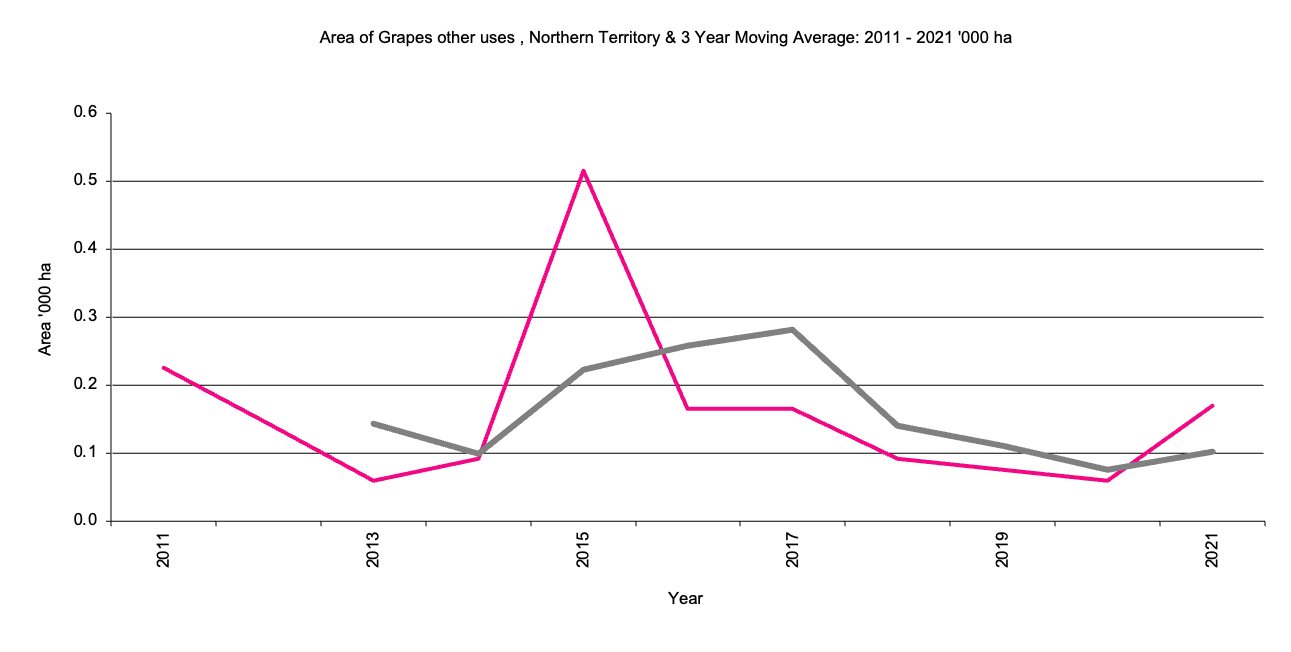
Northern Territory Grapes for Other Uses - Area
|
Area of grapes for other uses in '000 hectares, 3 year moving average 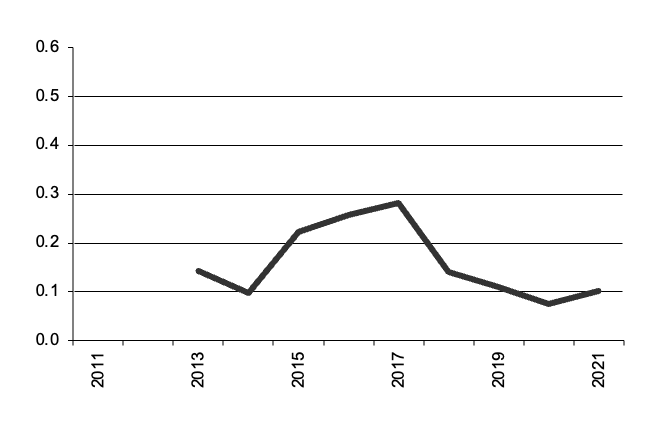
|
Northern Territory grapes for Other Uses graph |
Return to top of page |