Agricultural Data For Australia, Queensland Crops Gross Value Production

 1950 to Current Data

Crops Production

Introduction

This page has Queensland data for crops gross value production from 1950 to the present and the 3 year moving average.

The crops included here are: all crops, barley, oats, wheat, triticale, maize, rice, sorghum, sugar, grapes, cotton, oil seeds, potatoes and tobacco. All crops includes: crops, pastures and grasses, fruit and nuts, and vegetables.

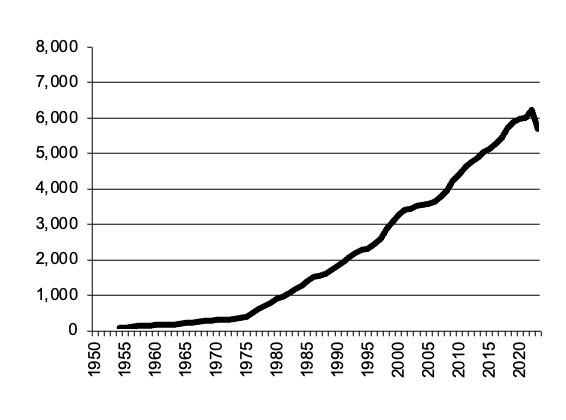
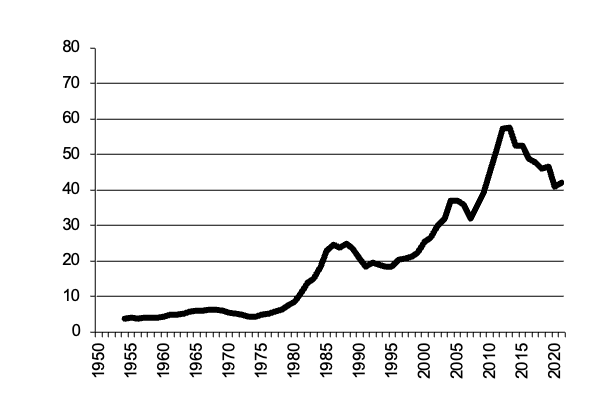
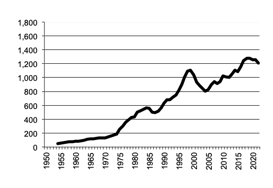
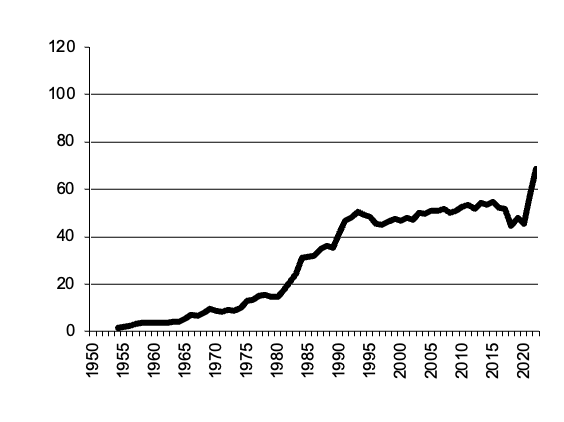
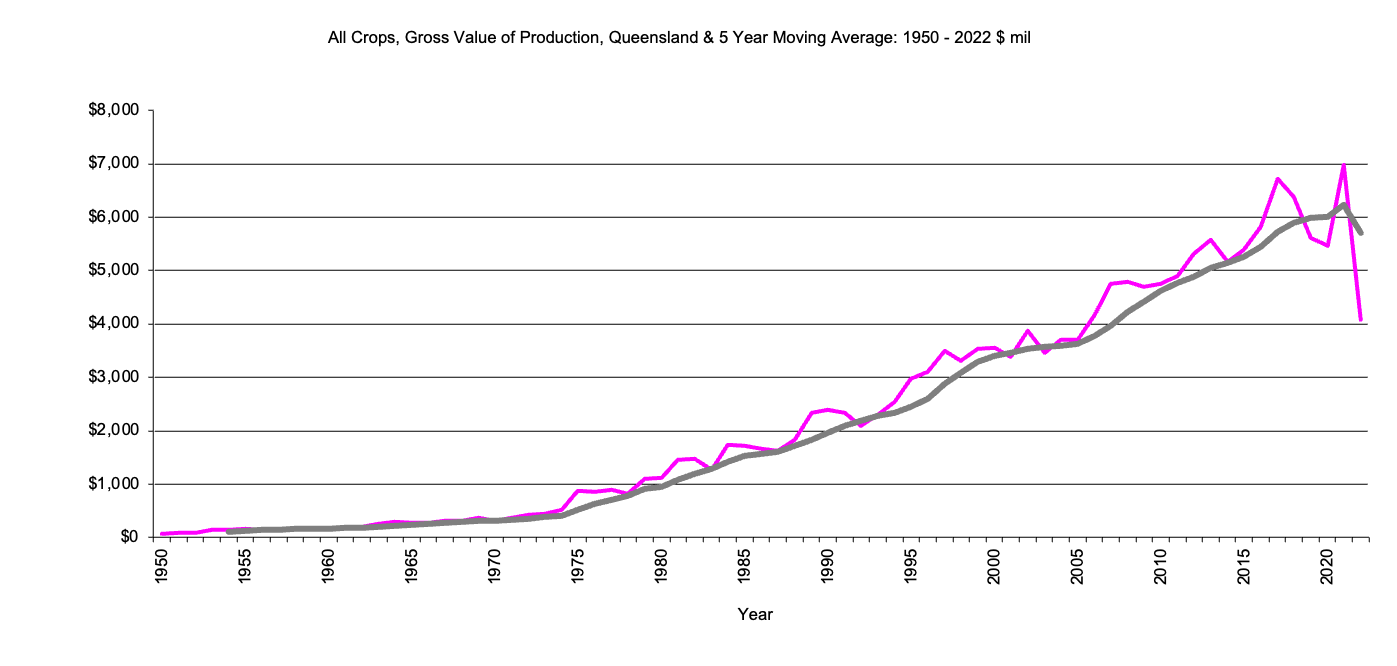
Queensland All Crops - Gross Value Production

Gross Value Production of all crops in $m,
5 year moving average

Value of Production all crops since 1950

Queensland     Gross Value Production of All Crops     graph
Queensland     Gross Value Production of All Crops     data

Return to top of page
Back to data for States
Back to front page

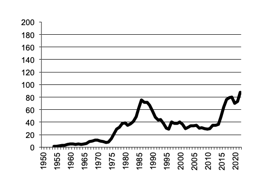
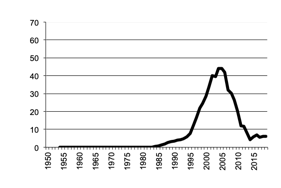
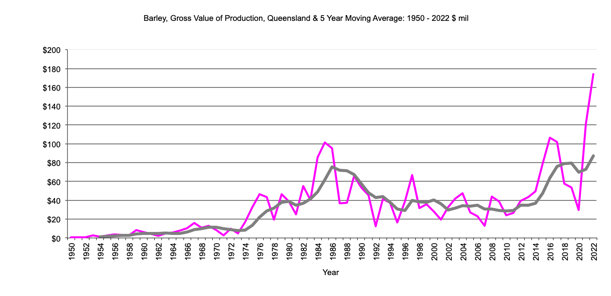
Queensland Barley - Gross Value Production

Gross Value Production of barley in $m,
5 year moving average

Value of Production barley since 1950

Queensland     Gross Value Production of Barley     graph
Queensland     Gross Value Production of Barley     data

Return to top of page
Back to data for States
Back to front page

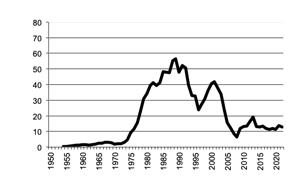
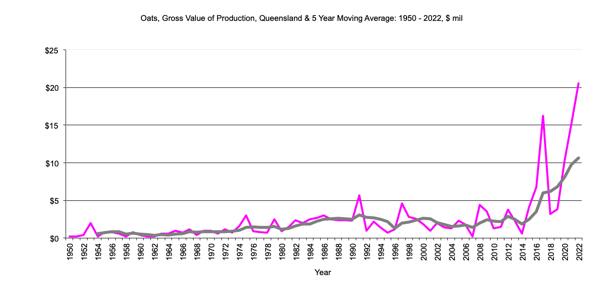
Queensland Oats - Gross Value Production

Gross Value Production of oats in $m.

Value of Production oats since 1950

Gross Value Production of Oats graph
Gross Value Production of Oats data

Return to top of page
Back to data for States
Back to front page

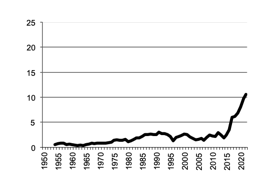
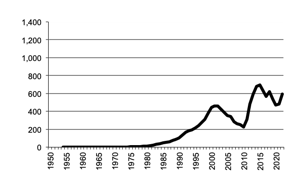
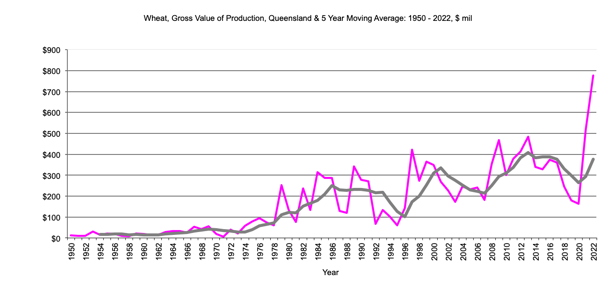
Queensland Wheat - Gross Value Production
Gross Value Production of wheat in $m,
5 year moving average

Value of Production wheat since 1950

Queensland     Gross Value Production of Wheat     graph
Queensland     Gross Value Production of Wheat     data

Return to top of page
Back to data for States
Back to front page

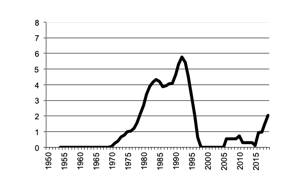
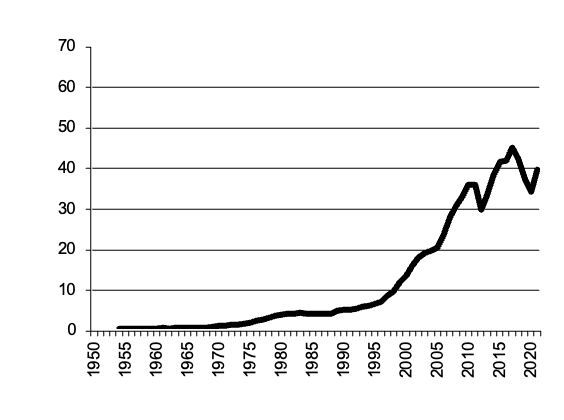
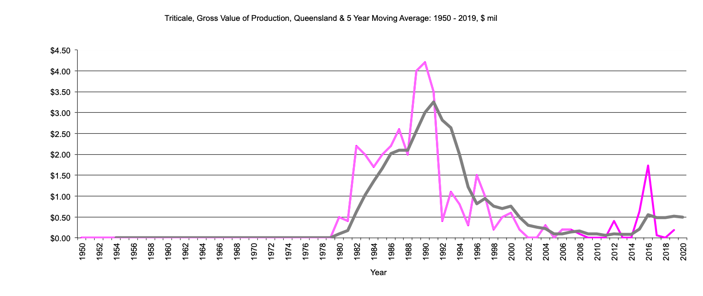
Queensland Triticale - Gross Value Production

Gross Value Production of triticale in $m,
5 year moving average

Value of Production triticale since 1950

Queensland     Gross Value Production of Triticale    graph
Queensland     Gross Value Production of Triticale     data

Return to top of page
Back to data for States
Back to front page

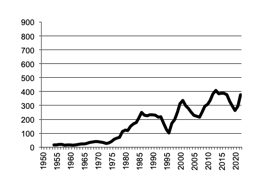
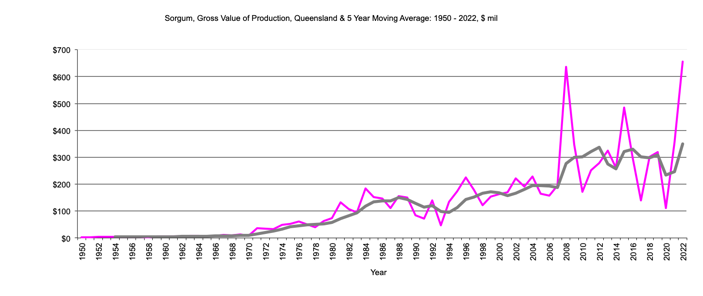
Queensland Sorghum - Gross Value Production

Gross Value Production of sorghum in $m,
5 year moving average

Value of Production sorghum since 1950

Queensland    Gross Value Production of Sorghum     graph
Queensland     Gross Value Production of Sorghum     data

Return to top of page
Back to data for States
Back to front page

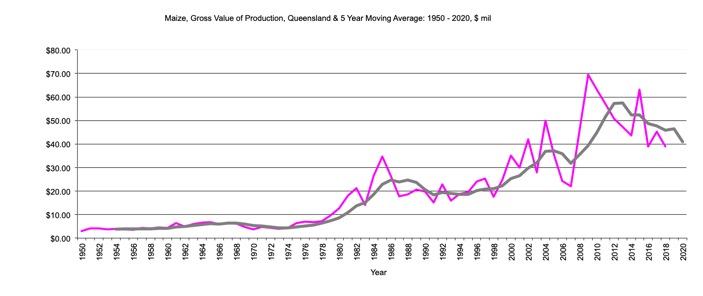
Queensland Maize - Gross Value Production

Gross Value Production of maize in $m,
5 year moving average

Value of Production maize since 1950

Queensland     Gross Value Production of Maize     graph
Queensland     Gross Value Production of Maize     data

Return to top of page
Back to data for States
Back to front page

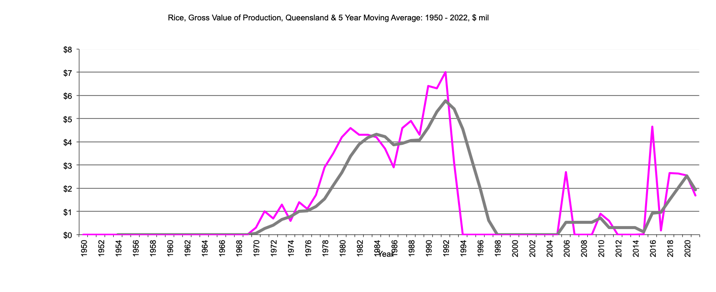
Queensland Rice - Gross Value Production

Gross Value Production of rice in $m,
5 year moving average

Value of Production rice since 1950

Queensland     Gross Value Production of Rice     graph
Queensland     Gross Value Production of Rice     data

Return to top of page
Back to data for States
Back to front page

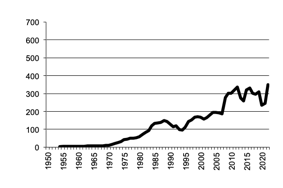
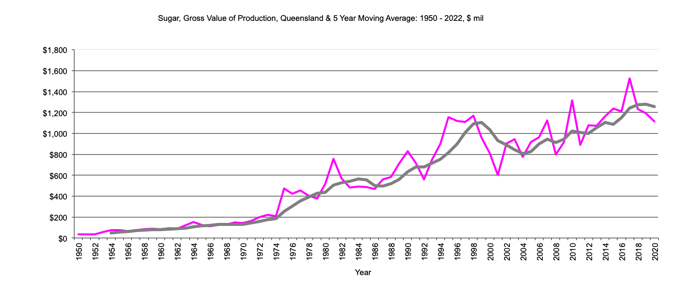
Queensland Sugar - Gross Value Production

Gross Value Production of sugar in $m,
5 year moving average

Value of Production sugar  since 1950

Queensland     Gross Value Production of Sugar    graph
Queensland     Gross Value Production of Sugar     data

Return to top of page
Back to data for States
Back to front page

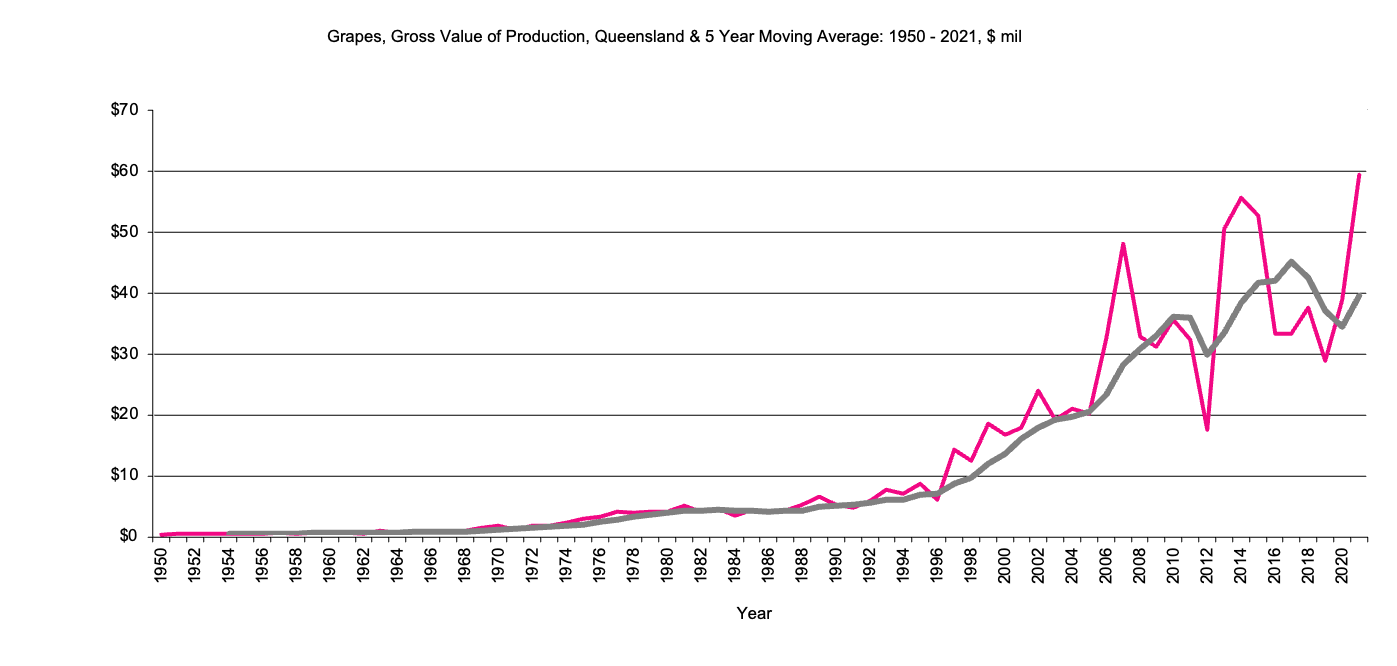
Queensland Grapes - Gross Value Production

Gross Value Production of grapes in $m,
5 year moving average

Value of Production grapes since 1950

Queensland     Gross Value Production of Grapes     graph
Queensland     Gross Value Production of Grapes     data

Return to top of page
Back to data for States
Back to front page

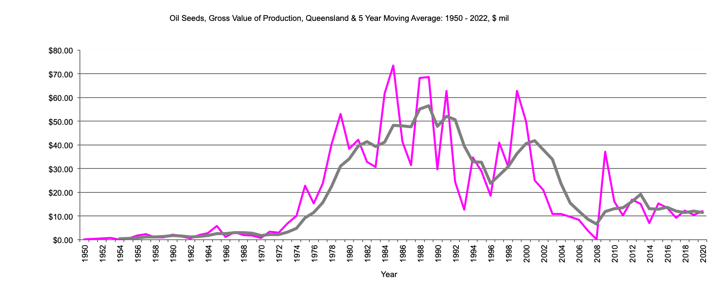
Queensland Oil Seeds - Gross Value Production

 Oil seeds includes: sunflower, safflower, soybeans, linseed, rapeseed, canola.


Gross Value Production of Oil Seeds in $m,
5 year moving average

Value of Production of oil seeds since 1950

Queensland     Gross Value Production of oil Seeds     graph
Queensland     Gross Value Production of Oil Seeds     data

Return to top of page
Back to data for States
Back to front page

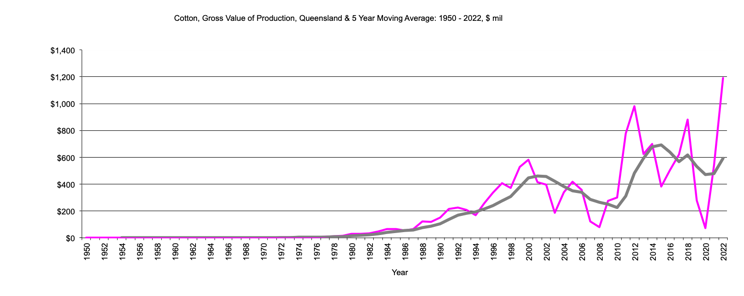
Queensland Cotton - Gross Value Production

Gross Value Production of cotton in $m,
5 year moving average

Value of Production cotton since 1950

Queensland     Gross Value Production of Cotton     graph
Queensland     Gross Value Production of Cotton     data

Return to top of page
Back to data for States
Back to front page

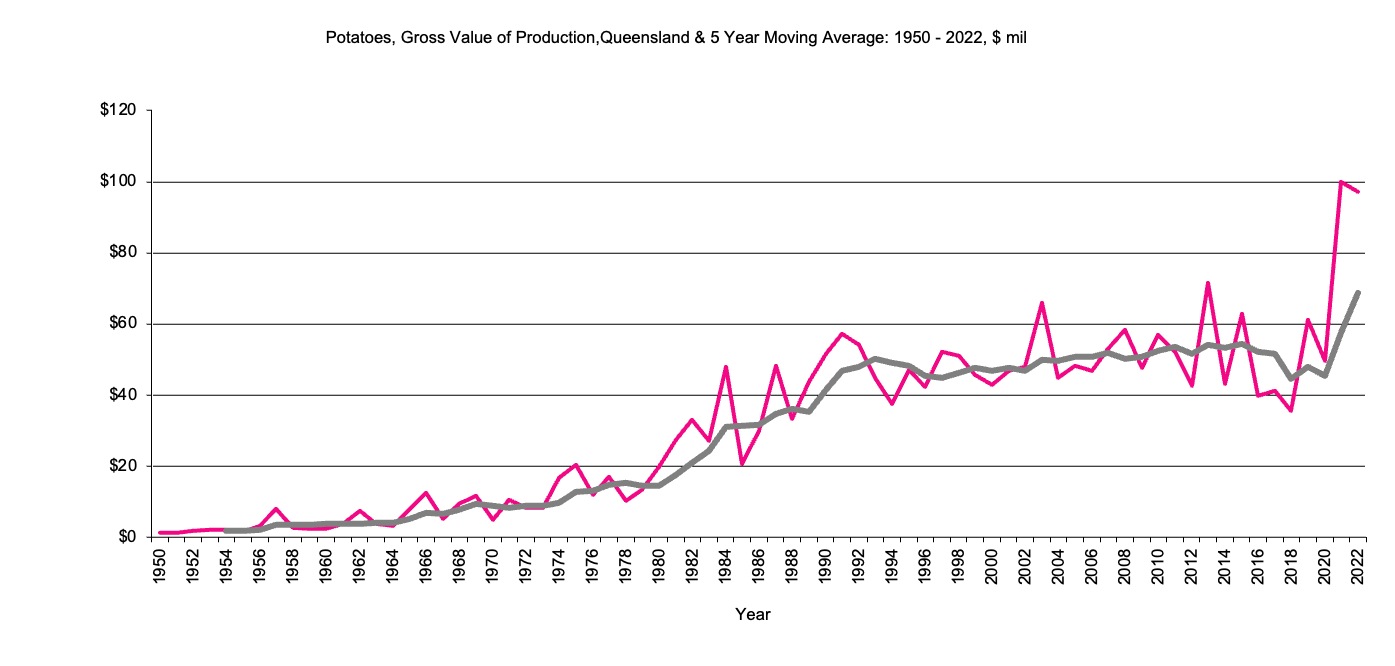
Queensland Potatoes - Gross Value Production

Gross Value Production of potatoes in $m,
5 year moving average

Value of Production potatoes since 1950

Queensland     Gross Value Production of Potatoes     graph
Queensland     Gross Value Production of Potatoes     data

Return to top of page
Back to data for States
Back to front page

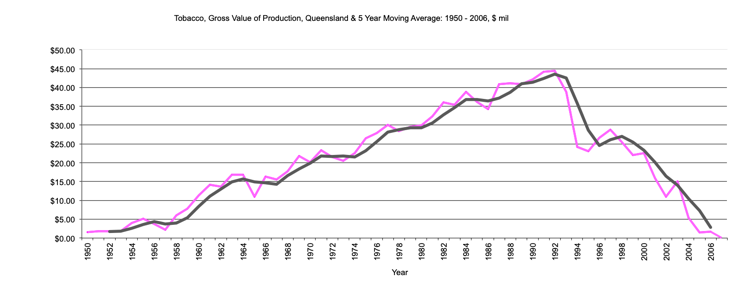
Queensland Tobacco - Gross Value Production

Gross Value Production of tobacco in $m,
5 year moving average

Value of Production tobacco since 1950

Queensland     Gross Value Production of Tobacco     graph
Queensland     Gross Value Production of Tobacco     data

Return to top of page
Back to data for States
Back to front page


Ag Data
Last Updated 17 February 2022
Site prepared by Bob Cason (rgcason@webone.com.au)Email for more information