1950 to Current Data
Livestock
Introduction
This page has South Australia data for livestock, gross value production from 1950 to the present and the 3 year moving average. There is data for cattle, sheep, poultry and pigs.
|
|
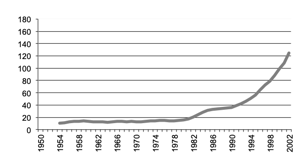
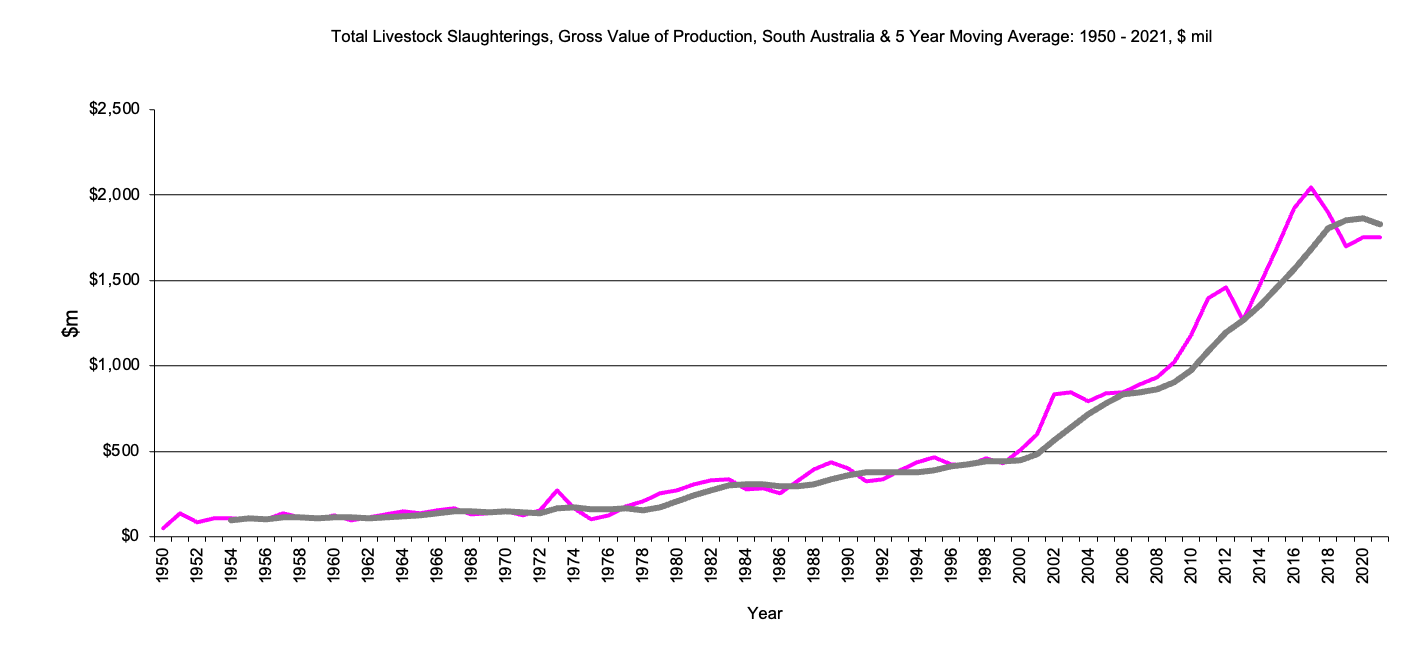
Total Livestock
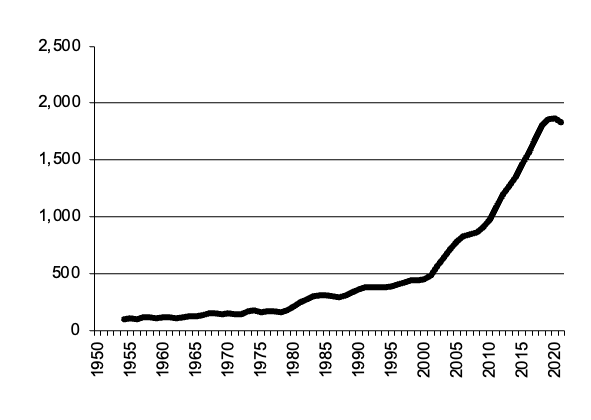
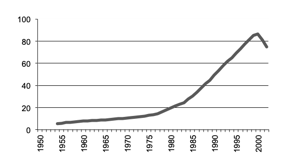
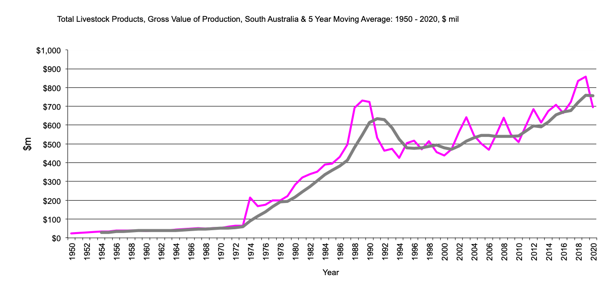
Total Livestock Products
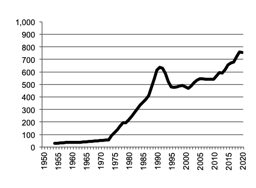
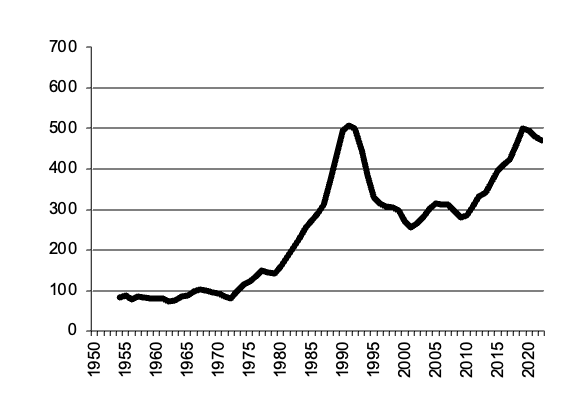
Cattle
|
Pigs
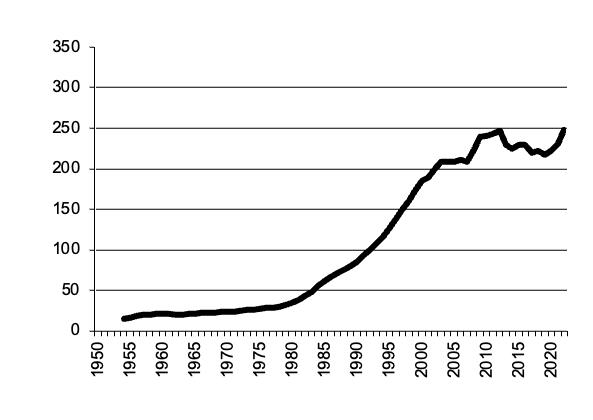
Sheep
Poultry
|
South AustraliaTotal Livestock Slaughtered- Value of Production
South Australia Total Livestock Products - Value of Production
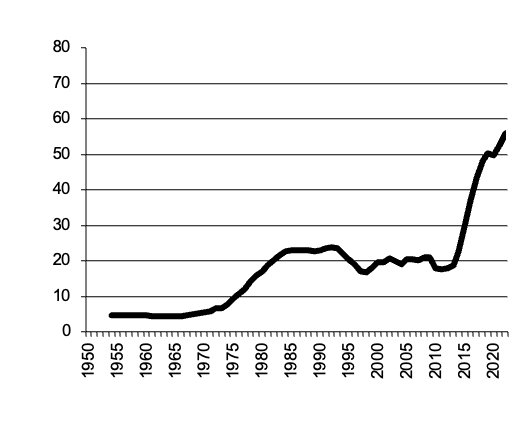
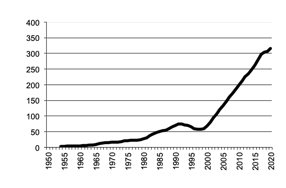
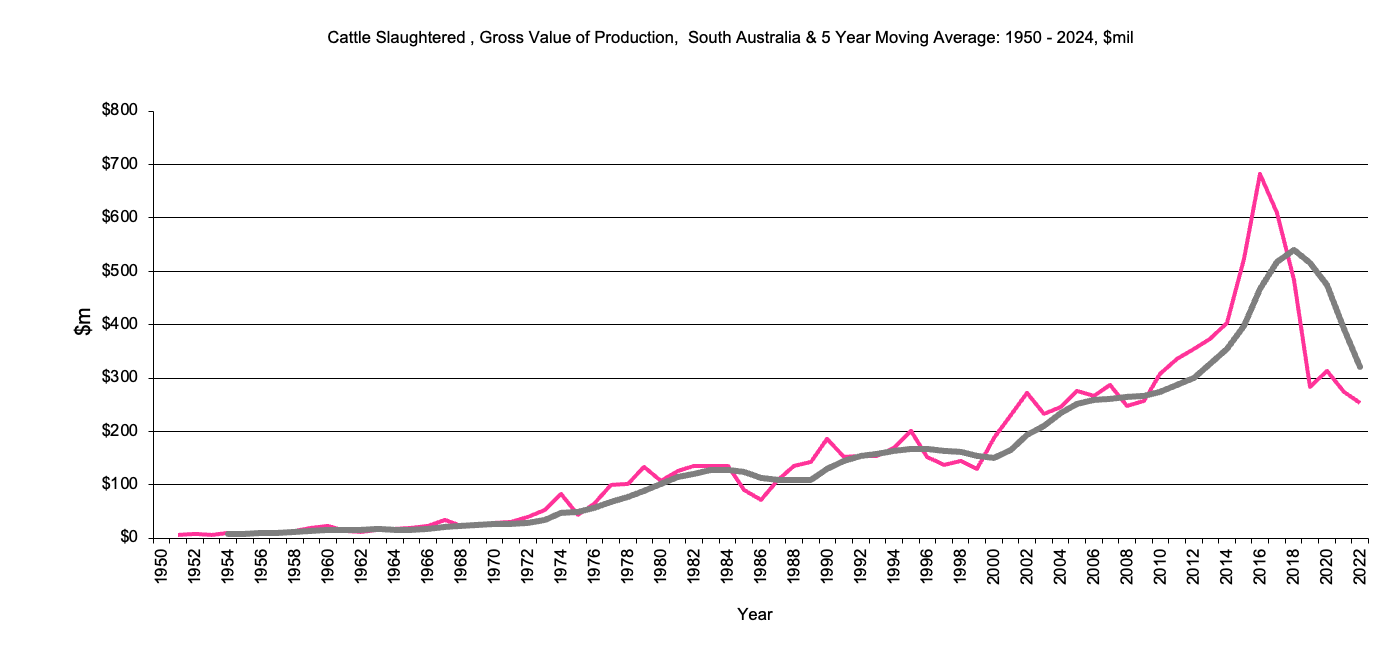
South Australia, Cattle, Gross Value Production
Cattle and calves slaughtered
Cattle gross value production in $m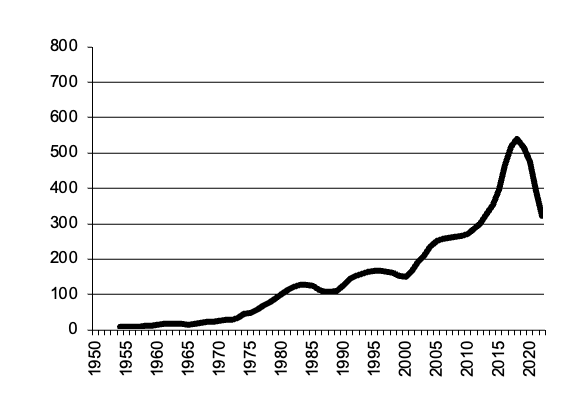
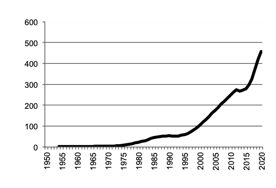
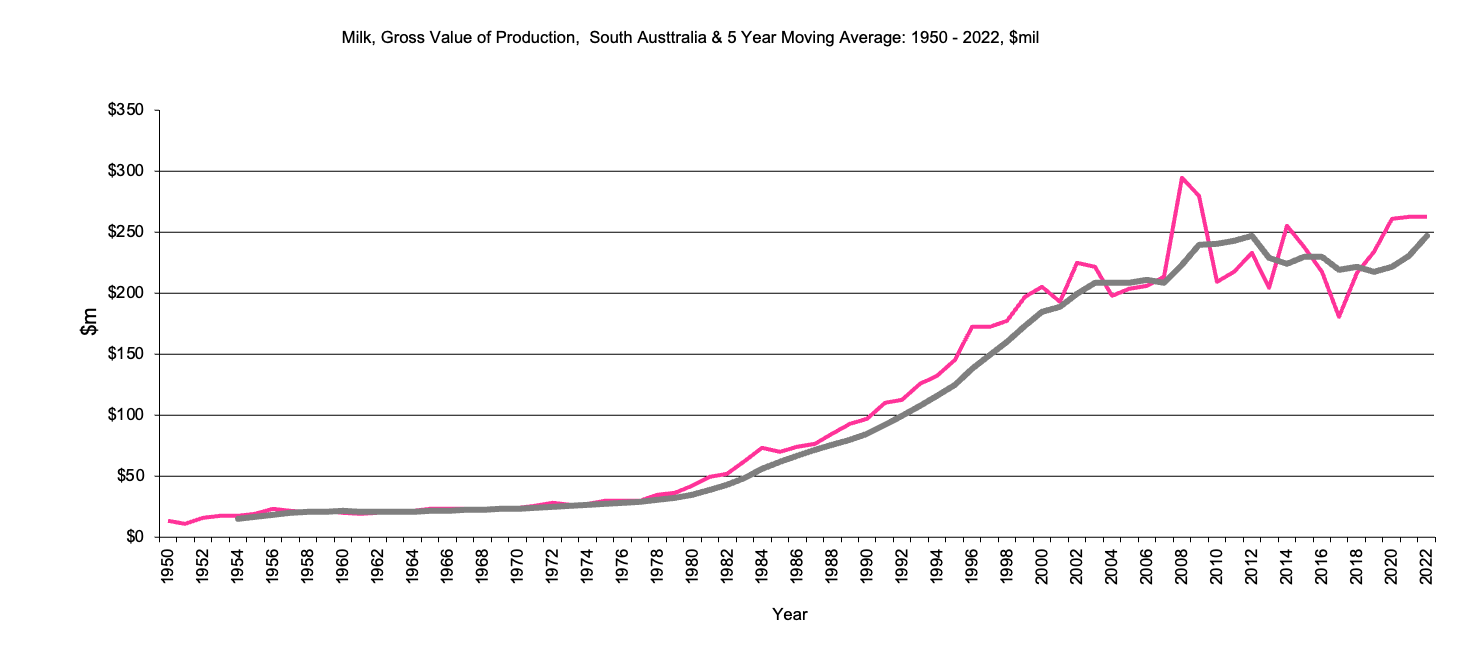
South Australia, Milk, Gross Value Production
South Australia, Manufacturing Milk, Gross Value Production
This data series ceased in 2003, when milk factories paid the same price for manufacturing and human consumption milk.
South Australia, Milk for Human Consumption, Gross Value Production
This data series ceased in 2003, when milk factories paid the same price for manufacturing and human consumption milk.
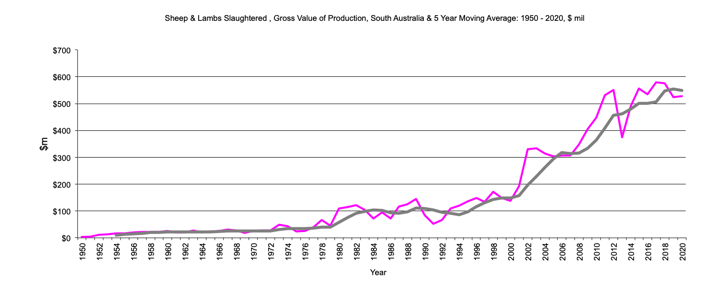
South Australia, Sheep Gross Value Production
Sheep and lambs slaughtered
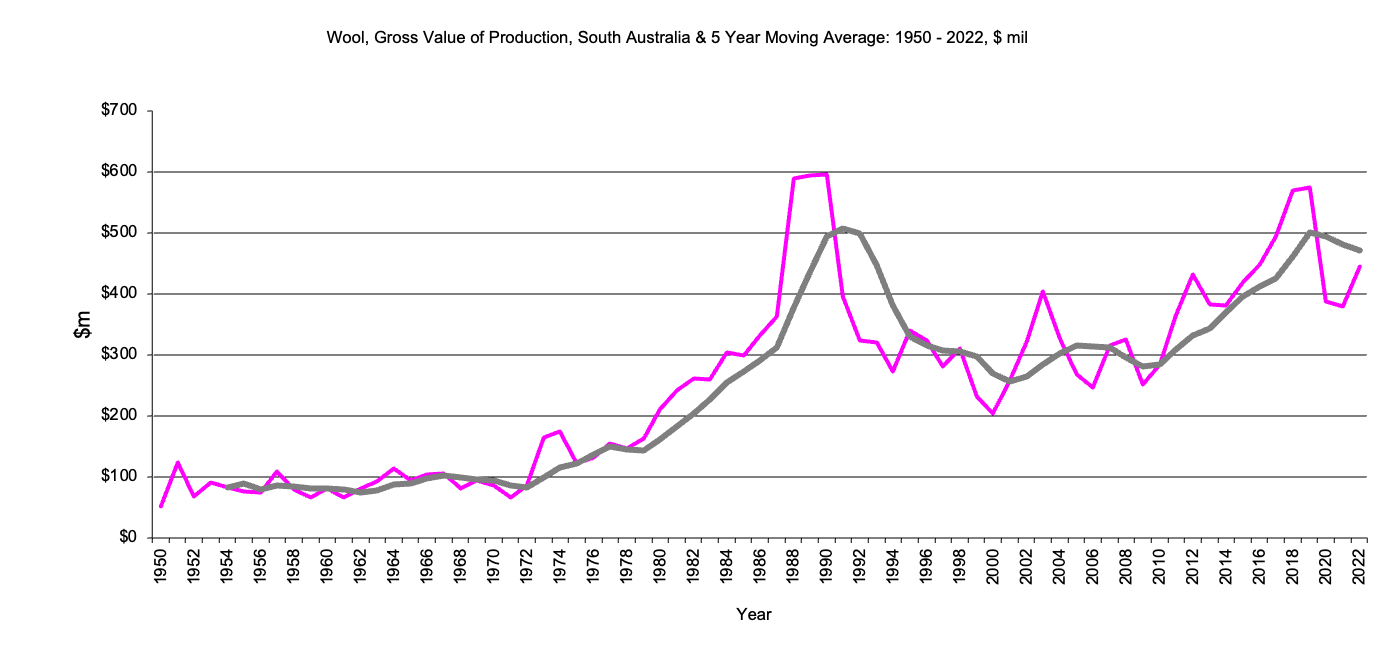
South Australia, Wool, Gross Value Production
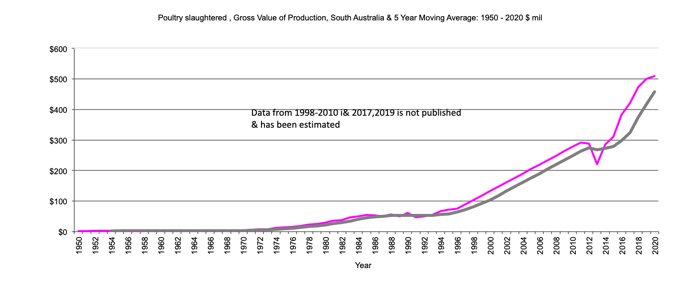
South Australia, Poultry, Gross Value Production
Poultry slaughtered
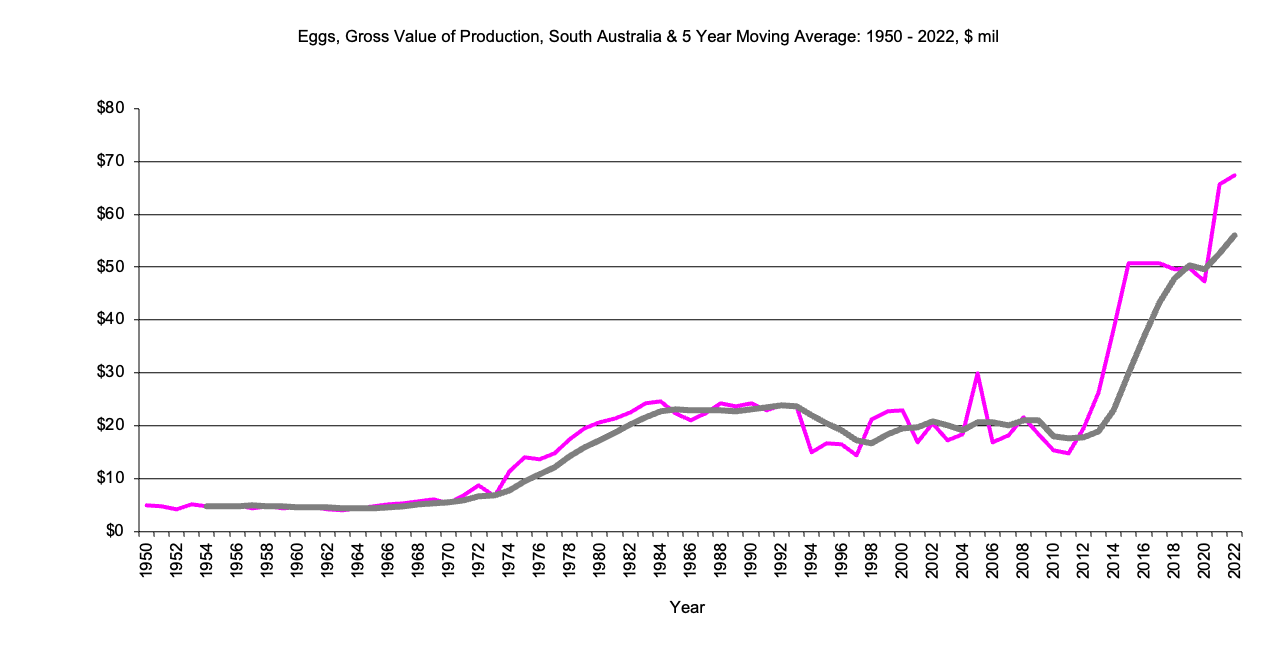
South Australia, Eggs Gross Value Production
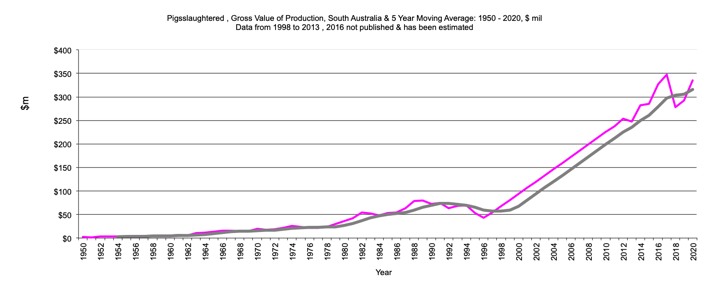
South Australia, Pigs Gross Value Production
AgEc Data
Last Updated 27 April 2022
Site prepared by Bob Cason (rgcason@webone.com.au)Email
for more information
