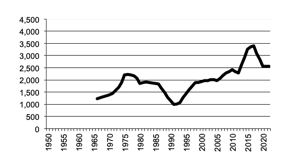
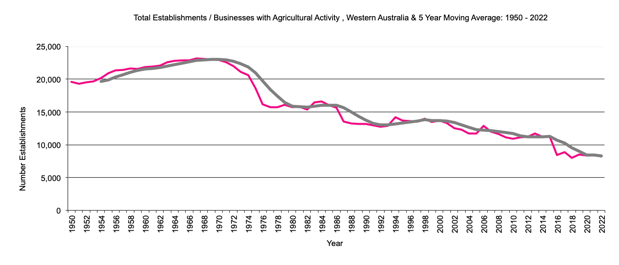
Western Australia Establishments with Agricultural Activity - Total
|
number of establishments with agricultural activity 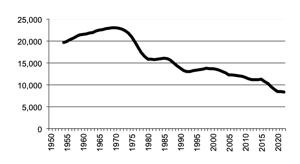
|
Western Australia Total establishments with agricultural activity graph |
Return to top of page Back to data for States Back to front page |
|
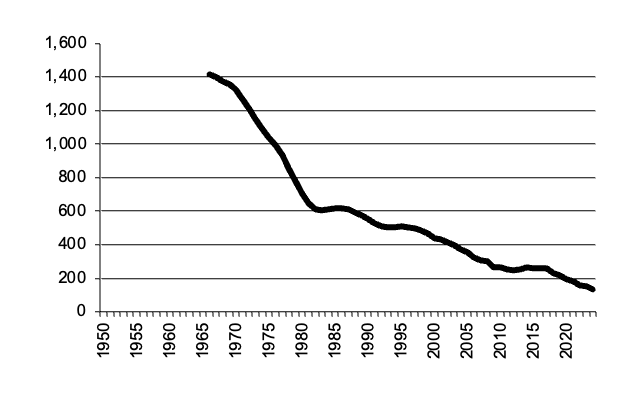
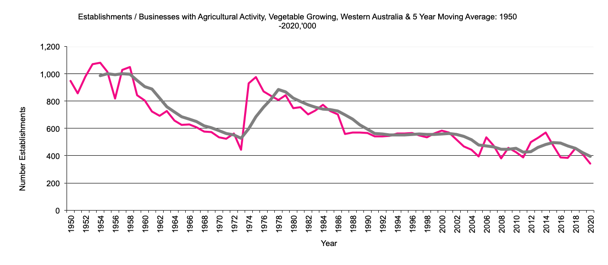
Number of establishments with vegetables 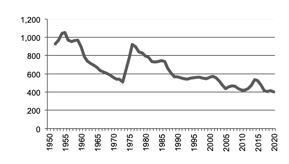
|
Western Australia establishments with vegetables graph |
Return to top of page |
|
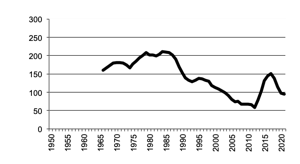
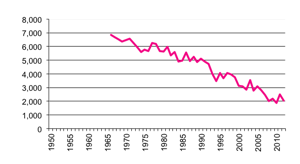
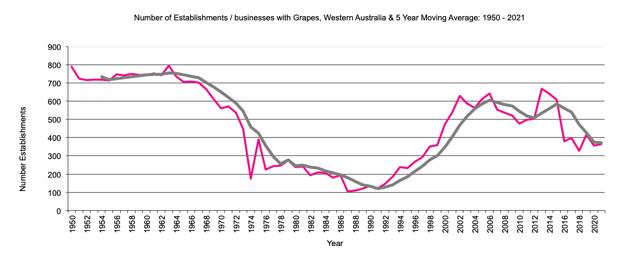
Number of establishments with Grapes 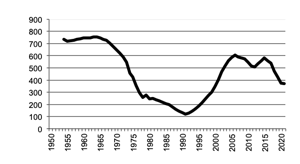
|
Western Australia establishments with grapes graph |
Return to top of page |
|
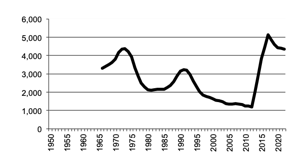
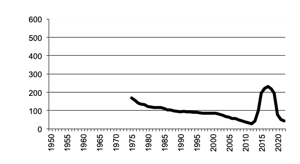
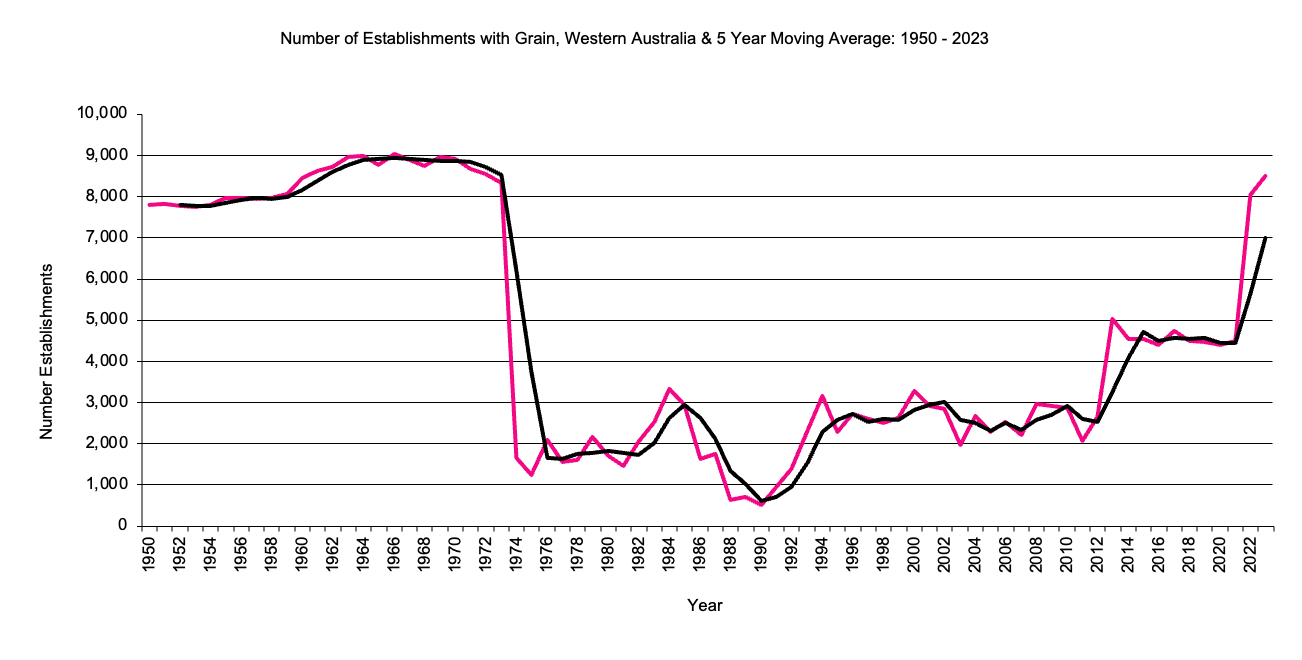
Number of establishments with Grain, 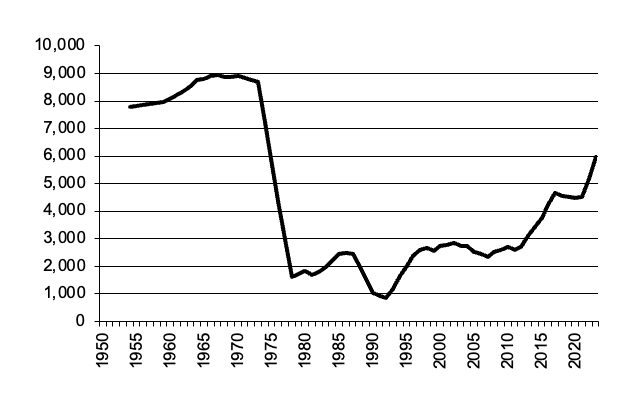
|
Western Australia establishments with grain graph |
Return to top of page |
|
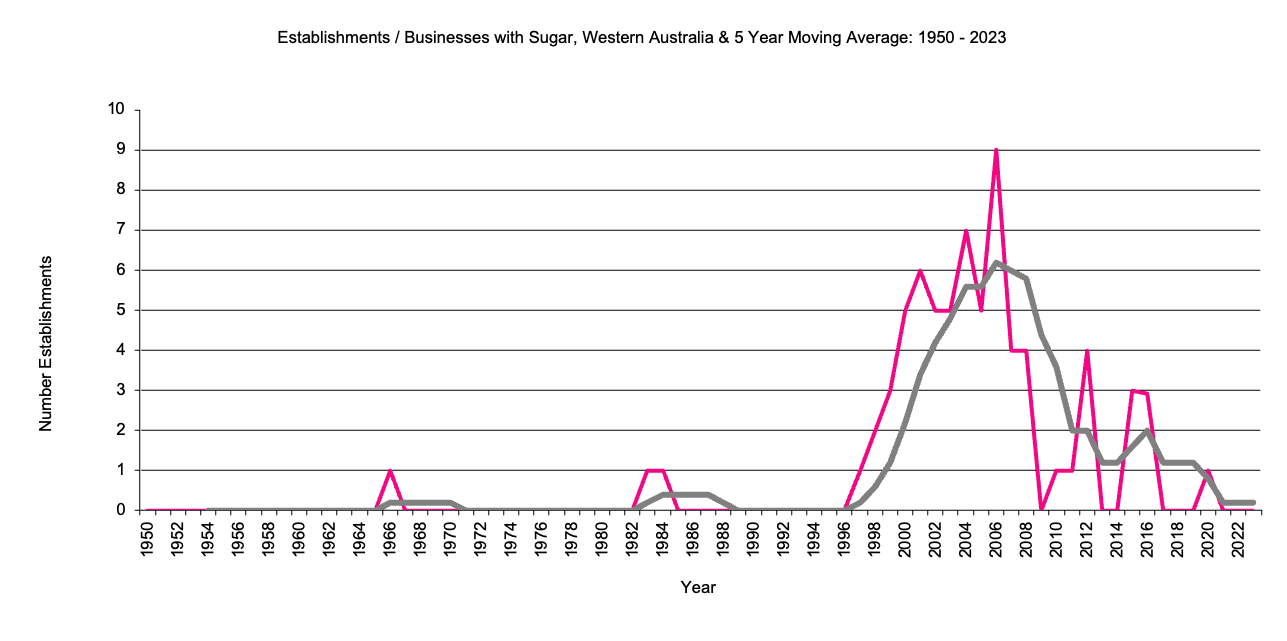
Number of establishments with sugar cane 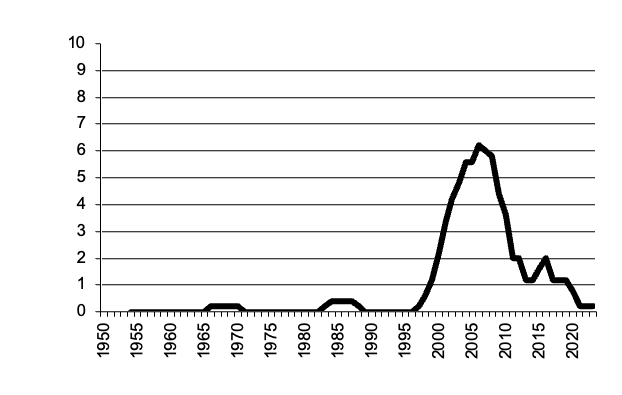
|
Western Australia establishments with sugar cane graph |
Return to top of page |
|
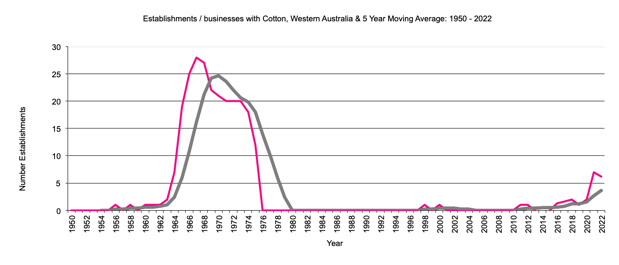
Number of establishments with Cotton Growing, 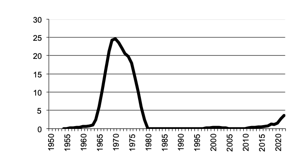
|
Western Australia establishments with cotton growing graph |
Return to top of page |
|
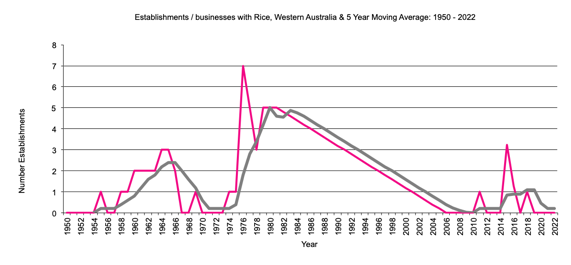
Number of establishments with Rice Growing, 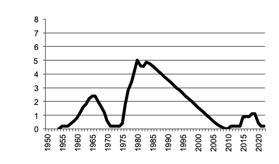
|
Western Australia establishments with rice growing graph |
Return to top of page |
