1950 to Current Data
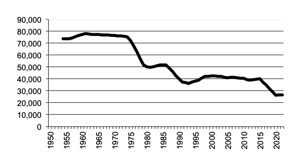
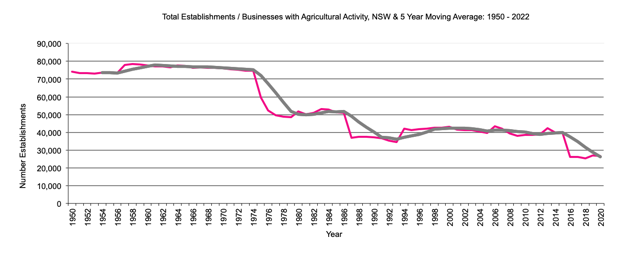
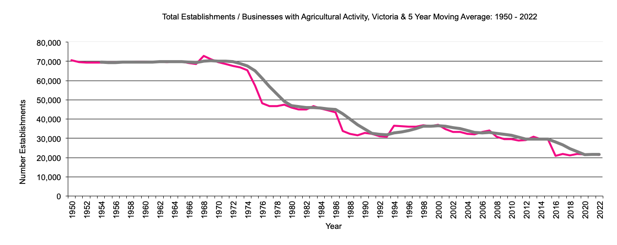
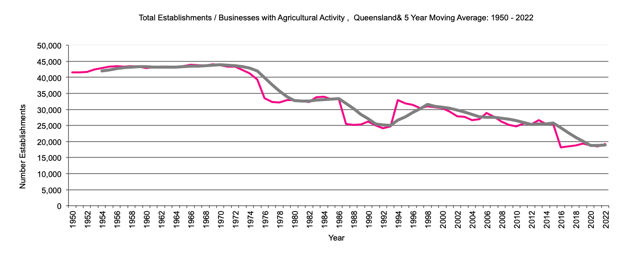
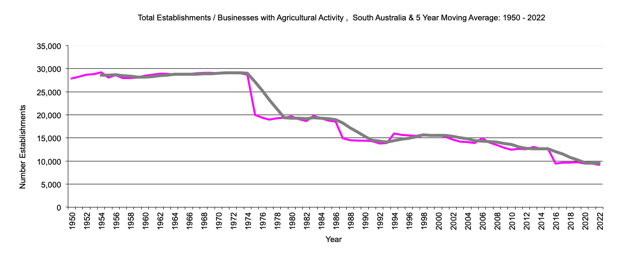
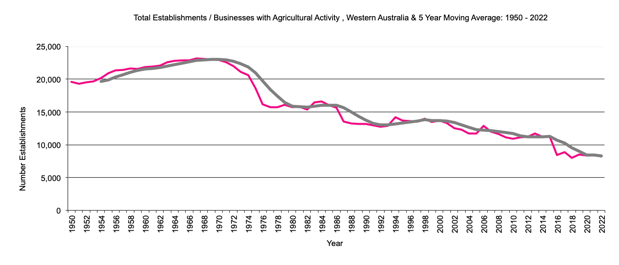
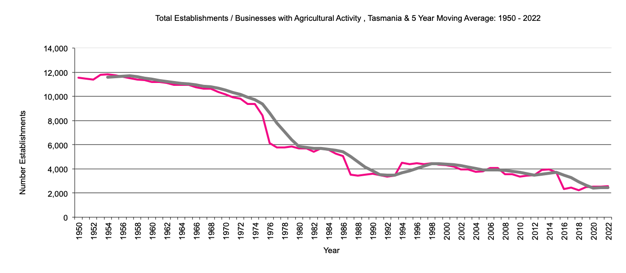
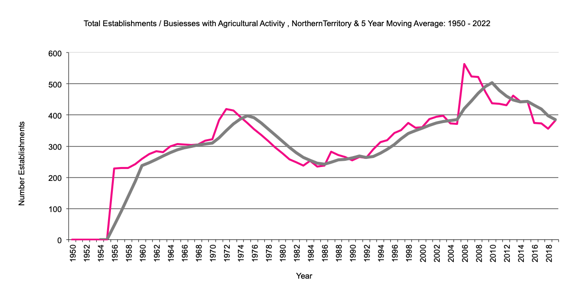
Changes in trends may be due to definitional changes. Main definitional changes have been: from 1950 to 1974 data refers to agricultural holdings, from 1975 the data is enterprises over 1 hectare with one or more agricultural establishments, from 1976 the criteria for inclusion changed to 10 hectares or more and an EVAO of $1,500 or more, from 1987 the EVAO criteria changed to $20,000 or more, from 1994 the EVAO criteria was reduced to $5,000 or more. From 2013 the definition changed to number of agricultural businesses.
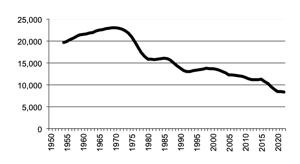
NSW
All Establishments / Businesses
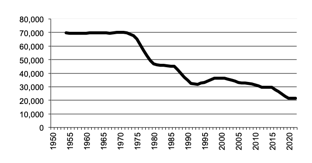
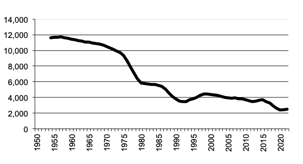
Victoria
All Establishments / Businesses
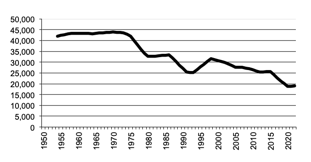
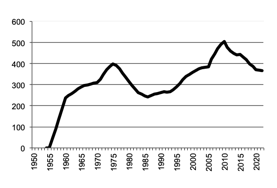
Queensland
All Establishments / Businesses
<
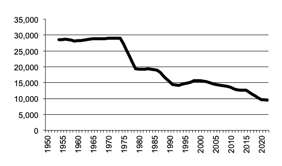
South Australia All Establishments / Businesses
Western Australia
All Establishments / Businesses
Tasmania
All Establishments / Businesses
Northern Territory
All Establishments / Businesses
AgEc Data
Last Updated 11 April 2023
Site prepared by Bob Cason (rgcason@webone.com.au)Email
for more information