Agricultural Data for Australia, Establishments With Pigs by State.

   1950 to Current Data

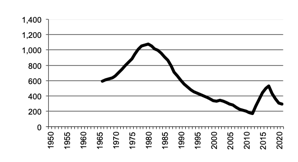
Changes in trends may be due to definitional changes. Main defintional changes have been: from 1950 to 1974 data refers to agricultural holdings, from 1975 the data is enterprises over 1 hectare with one or more agricultural establishments, from 1976 the criteria for inclusion changed to 10 hectares or more and an EVAO of $1,500 or more, from 1987 the EVAO criteria changed to $20,000 or more, from 1994 the EVAO criteria was reduced to $5,000 or more.
From 2013 the ABS switched to publishing data as agricultural businesses with the relevant activity where the business is registered on the Australian Tax Office (ATO) Australian Business Register (ABR), and the business has an estimated value of operations (EVAO) greater than $5,000. For further details users should contact the ABS.

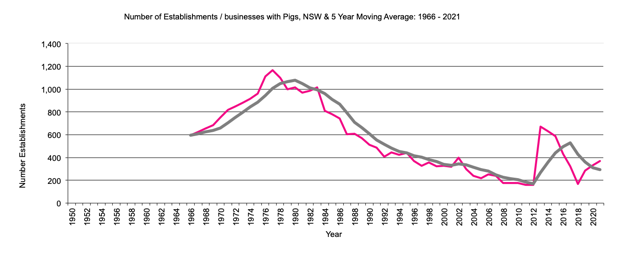
NSW Establishments / businesses with Pigs

"Number of Establishments / Businesses with Pigs since 1950,
5 year moving average"

Number of Establishments / Businesses with Pigs since 1950

NSW Establishments / Businesses with Pigs graph
NSW Establishments / Businesses with Pigs data

Return to top of page
Back to Structure
Back to front page

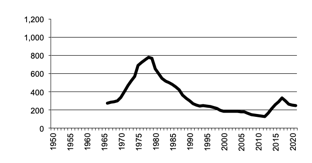
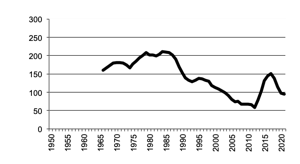
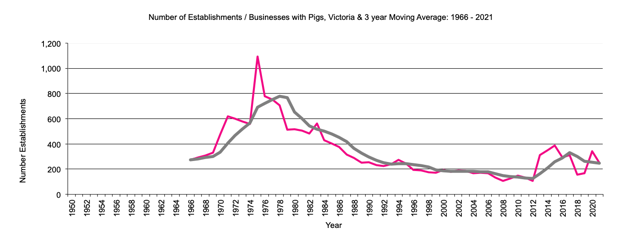
Victoria Establishments / businesses with Pigs

"Number of Establishments / Businesses with Pigs since 1950
5 year moving average"

Number of Establishments / Businesses with Pigs since 1950

Victoria Establishments / Businesses with Pigs graph
Victoria Establishments / Businesses with Pigs data

Return to top of page
Back to Structure
Back to front page

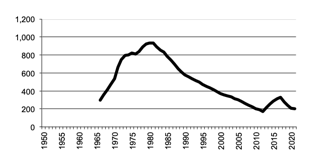
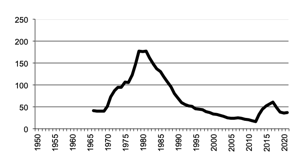
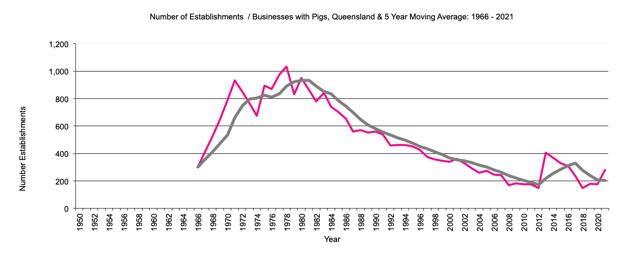
Queensland Establishments / businesses with Pigs

"Number of Establishments / Businesses with Pigs since 1950
5 year moving average"

Number of Establishments / Businesses with Pigs since 1950

Queensland Establishments / Businesses with Pigs graph
Queensland Establishments / Businesses with Pigs data

Return to top of page
Back to Structure
Back to front page

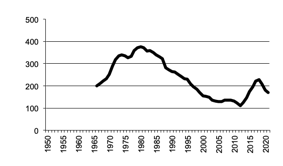
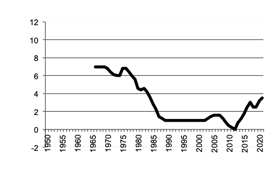
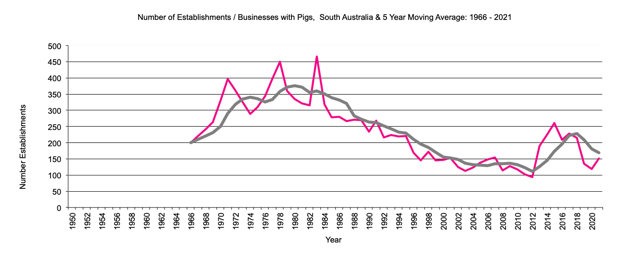
South Australia Establishments / businesses with Pigs

"Number of Establishments / Businesses with Pigs since 1950
5 year moving average"

Number of Establishments / Businesses with Pigs since 1950

South AustraliaEstablishments / Businesses with Pigs graph
South AustraliaEstablishments / Businesses with Pigs data

Return to top of page
Back to Structure
Back to front page

<

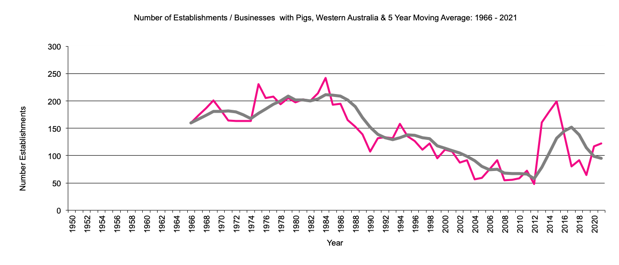
Western Australia Establishments / businesses with Pigs

"Number of Establishments / Businesses with Pigs since 1950
5 year moving average"

Number of Establishments / Businesses with Pigs since 1950

Western Australia Establishments / Businesses with Pigs graph
Western Australia Establishments / Businesses with Pigs data

Return to top of page
Back to Structure
Back to front page

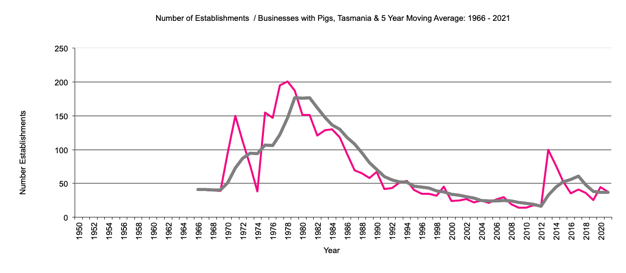
Tasmania Establishments / businesses with Pigs

"Number of Establishments / Businesses with Pigs since 1950
5 year moving average"

Number of Establishments / Businesses with Pigs since 1950

Tasmania Establishments / Businesses with Pigs graph
Tasmania Establishments / Businesses with Pigs data

Return to top of page
Back to Structure
Back to front page

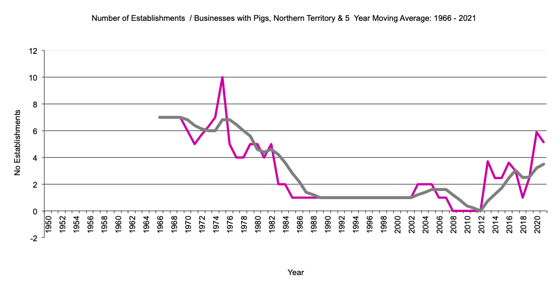
Northern Territory Establishments / businesses with Pigs

"Number of Establishments / Businesses with Pigs since 1950
5 year moving average"

Number of Establishments / Businesses with Pigs since 1950

Northern Territory Establishments / Businesses with Pigs graph
Northern Territory Establishments / Businesses with Pigs data

Return to top of page
Back to Structure
Back to front page


AgEc Data
Last Updated 31 October 2022
Site prepared by Bob Cason (rgcason@webone.com.au)Email for more information