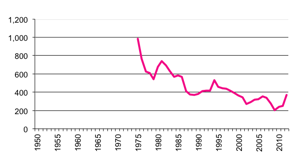
NSW Establishments With Sheep & Beef
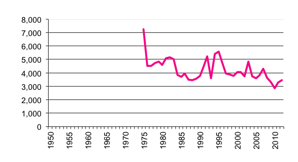
Number of Establishments With Sheep & Beef.
Changes in trends may be due to definitional changes. Main defintional changes have been: from 1950 to 1974 data refers to agricultural holdings, from 1975 the data is enterprises over 1 hectare with one or more agricultural establishments, from 1976 the criteria for inclusion changed to 10 hectares or more and an EVAO of $1,500 or more, from 1987 the EVAO criteria changed to $20,000 or more, from 1994 the EVAO criteria was reduced to $5,000 or more.
|
NSW Establishments With Sheep & Beef |
|
|
Number of Establishments With Sheep & Beef. |
|
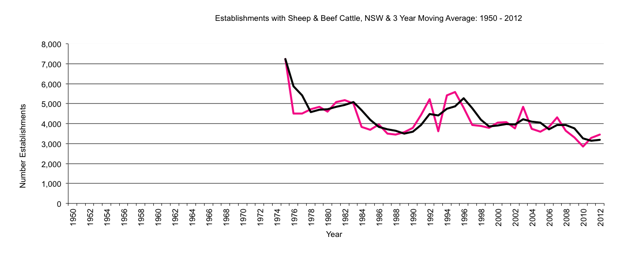
NSW Establishments With Sheep & Beef Cattle graph |
Return to top of page |
|
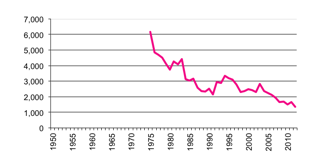
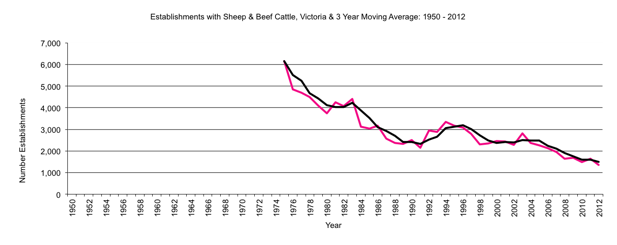
Victoria Establishments With Sheep & Beef |
|
|
Number of Establishments With Sheep & Beef Cattle. |
|
Victoria Establishments With Sheep & Beef graph |
Return to top of page |
|
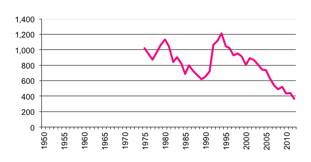
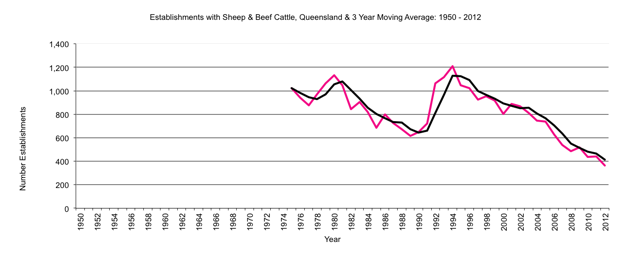
Queensland Establishments With Sheep & Beef |
|
|
Number of Establishments With Sheep & Beef. |
|
Queensland Establishments With Sheep & Beef graph |
Return to top of page |
|
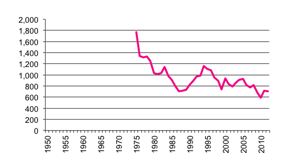
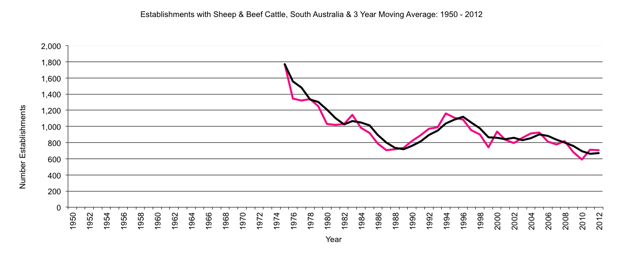
South Australia Establishments With Sheep & Beef |
|
|
Number of Establishments With Sheep & Beef. |
|
South Australia Establishments With Sheep & Beef graph |
Return to top of page |
|
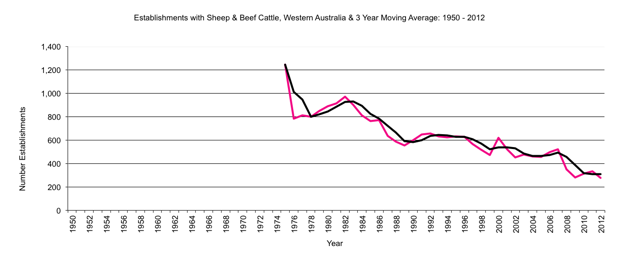
Western Australia Establishments With Sheep & Beef |
|
|
Number of Establishments With Sheep & Beef. |
|
Western Australia Establishments With Sheep & Beef graph |
Return to top of page |
|
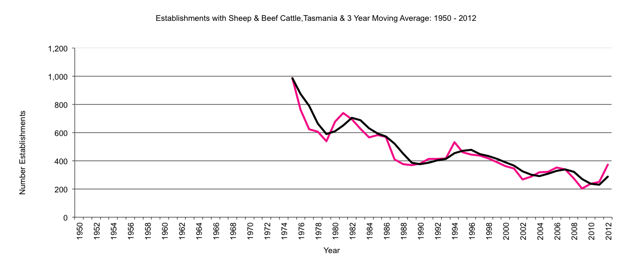
Tasmania Establishments With Sheep & Beef |
|
|
Number of Establishments With Sheep & Beef. |
|
Tasmania Establishments With Sheep & Beef graph |
Return to top of page |
|
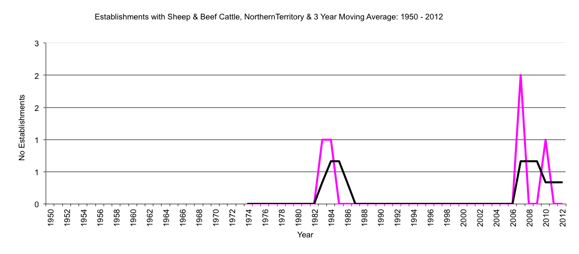
Northern Territory Establishments With Sheep & Beef |
|
|
Number of Establishments With Sheep & Beef. |
|
Northern Territory Establishments With Sheep & Beef graph |
Return to top of page |