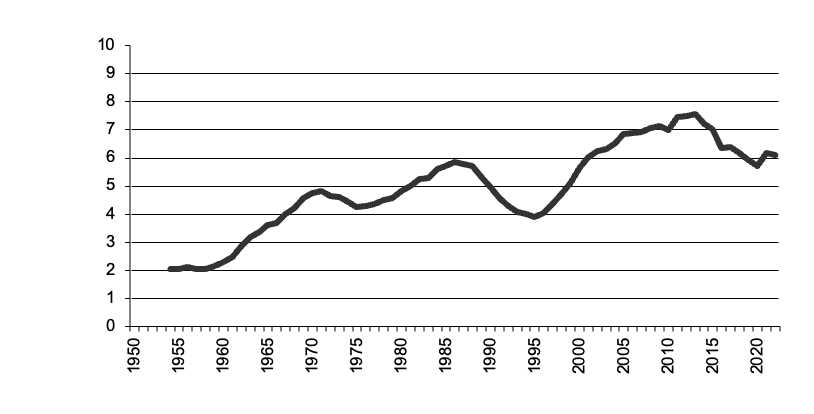
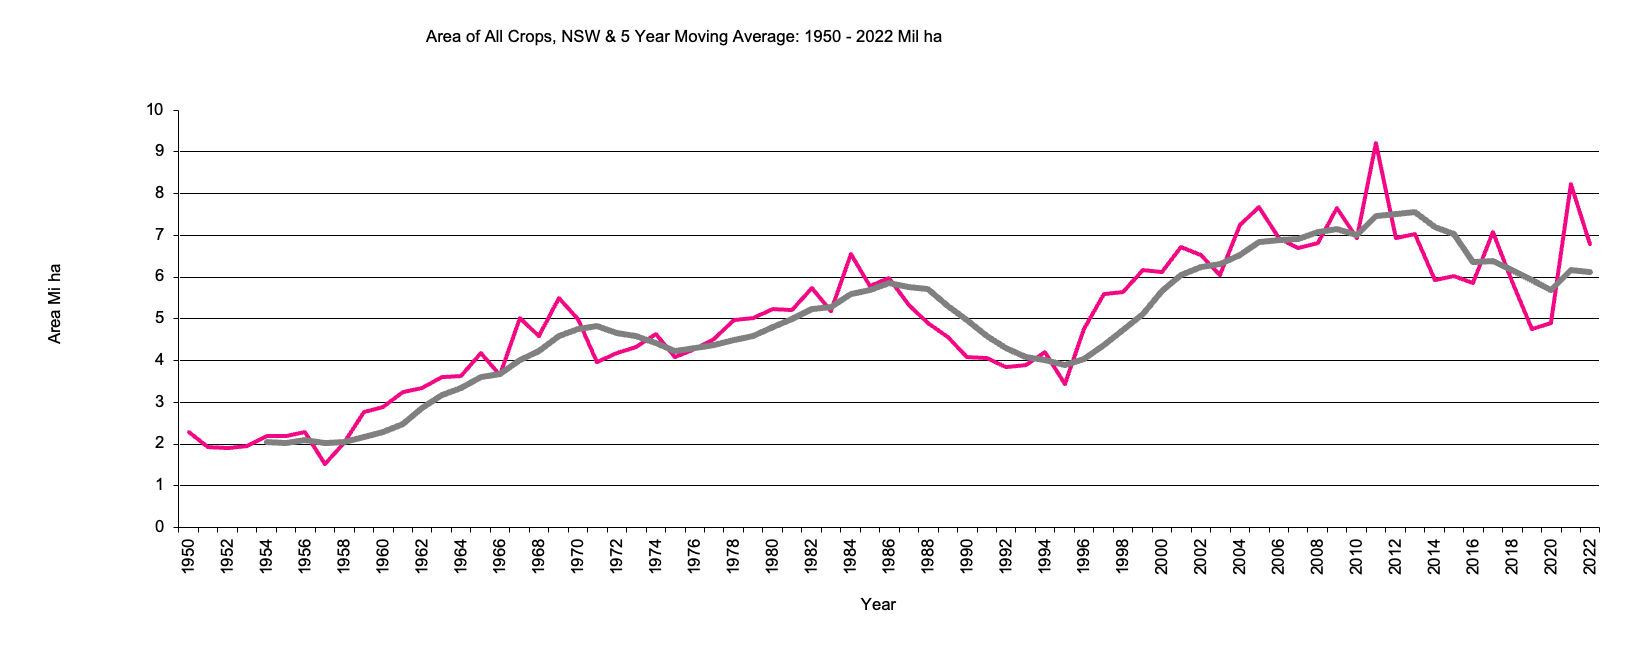
Area of all crops in million hectares, 5 year moving average.
NSW All Crops graph
NSW All Crops data
Return to top of page
Back to Crops
Back to front page
|
|
NSW All Crops
|
Area of all crops in million hectares, 5 year moving average.
|
NSW All Crops graph |
Return to top of page |
Area of crops has reached over 7mil hectares. Previously the area peaked around 1969,1983, 2005 and 2013 suggesting around 15 year cycles. The area of all crops is dominated by the area sown to wheat.
Victoria All Crops
|
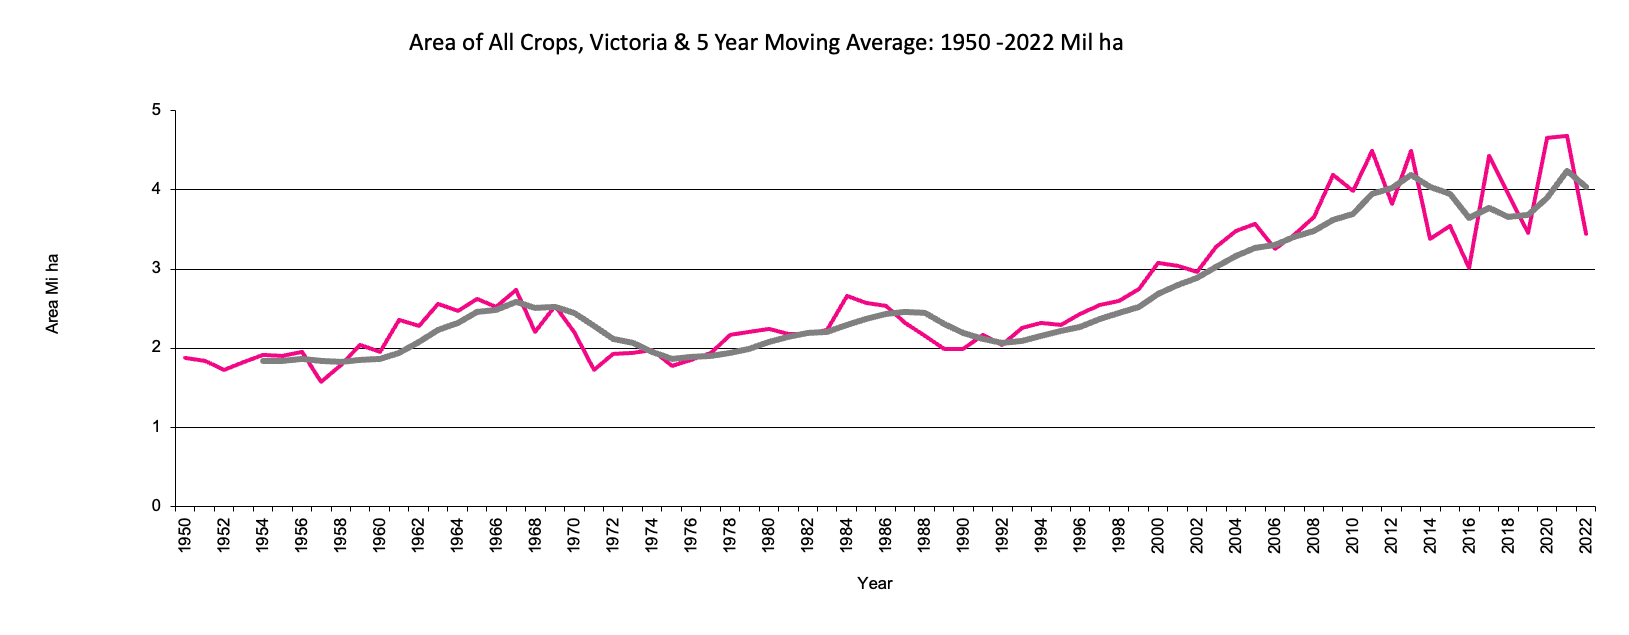
Area of all crops in million hectares, 5 year moving average. 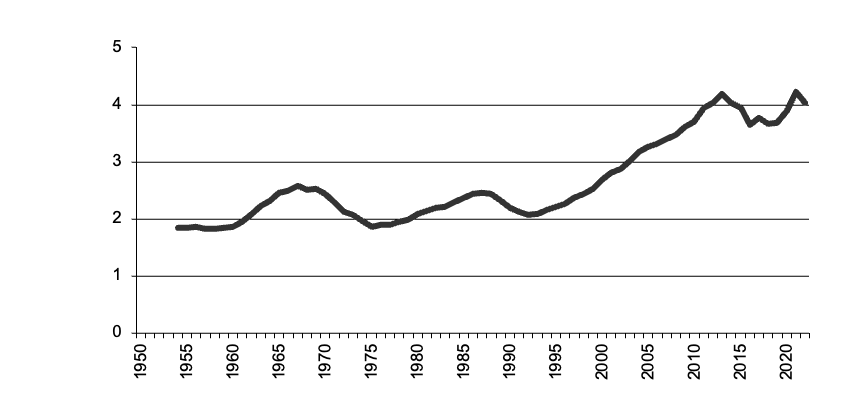
|
Victoria All Crops graph |
Return to top of page |
Area of crops has reached over 4mil hectares. Previously the area peaked around 1969, 1985 and 2013 suggesting around 15 year cycles. The area of all crops is dominated by the area sown to wheat.
Queensland All Crops
|
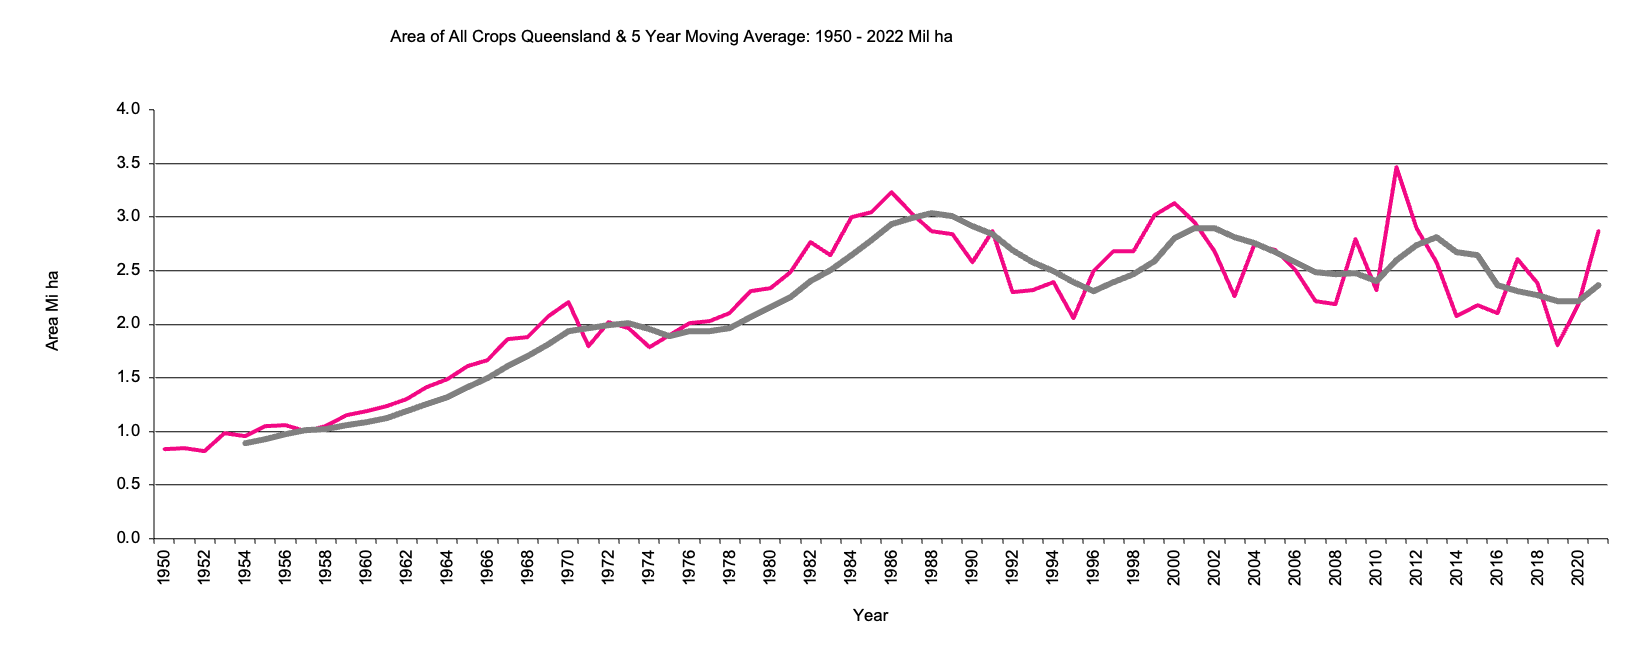
Area of all crops in million hectares, 5 year moving average. 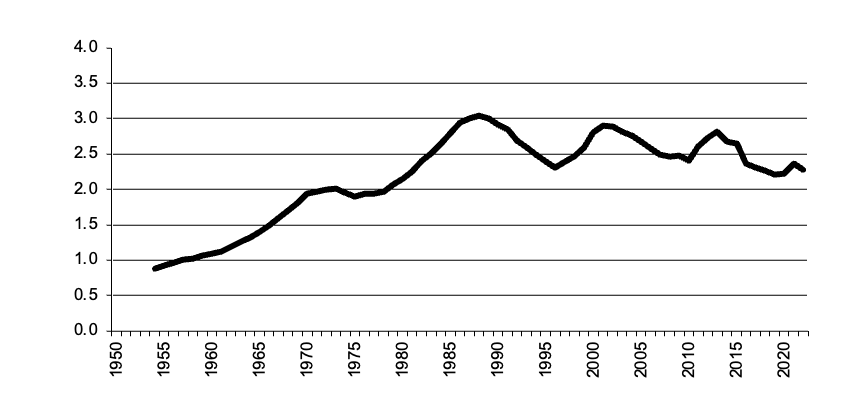
|
Queensland All Crops graph |
Return to top of page |
Area of crops has declined to around 2.5mil hectares from a peak in 2000. There were also peaks around 1970,1986,1999 and 2011 suggesting around 15 year cycles. About 1/3rd of the area is sown to wheat.
South Australia All Crops
|
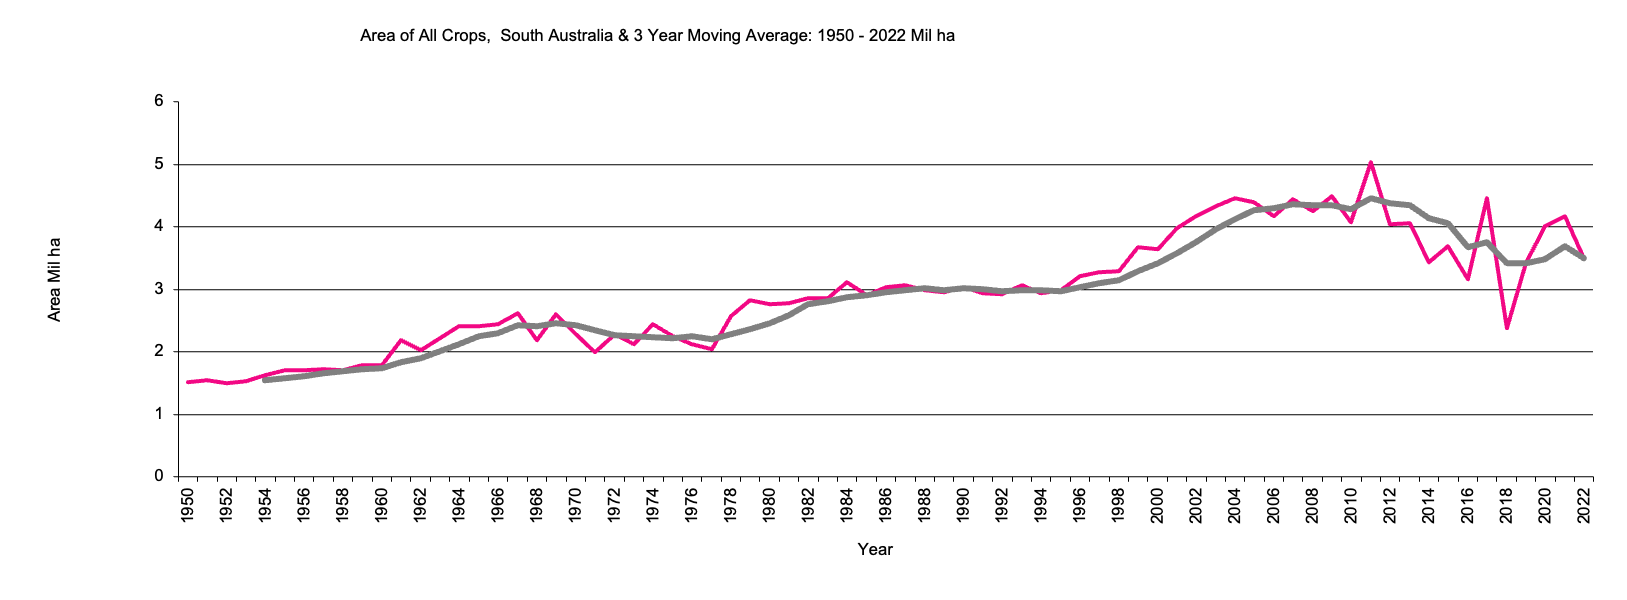
Area of all crops in million hectares, 5 year moving average. 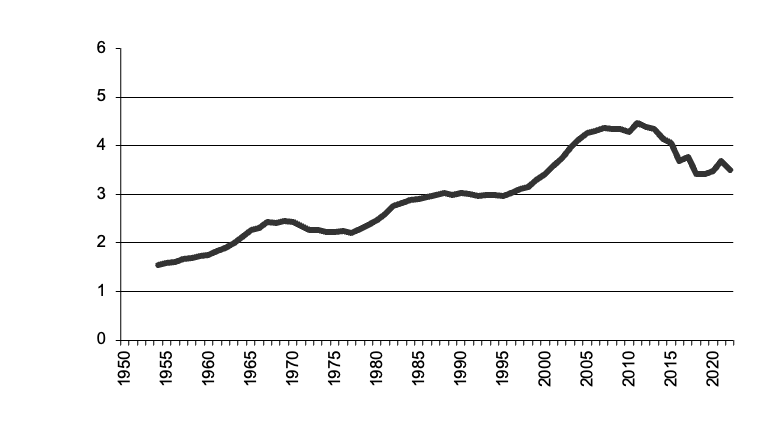
|
South Australia All Crops graph |
Return to top of page |
The area has increased steadily over 50 years. There were sharp rises during the last few years, around the early 1980s and during the 1960s. About 50% of the area is sown to wheat.
Western Australia All Crops
|
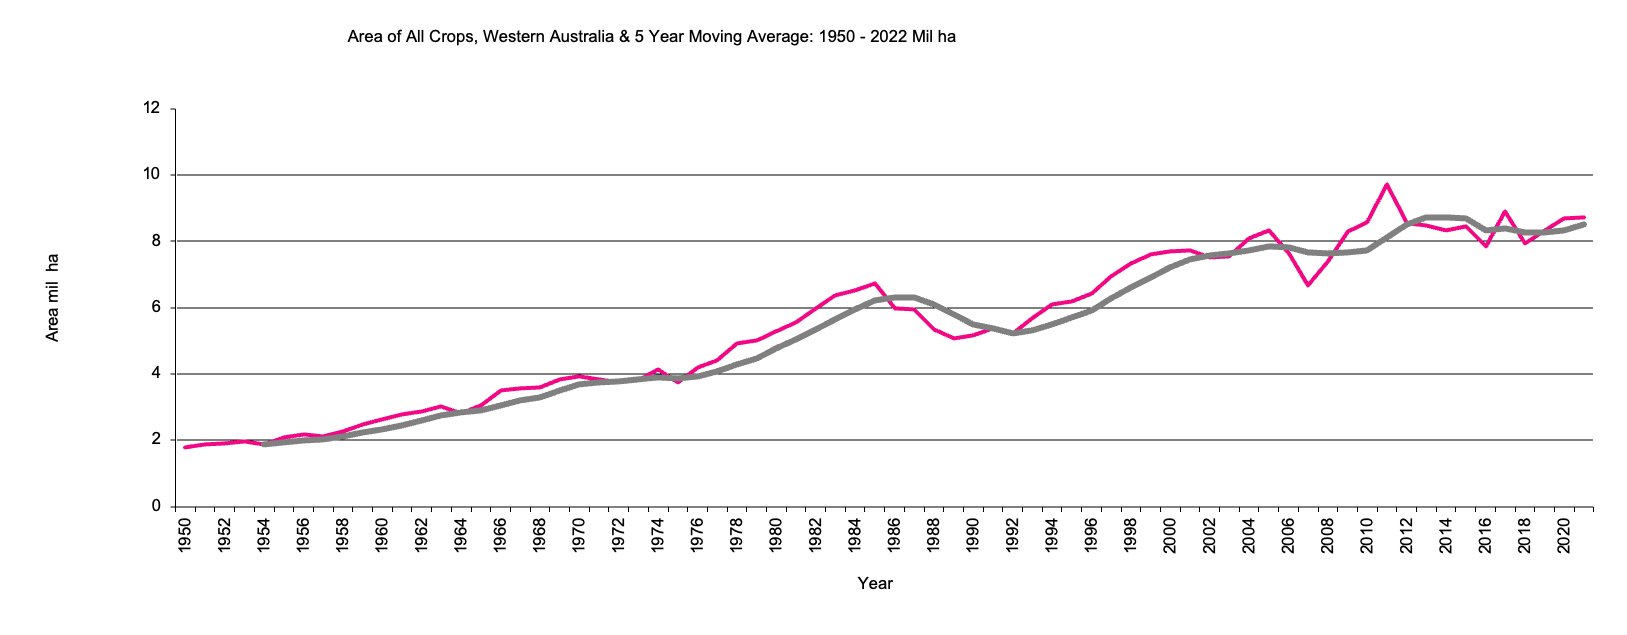
Area of all crops in million hectares, 5 year moving average. 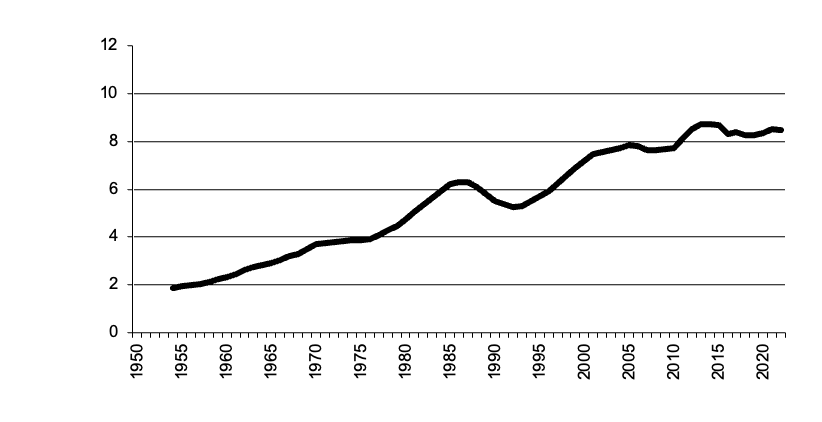
|
Western Australia All Crops graph |
Return to top of page |
Area of crops has reached 10mil hectares. There was a previous peak in 1985. The area of all crops is dominated by the area sown to wheat.
Tasmania All Crops
|
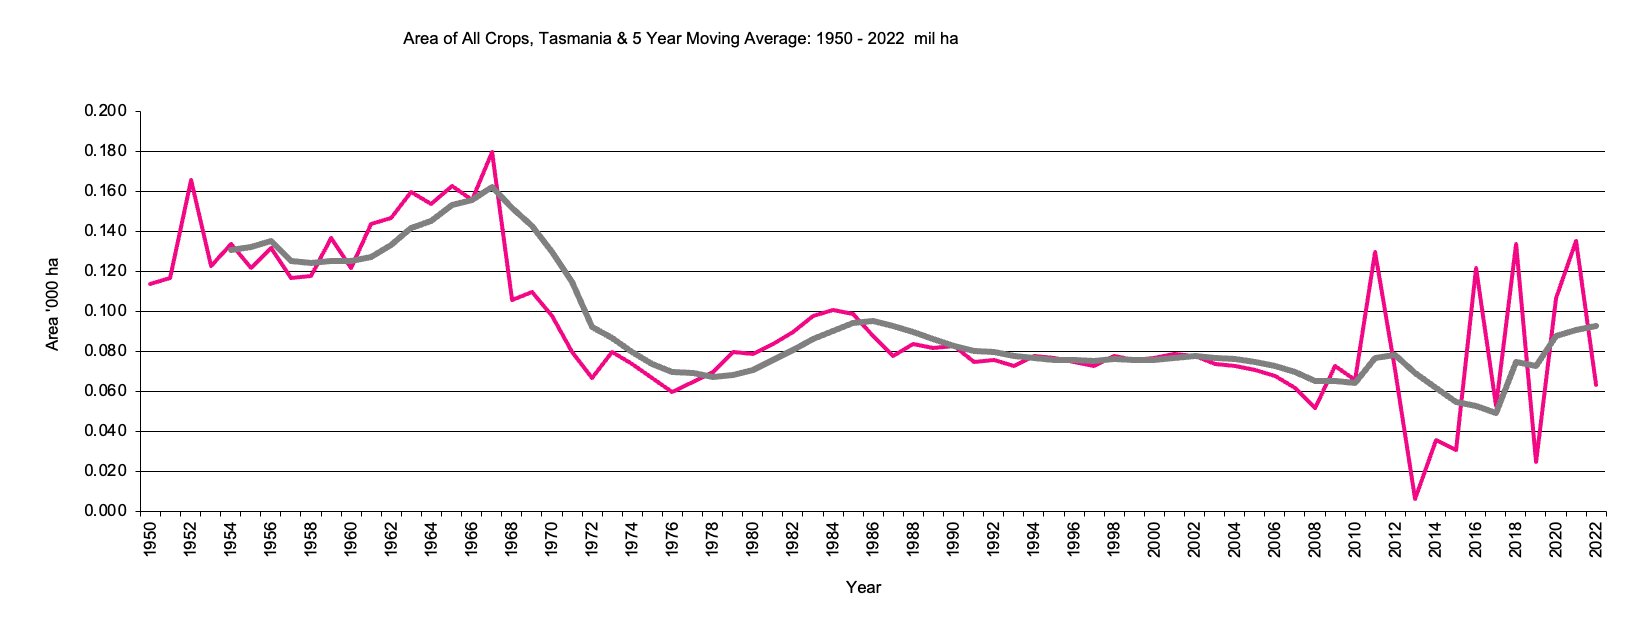
Area of all crops in million hectares, 5 year moving average. 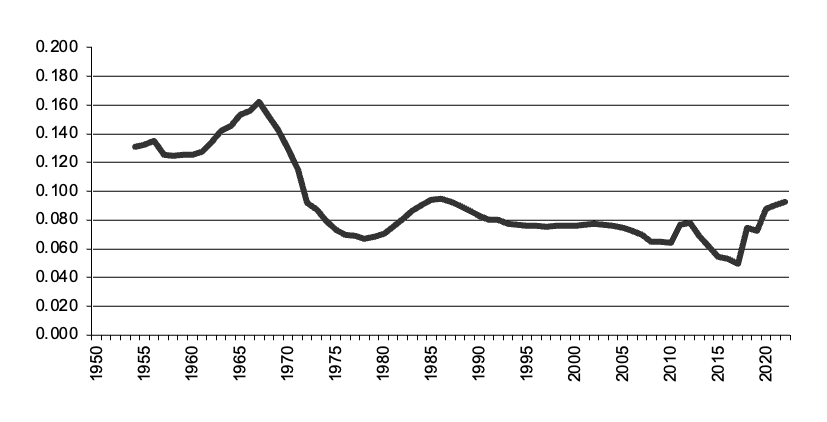
|
Tasmania All Crops graph |
Return to top of page |
Area of crops has been around 80,000 hectares since 1987. The area reached a peak in 1967 at 180,000 hectares.
Northern Territory All Crops
|
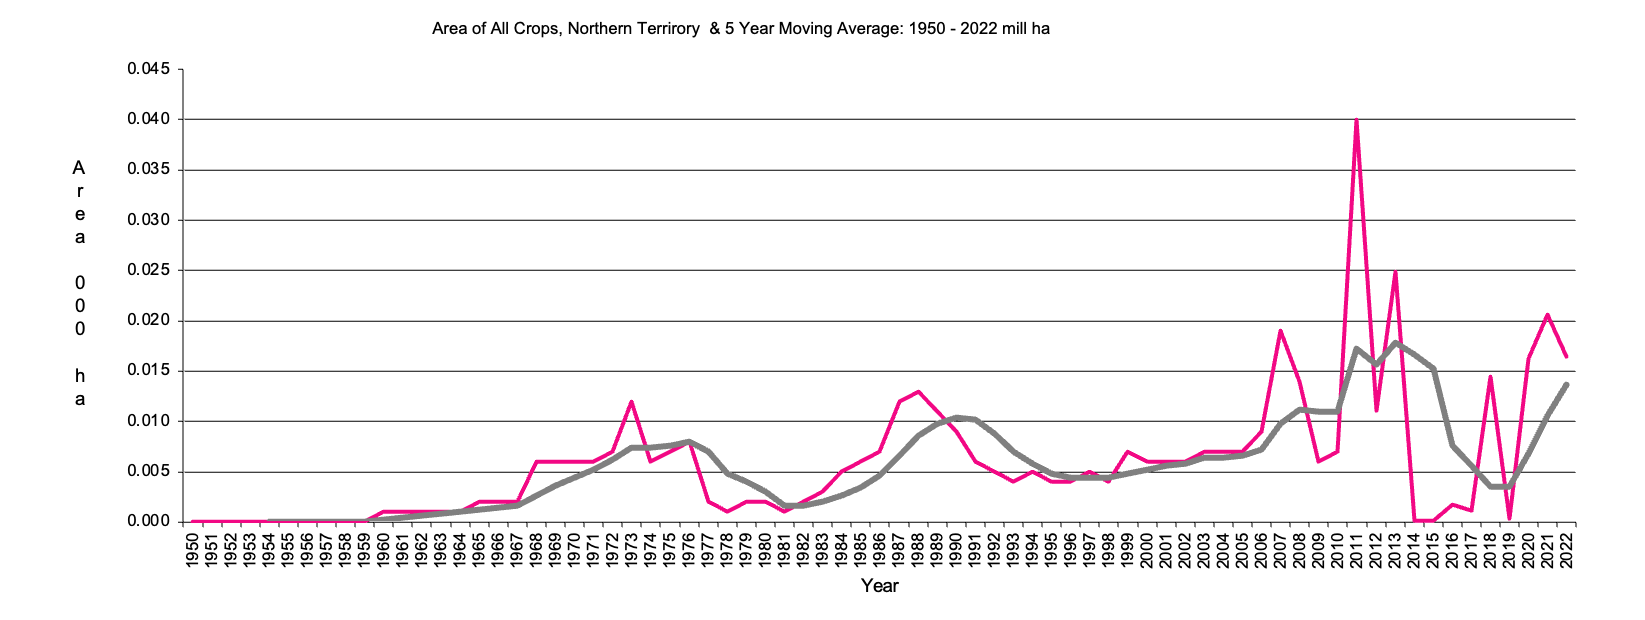
Area of all crops in million hectares, 5 year moving average. 
|
Northern Territory All Crops graph |
Return to top of page |