Area of All Crops Million hectares
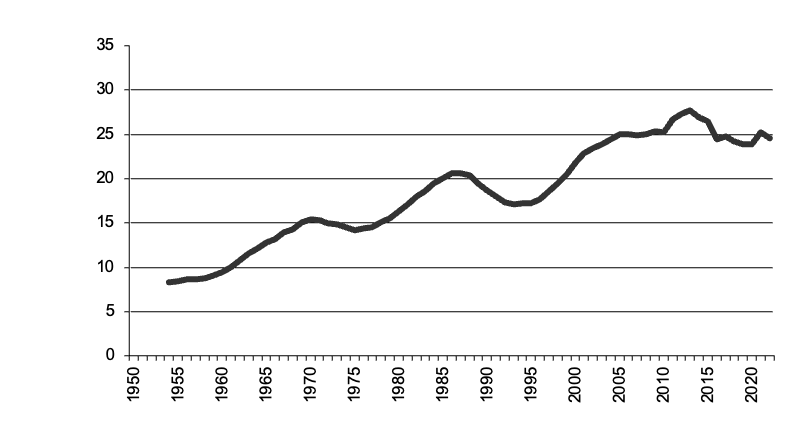
Area of All Crops graph
Area of All Crops data
Go to Area of All Crops by State
Return to top of page
Back to front page
This page has data for crops from 1950 to the present and the 5 year moving average. There is data for the area sown, production and value of production. .
The crops included here are:all crops, barley, oats, wheat, triticale, sorghum, maize, rice, sugar, grapes, oilseeds, cotton, potatoes and tobacco. Data for each state is also available. To see data by state, go to each crop page and follow the link to state data.
|
Area of All Crops Million hectares
|
Area of All Crops graph |
Return to top of page |
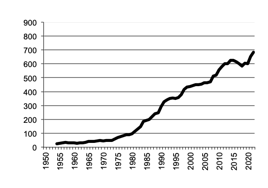
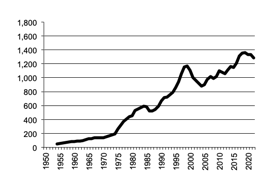
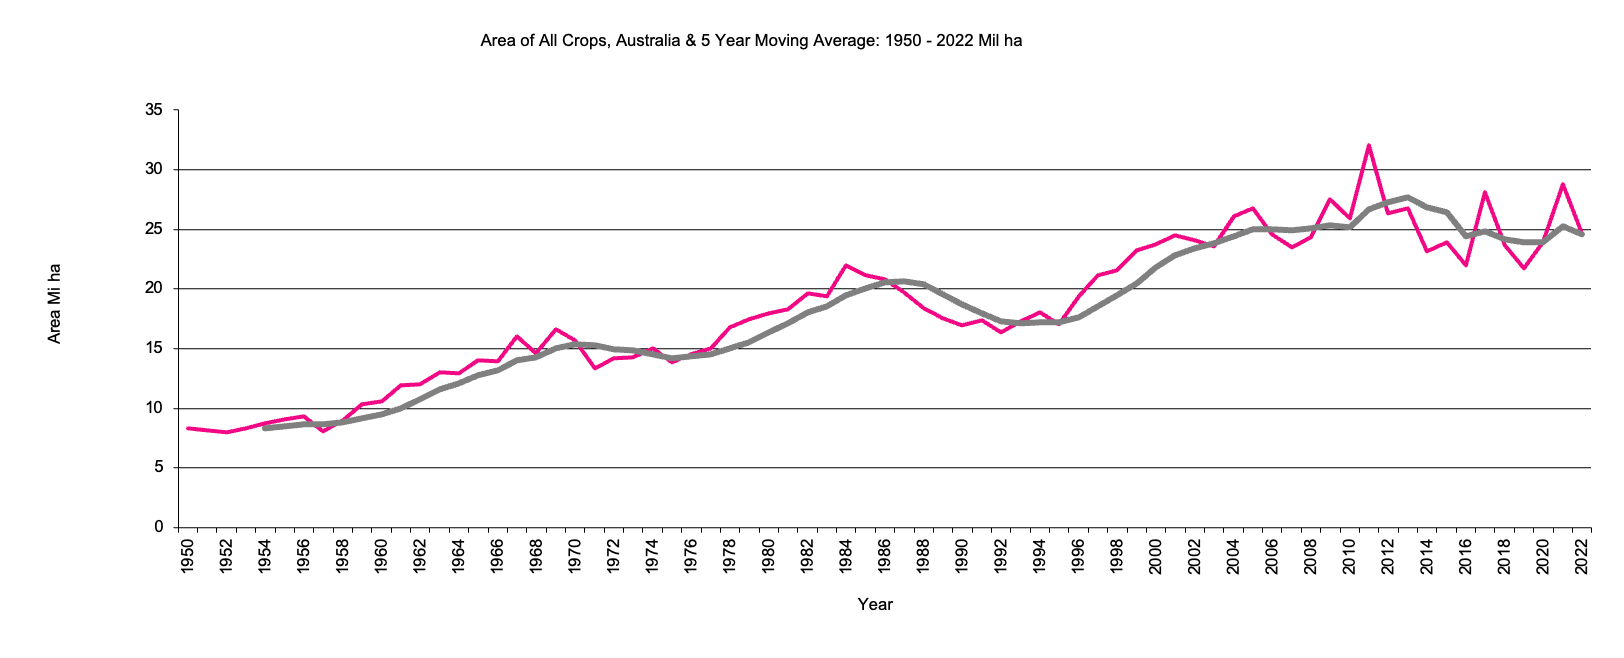
Area of crops has risen to over 25 million hectares. Previously the area peaked around 1969, 1985 2003 and 2013 suggesting around 15 year cycles. The area of all crops is dominated by the area sown to wheat.
All Crops - Value of Production
|
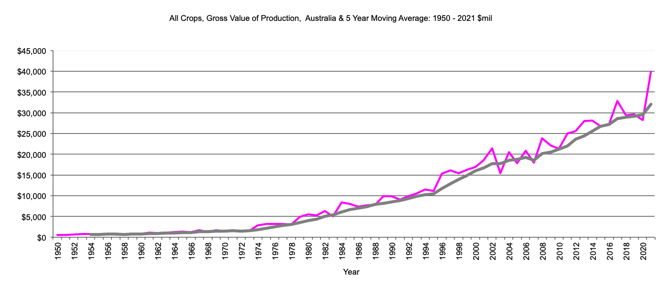
All Crops - Gross Value of production $m,5 year moving average 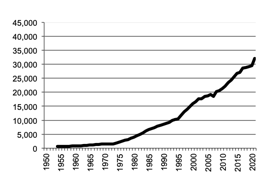
|
Gross Value of Production, All Crops graph |
Return to top of page |
|
All Crops - Gross Value of production, $m 
|
Gross Value of Production, All Crops graph |
Return to top of page |
|
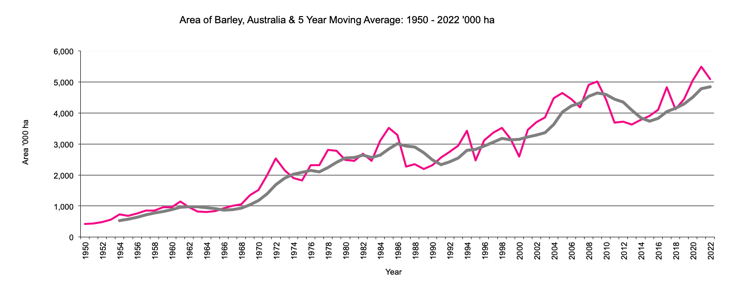
Area of Barley '000 hectares, 5 year moving average. 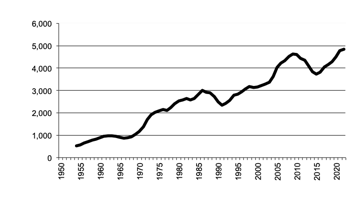
|
Area of Barley graph |
Return to top of page |
Most barley is grown in South Australia and Western Australia.
|
Production of barley '000 tonnes, 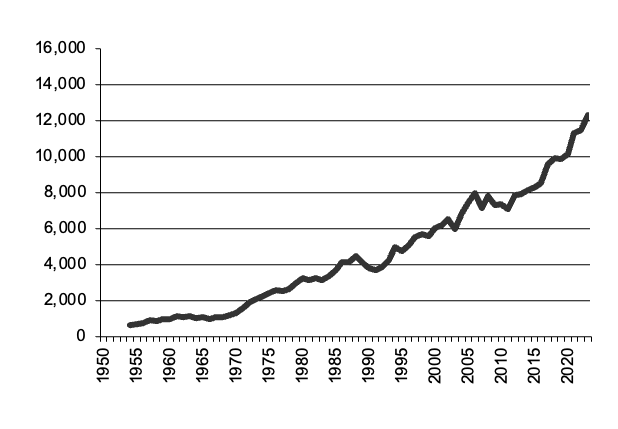
|
Barley Production graph |
Return to top of page |
Barley - Gross Value Production
|
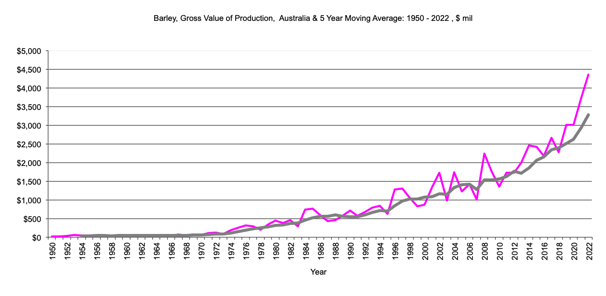
Barley - Gross Value of production $m,5 year moving average 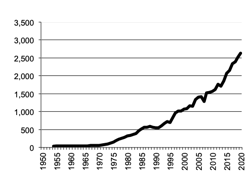
|
Gross Value of Production, Barley graph |
Return to top of page |
|
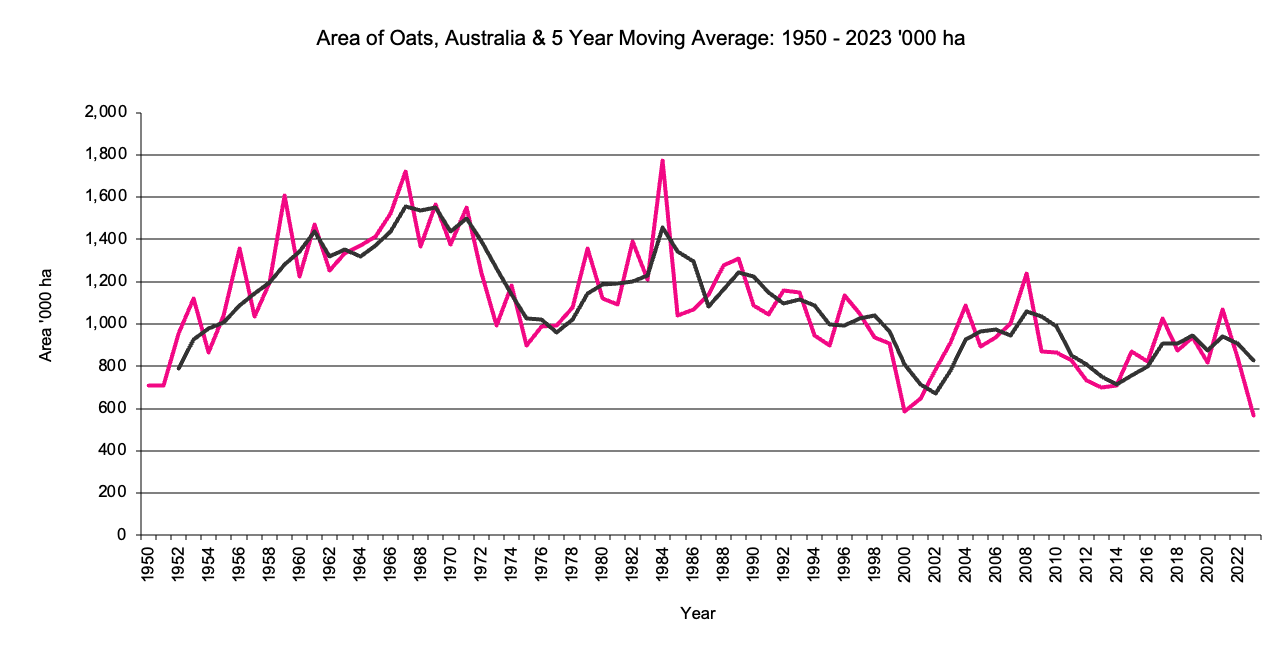
Area of Oats '000 hectares, 5 year moving average. 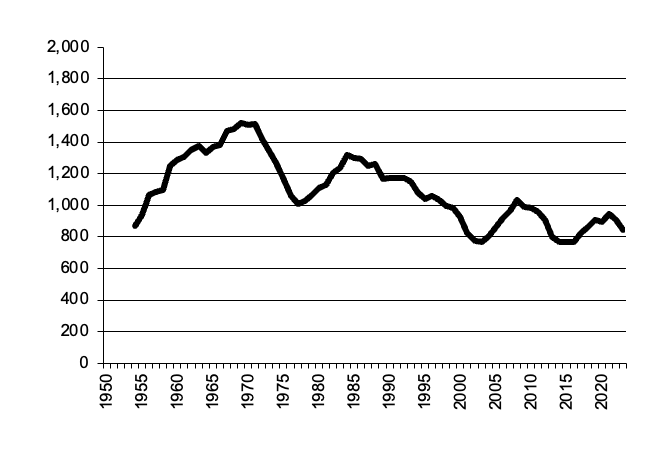
|
Area of Oats graph |
Return to top of page |
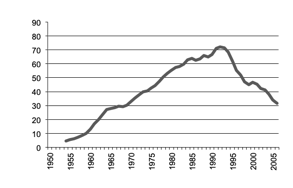
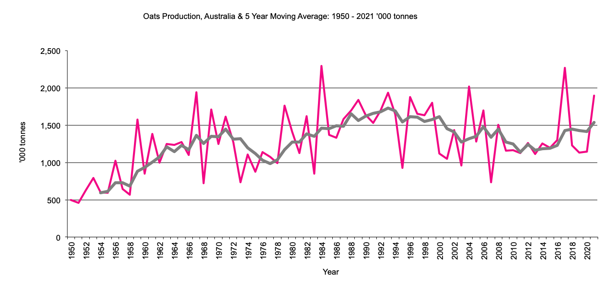
Area of oats is about the same as 50 years ago - around 700,000 hectares although it reached around 1,700,000 hectares in 1984 and 1967.
|
Production of oats '000 tonnes, 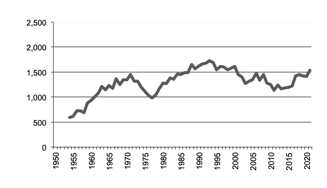
|
Oats Production graph |
Return to top of page |
|
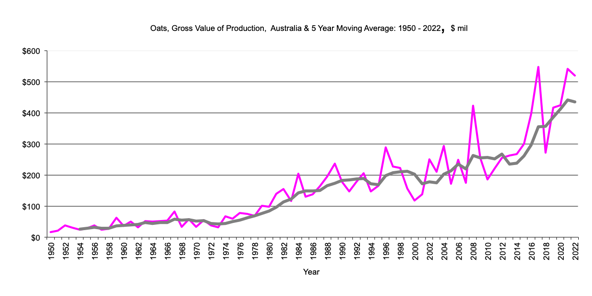
"Oats - Gross Value of production, $m, 5 year moving average" |
Gross Value of Production, Oats graph |
Return to top of page |
|
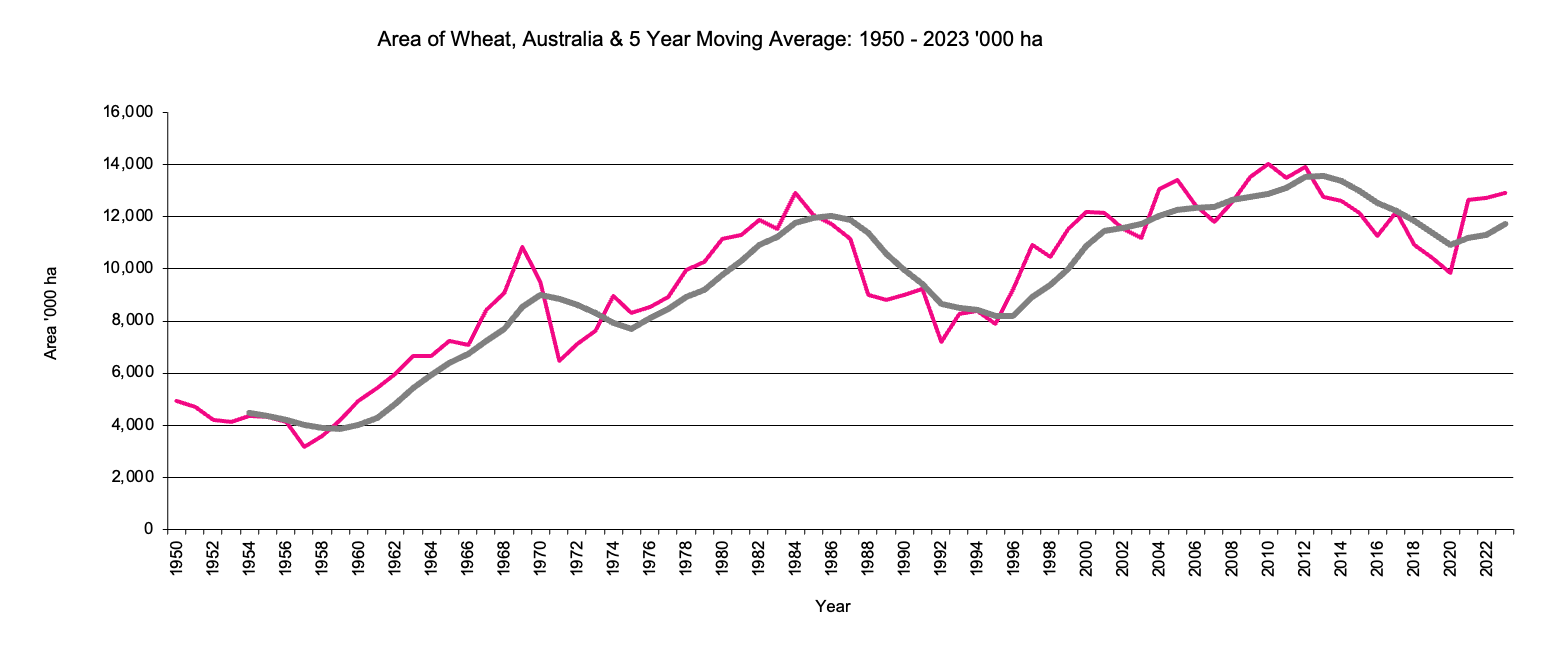
Area of Wheat '000 hectares, 5 year moving average 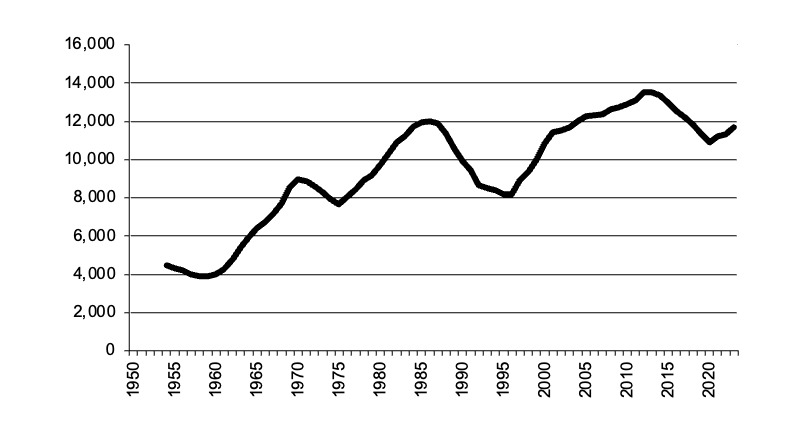
|
Area of Wheat graph |
Return to top of page |
The area of wheat has reached 14mil hectares, in 2010, With earlier peaks in 1969, 1984 and 2005.
|
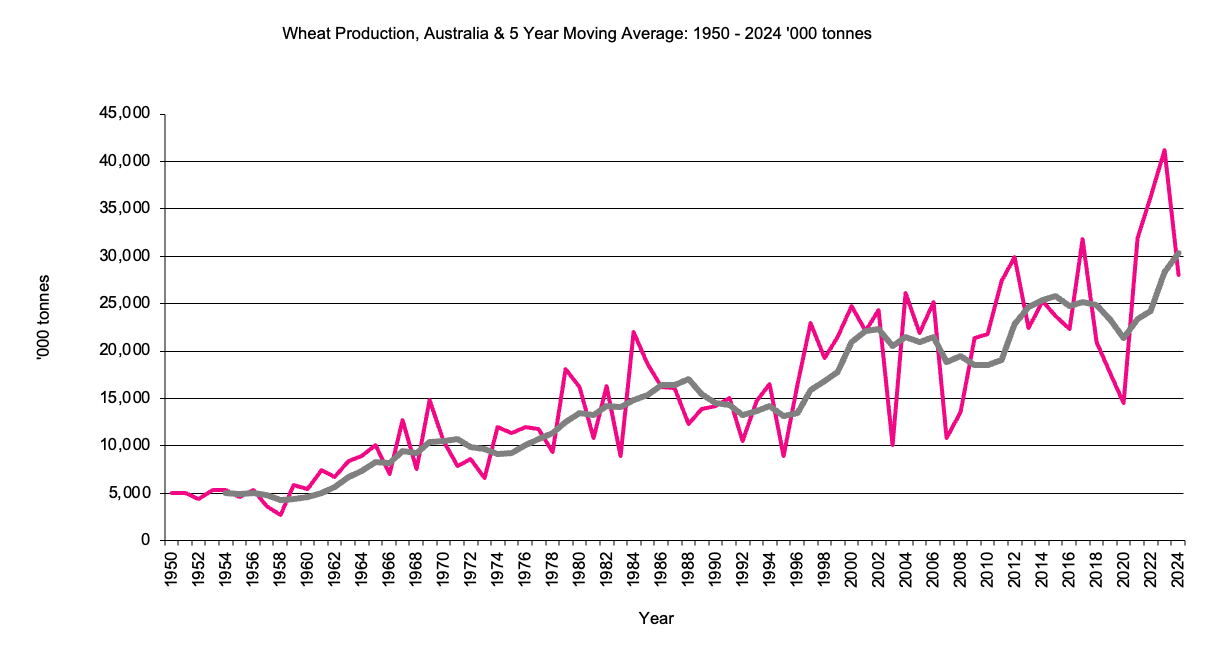
Production of wheat '000 tonnes, 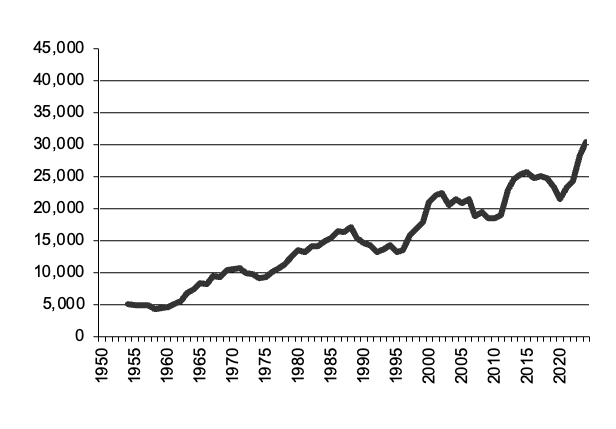
|
Wheat Production graph |
Return to top of page |
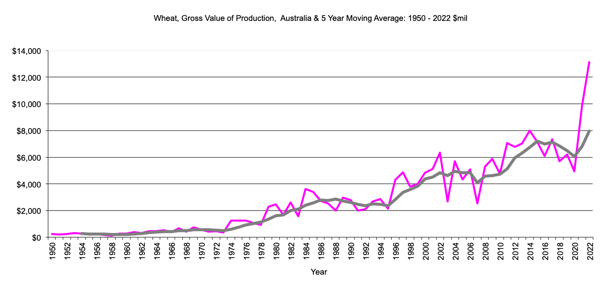
Wheat - Gross Value Production
|
"Wheat - Gross Value of production, $m, 5 year moving average" |
Gross Value of Production, wheat graph |
Return to top of page |
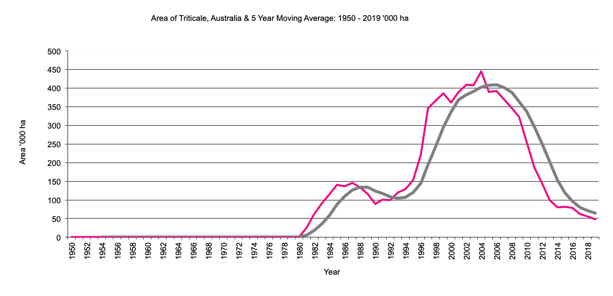
Triticale - Area
Data not recorded prior to 1981.
|
Area of Triticale '000 hectares, 5 year moving average. |
Area of Triticale graph |
Return to top of page |
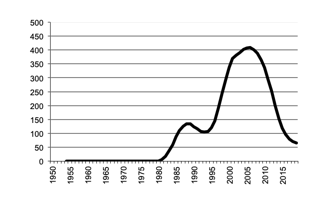
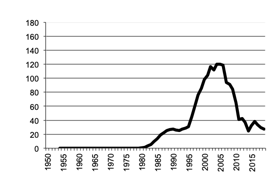
Area has peaked at around 400 thousand hectares around 2000.
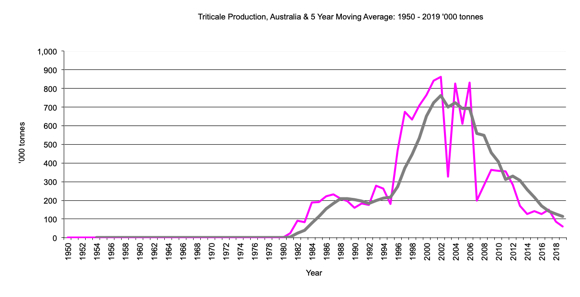
Triticale - Production
Data not recorded prior to 1981.
|
Production of tritical '000 tonnes, 5 year moving average 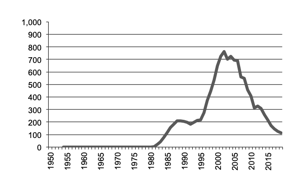
Data not recorded after 2018 |
Triticale Production graph |
Return to top of page |
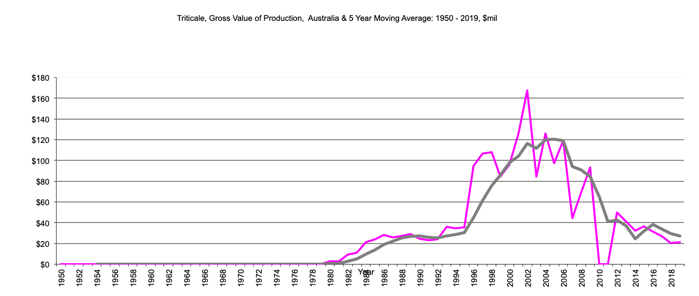
Triticale - Gross Value Production
|
"Triticale - Gross Value of production, $m, 5 year moving average"
|
Gross Value of Production, Triticale graph |
Return to top of page |
|
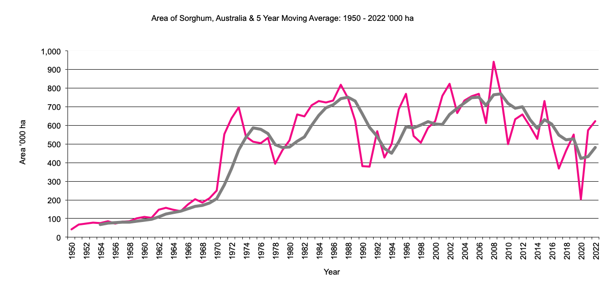
Area of Sorghum '000 hectares, 5 year moving average. 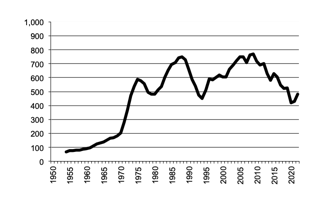
|
Go to Area of Sorghum graph |
Return to top of page |
The area of sorghum has expanded from around 50 thousand hectares to 800 thousand hectares. A previous peak was reached 1973. Over 2/3rds of sorghum is grown in Queensland.
|
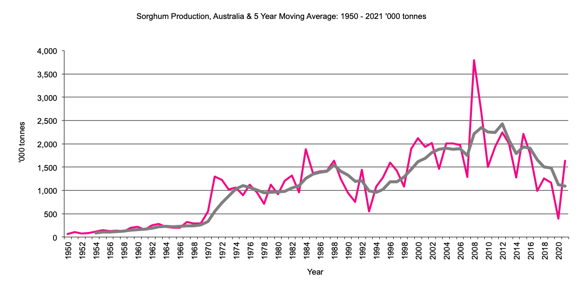
Production of sorghum '000 tonnes, 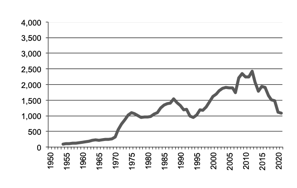
|
Sorghum Production graph |
Return to top of page |
Production has increased from less than 100 thousand tonnes in the 1950's to around 2 million tonnes.
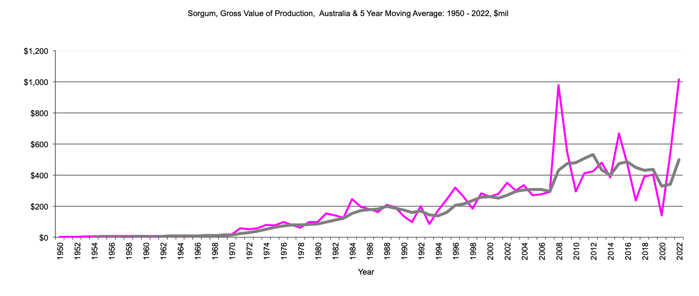
Sorghum - Gross Value Production
|
"Sorghum- Gross Value of production, $m, 5 year moving average" |
Gross Value of Production, Sorghum graph |
Return to top of page |
|
Area of Maize '000 hectares, 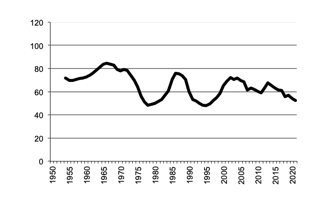
|
Area of Maize graph |
Return to top of page |
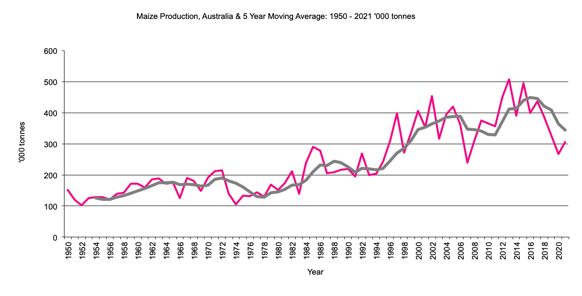
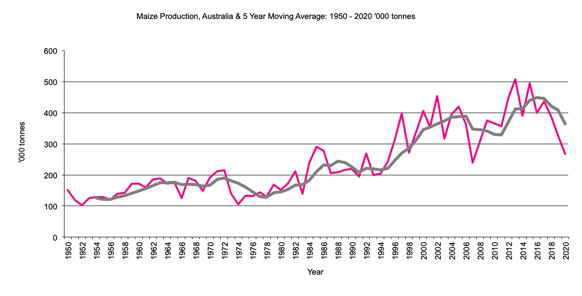
The area of maize has averaged around 65 thousand hectares.
|
Production of maize '000 tonnes, 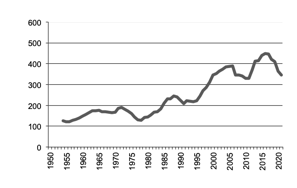
|
Maize Production graph |
Return to top of page |
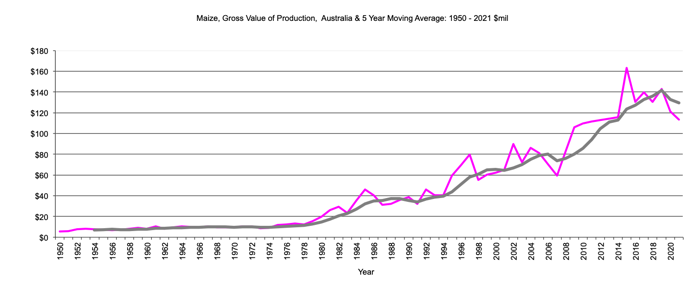
Maize - Gross Value of Production
|
Maize- Gross Value of production $m,5 year moving average 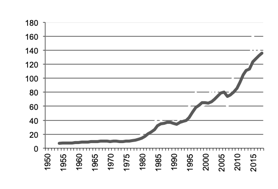
|
Gross Value of Production, Maize graph |
Return to top of page |
|
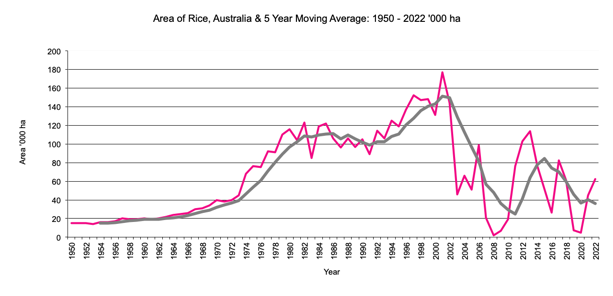
Area of Rice '000 hectares,5 year moving average 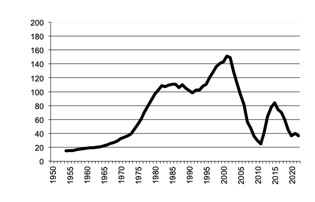
|
Area of Rice graph |
Return to top of page |
Nearly all of Australia's rice is grown in NSW. The area has varied from 20,000 to 150,000 hectares.
|
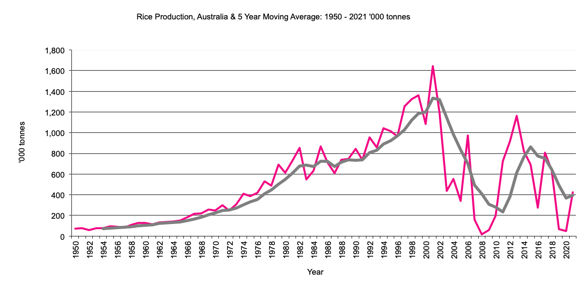
Production of rice '000 tonnes, 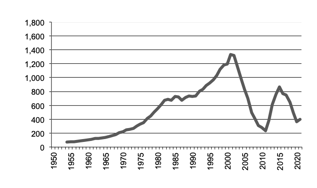
|
Rice Production graph |
Return to top of page |
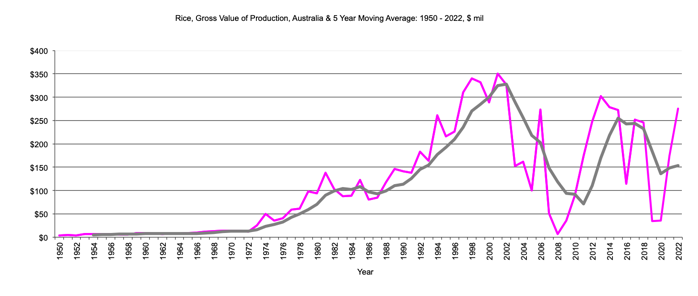
|
Rice- Gross Value of production $m,5 year moving average |
Gross Value of Production, Rice graph |
Return to top of page |
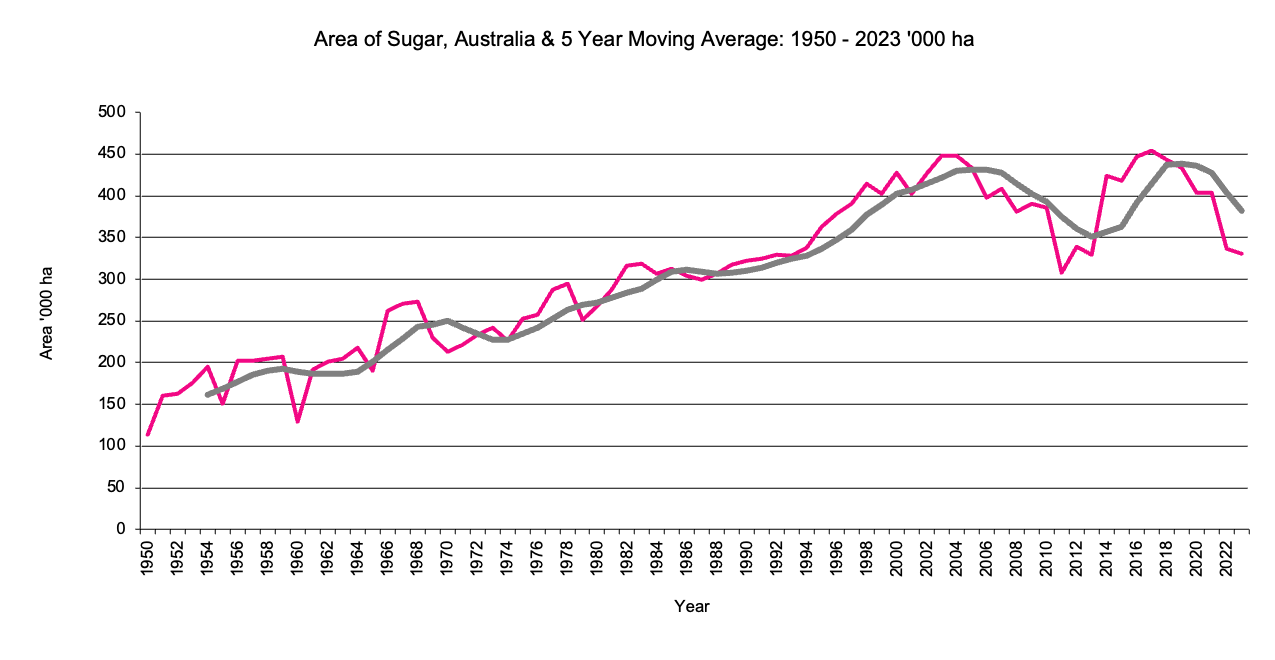
Area of Sugar '000 hectares, 5 year moving average.
|
Area of Sugar graph |
Return to top of page |
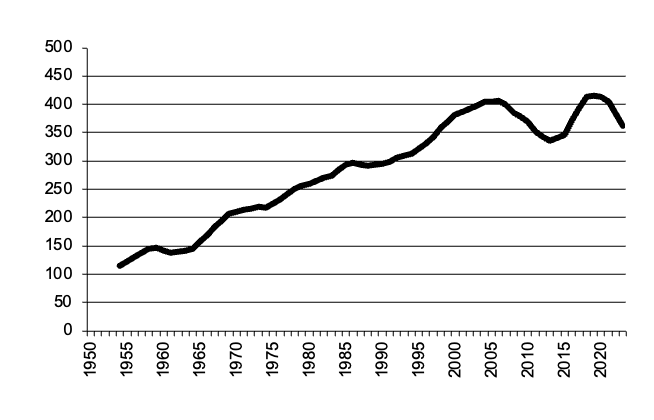
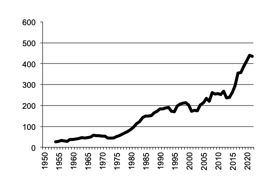
The area of sugar has reached over 400,000 hectares from around 100,000 in 1950. Most sugar is grown in Queensland.
|
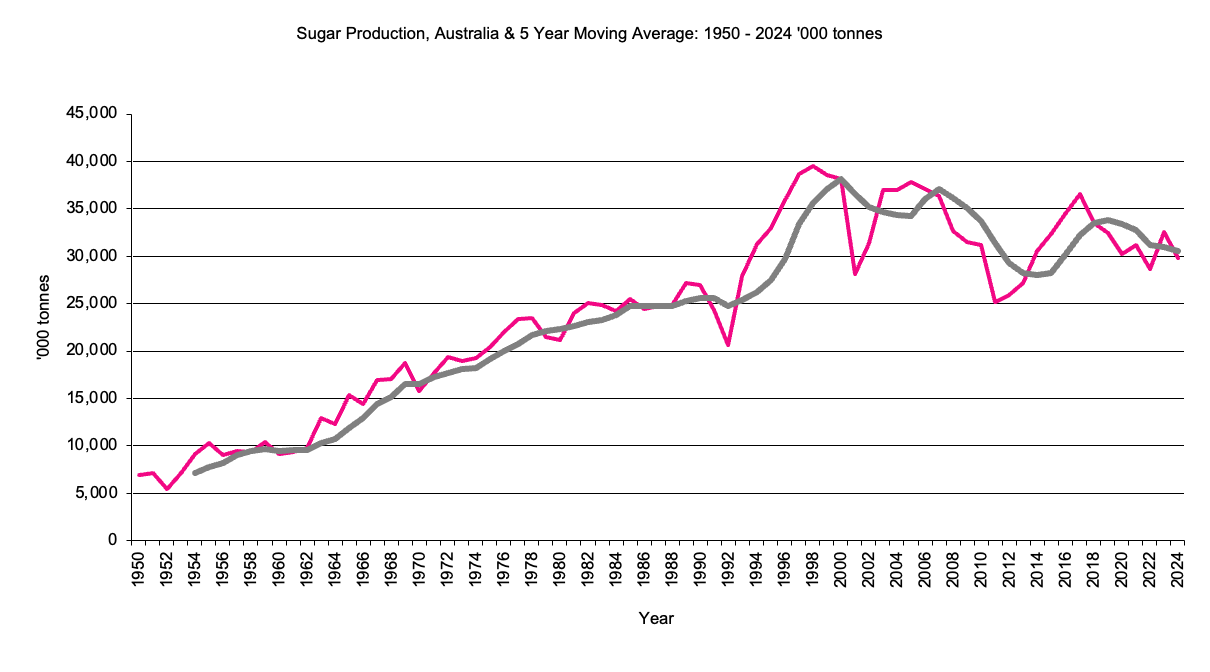
Production of sugar '000 tonnes, 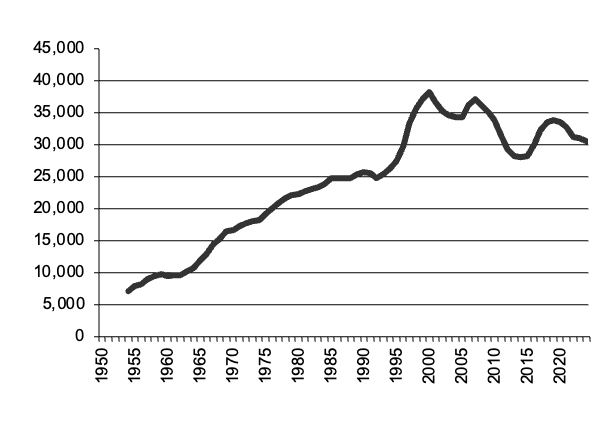
|
Sugar Production graph |
Return to top of page |
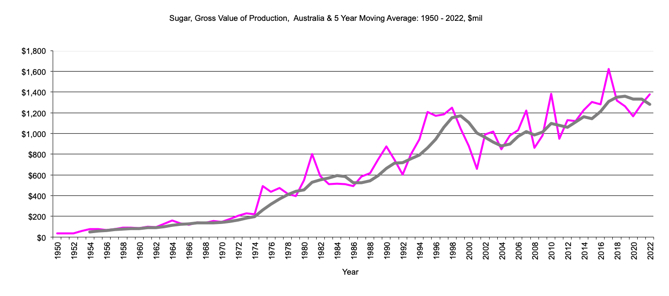
Sugar - Gross Value Production
|
"Sugar - Gross Value of production, $m, 5 year moving average" |
Gross Value of Production, Sugar graph |
Return to top of page |
|
Area of Grapes '000 hectares, 5 year moving average. 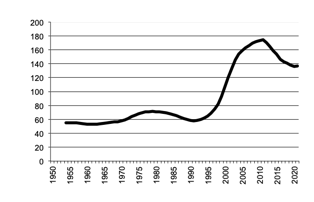
|
Area of Grapes graph |
Return to top of page |
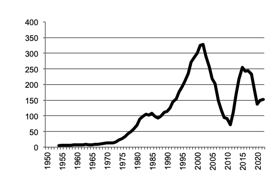
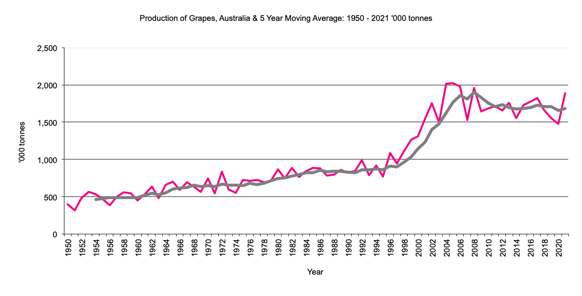
The area of grapes more than doubled from around 1990 to over 170,000 hectares.
|
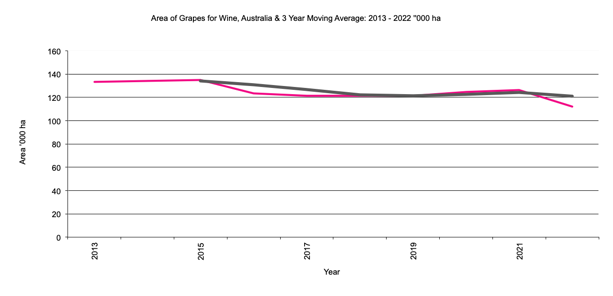
Area of Grapes '000 hectares, 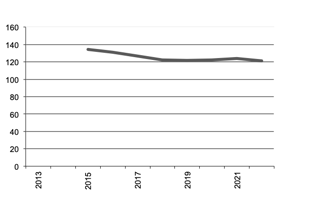
|
Area of Grapes for Wine graph |
Return to top of page |
|
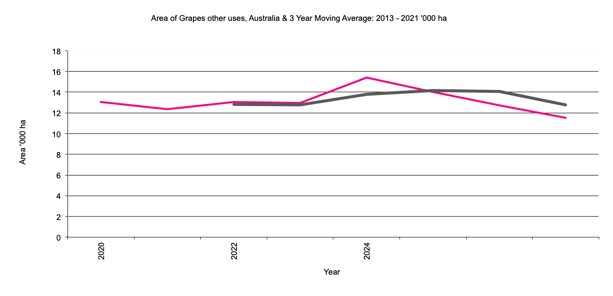
Area of Grapes for Other Uses'000 hectares, 
|
Area of Grapes for Other Uses graph |
Return to top of page |
|
Grapes production '000 tonnes, 5 year moving average. 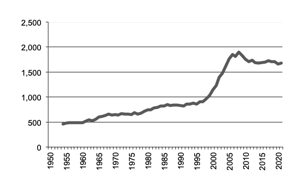
|
Grapes Production graph |
Return to top of page |
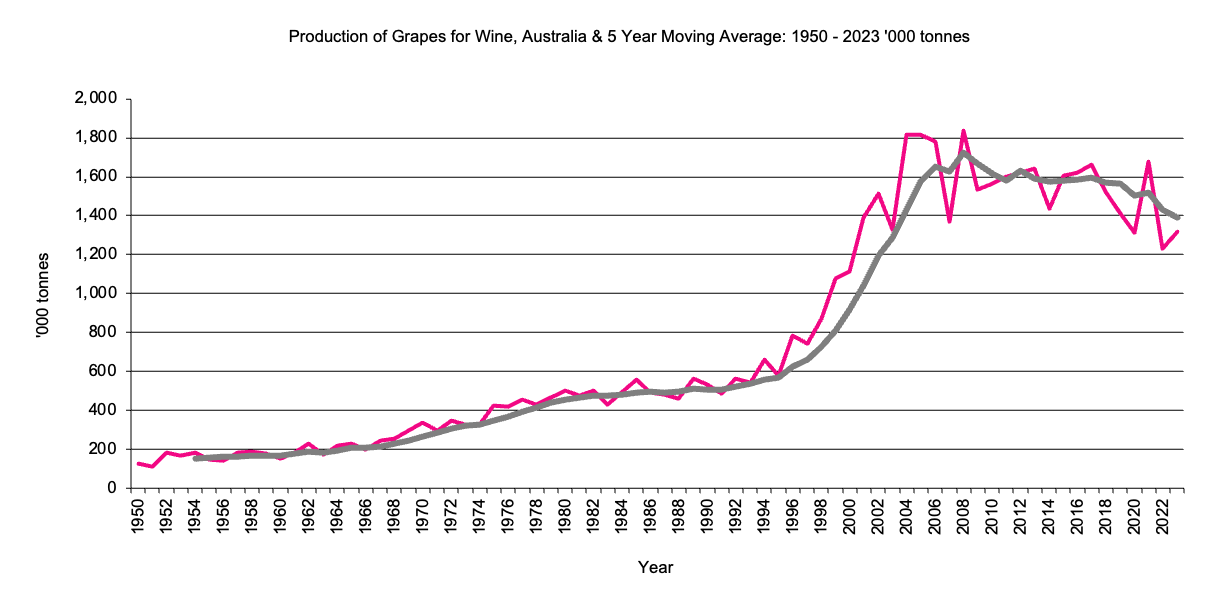
Grapes - Production, Wine Grapes
|
Production of wine grapes '000 tonnes,5 year moving average 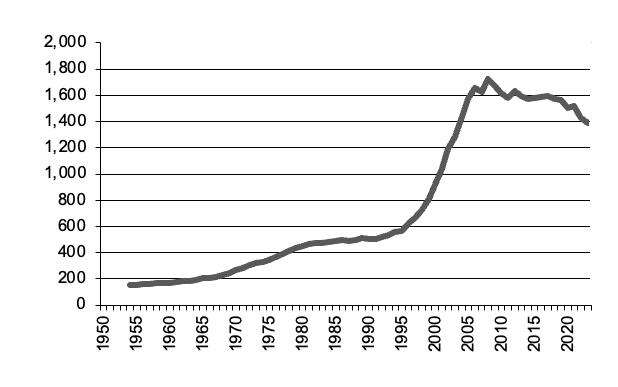
|
Wine Grapes Production graph |
Return to top of page |
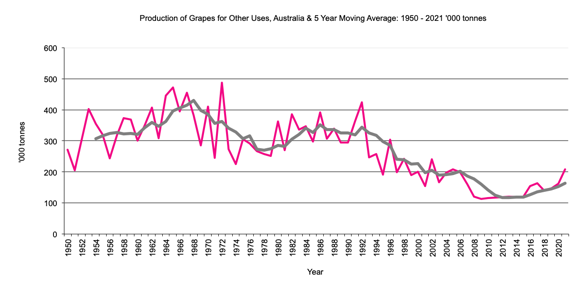
Grapes for Other Uses Production
|
Production of grapes other '000 tonnes,5 year moving average 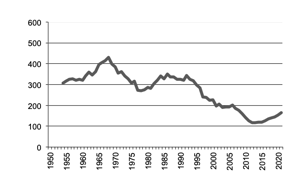
|
Grapes Other Production graph |
Return to top of page |
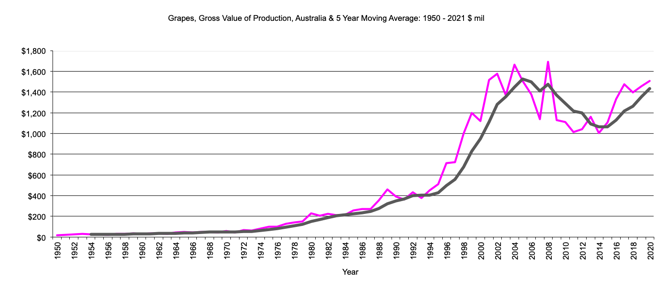
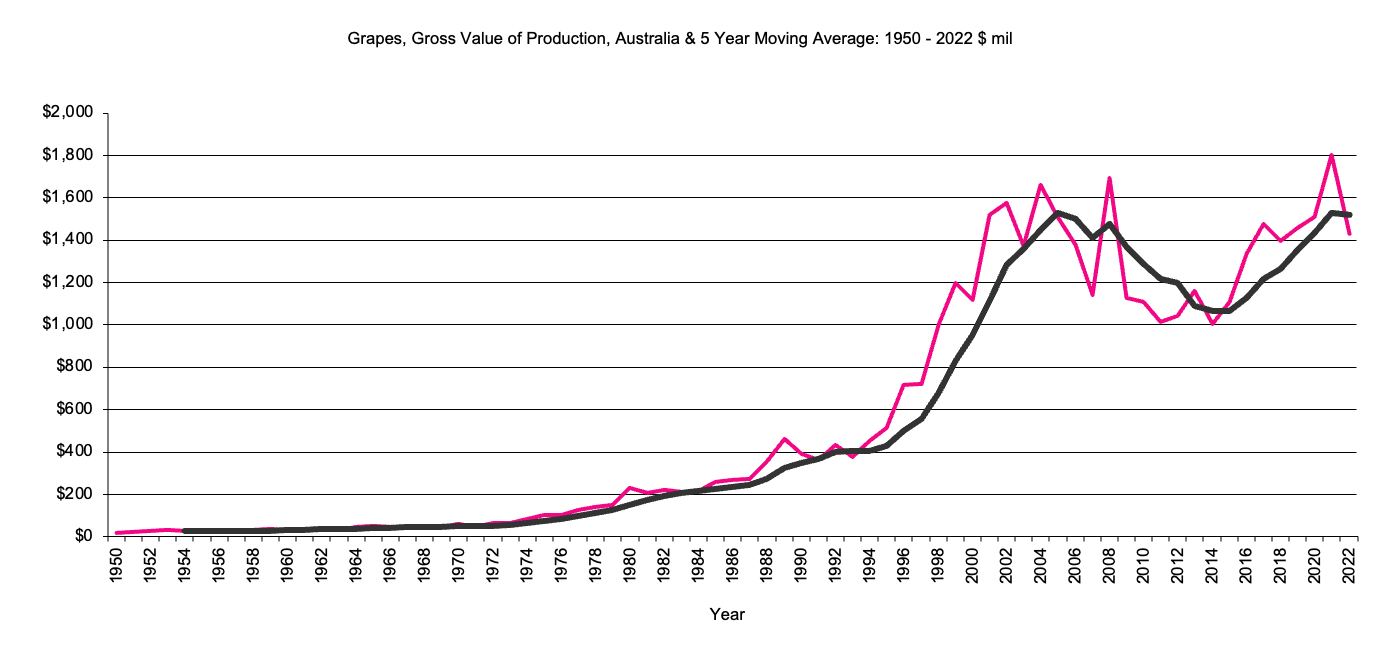
Grapes - Gross Value Production
|
"Grapes - Gross Value of production, $m, 5 year moving average" |
Gross Value of Production, Grapes graph |
Return to top of page |
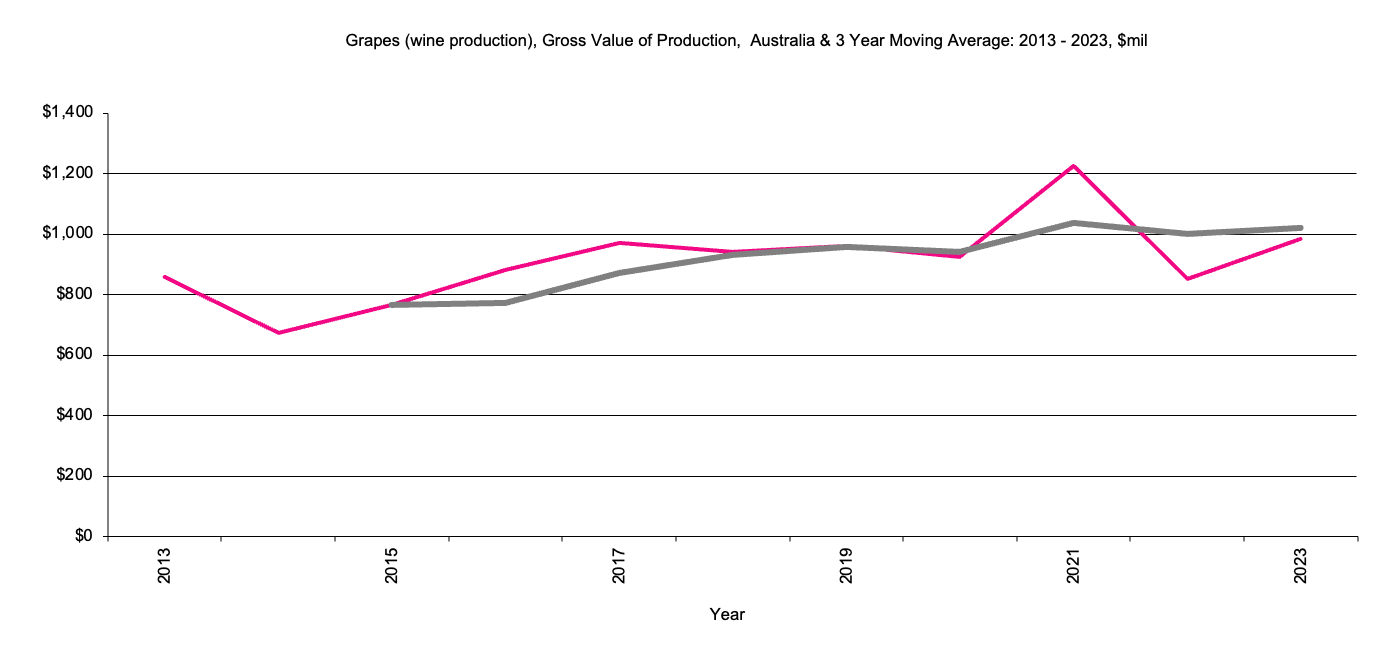
Grapes - Gross Value of Production, Wine Grapes
|
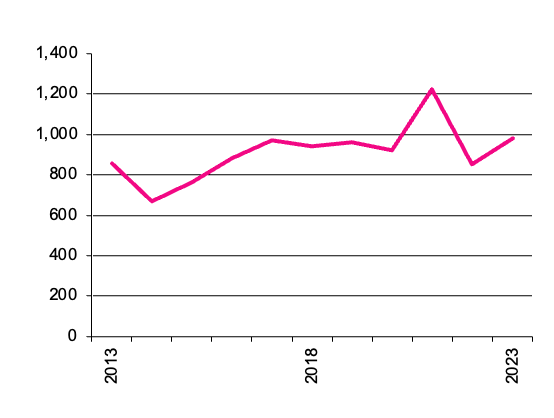
"Wine Grapes - Gross Value of production since 2013, $m" |
Gross Value of Production, Wine Grapes graph |
Return to top of page |
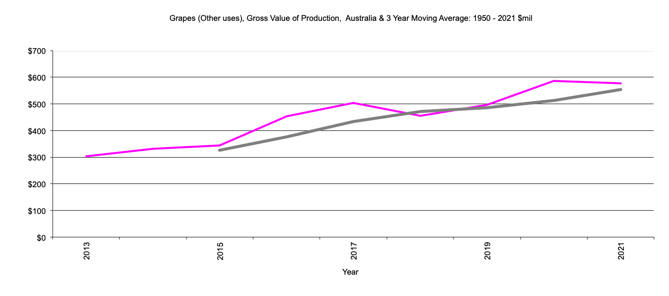
Grapes - Grapes for Other Uses - Gross Value Production
|
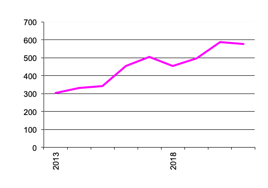
"Grapes for Other Uses - Gross Value of production since 2013, $m," |
Gross Value of Production, Grapes for Other Uses graph |
Return to top of page |
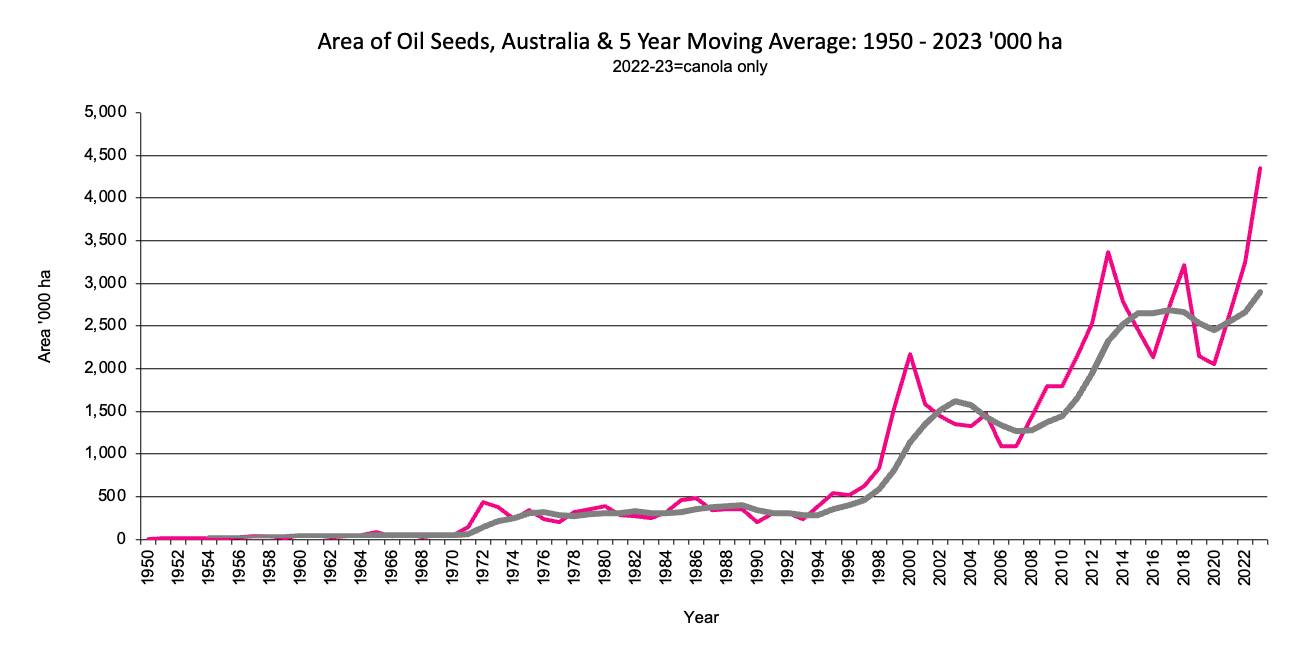
 Oil seeds includes: sunflower, safflower, soybeans, linseed, rapeseed canola.

 From around 1986, the recording of oilseeds for states and total Australia appears

 consistent and reliable.  Prior to this it appears from the data sources that

 the recording of oil seeds may not always be consistent with post 1986 data.
Area of Oilseeds '000 hectares, 5 year moving average.
|
Area of Oilseeds graph |
Return to top of page |
From 1995 the area of oil seeds has had a dramatic increase from 0.5 million hectares . This increase occurred in the southern states ie, NSW, Victoria, South Australia and Western Australia.
|
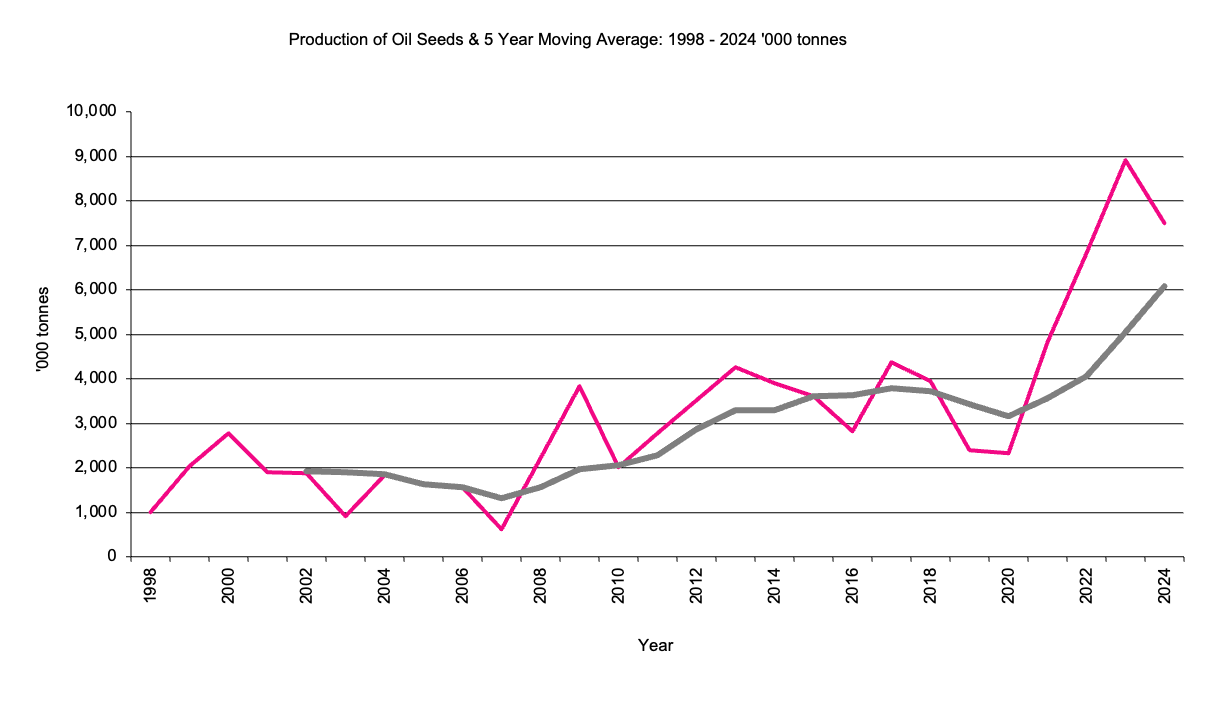
Production of Oil Seeds 000 tonnes,5 year moving average 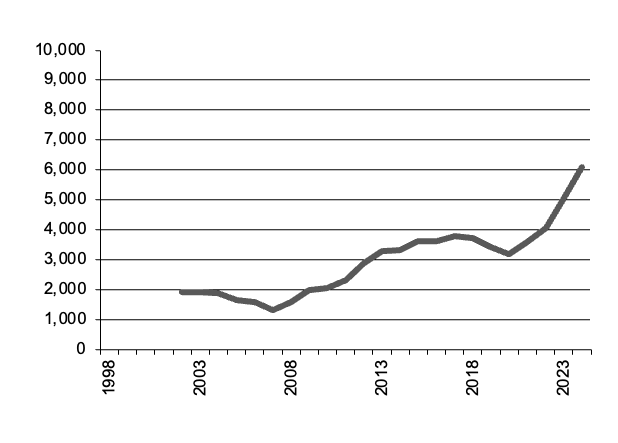
|
Oil Seeds Production graph |
Return to top of page |
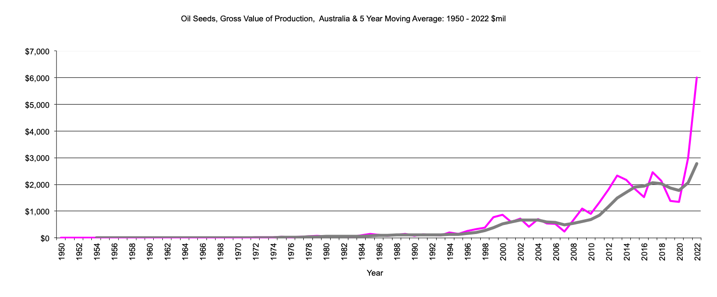
Oil Seeds - Gross Value Production
|
Oil Seeds- Gross Value of production $m,5 year moving average 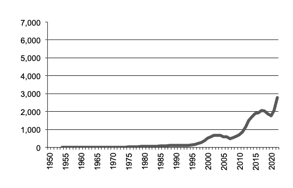
|
Gross Value of Production, Oil Seeds graph |
Return to top of page |
|
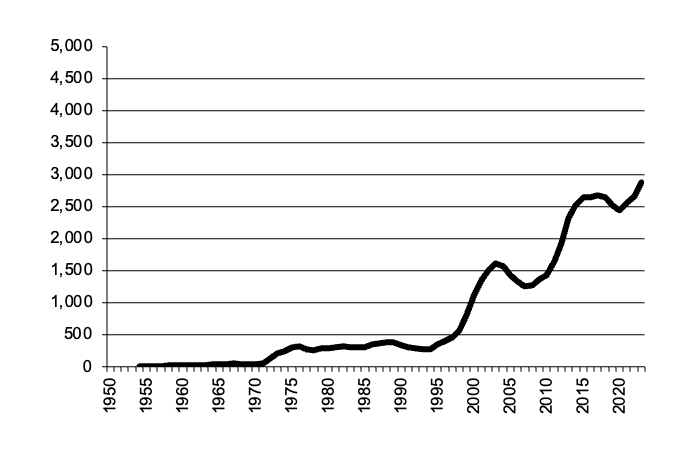
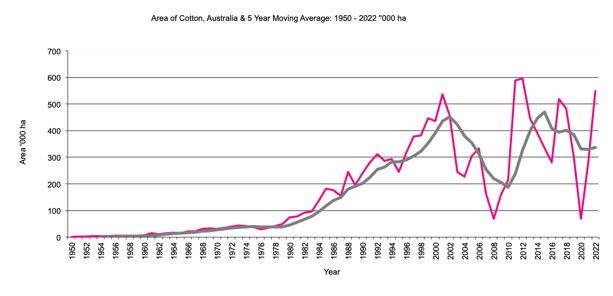
Area of Cotton '000 hectares, 5 year moving average. 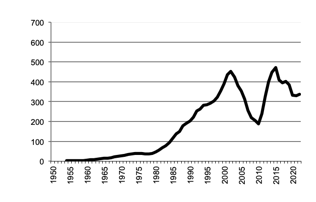
|
Area of Cotton graph |
Return to top of page |
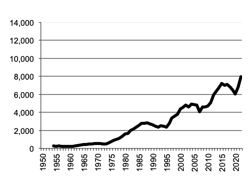
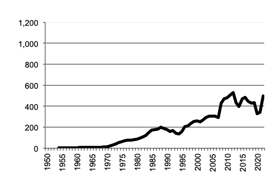
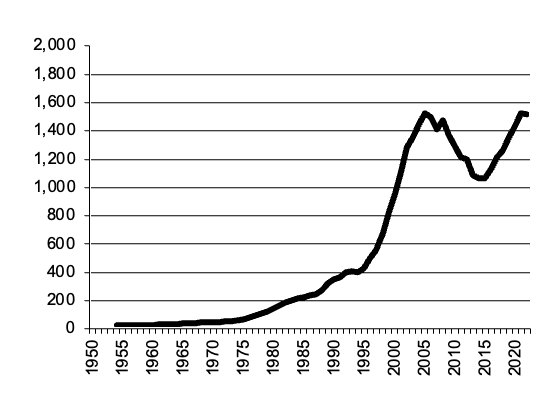
The area has had exponential growth increasing from 50,000 to over 450,000 hectares overt 23 years. After declining to 100,000 hectares in the drouth years the area has climbed back to almost 600,000 hectares.
|
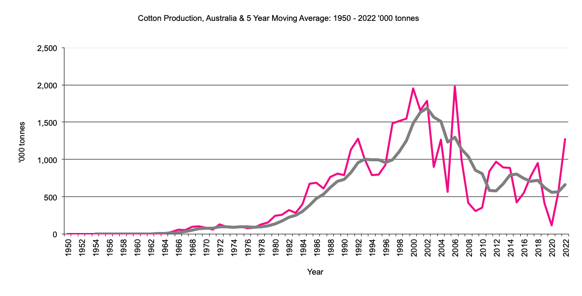
Production of cotton '000 tonnes, 5 year moving average 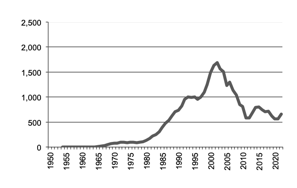
|
Go to Cotton Production graph |
Return to top of page |
Cotton production has had exponential growth increasing from around 80,000 tonnes in the late seventies to over 2 million tonnes in 2011 apart from the 2003 and 2010 drought years. 2/3rds of cotton is produced in NSW and 1/3rd in Queensland.
Cotton - Gross Value Production
|
Cotton- Gross Value of production $m,5 year moving average 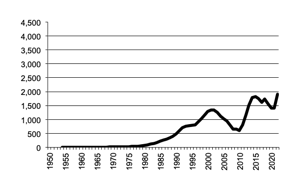
|
Gross Value of Production, Cotton graph |
Return to top of page |
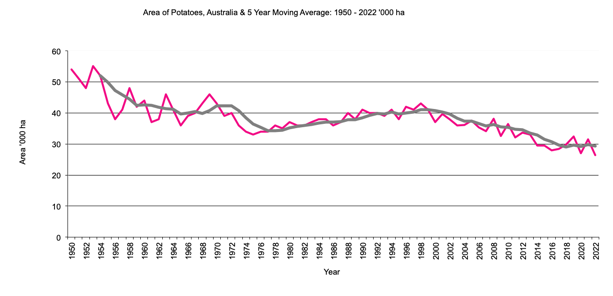
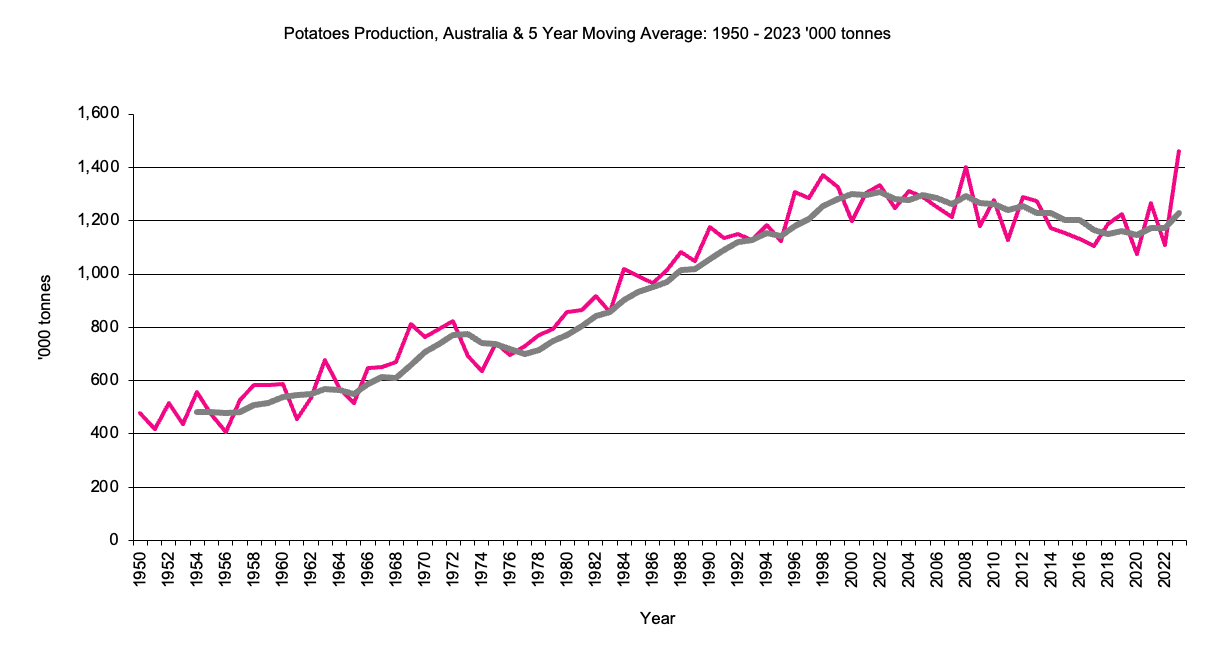
Area of Potatoes '000 hectares from 1950, 5 year moving average.
|
Area of Potatoes graph |
Return to top of page |
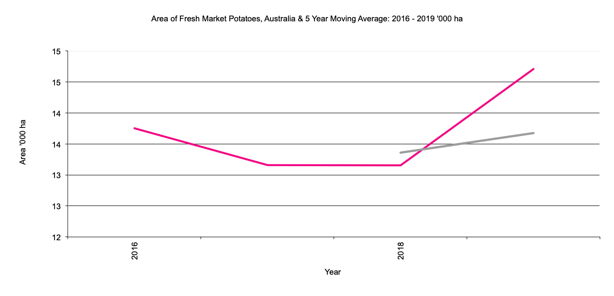
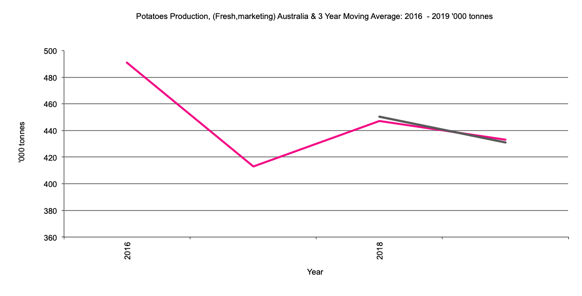
Fresh Market Potatoes - Area
data for 2020-21 not published
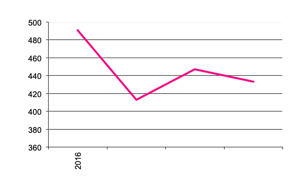
Area of Fresh Market Potatoes from 2016 '000 hectares. 
|
Area of Fresh Market Potatoes graph |
Return to top of page |
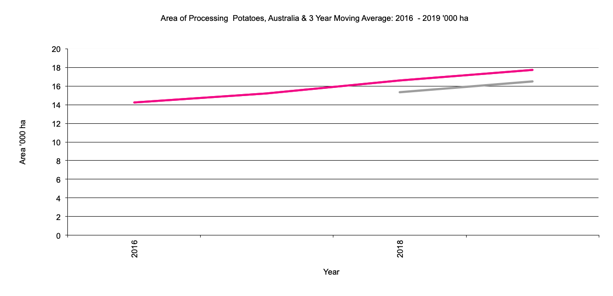
Processing Potatoes - Area
data for 2020-21 not published
Area of Processing Potatoes from 2016 '000 hectares. 
|
Area of Processing Potatoes graph |
Return to top of page |
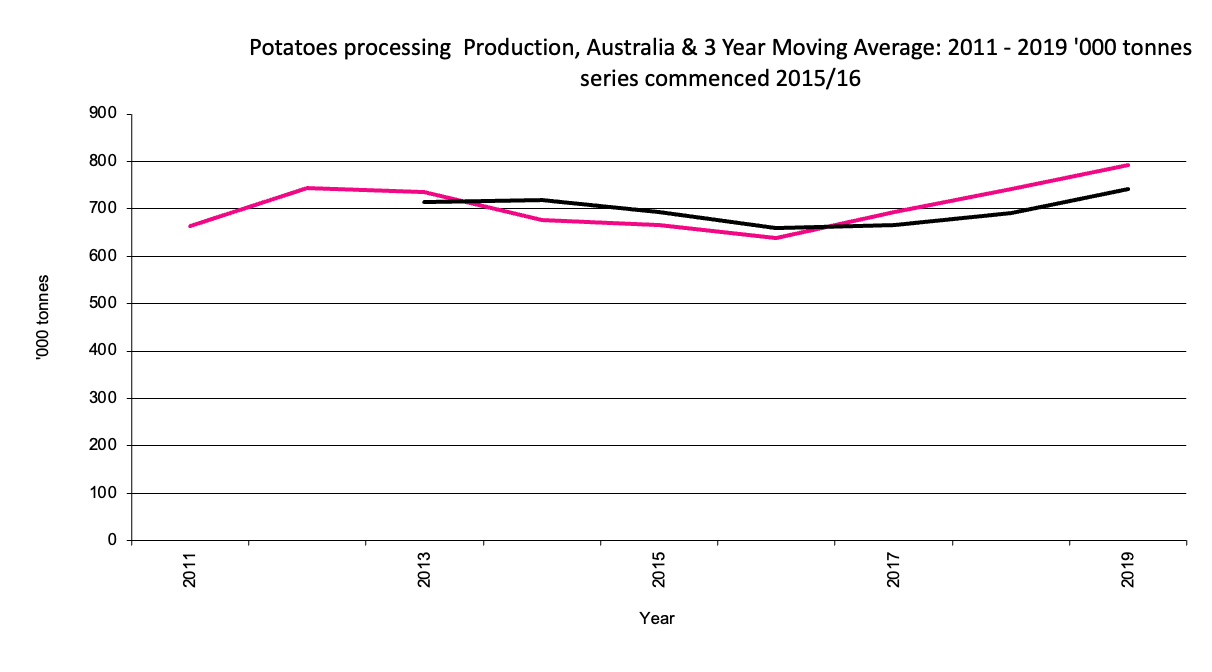
Potatoes - Production
Production of potatoes from 1950 '000 tonnes $m, Potato Production graph Return to top of page Processing Potatoes - Production
Production of Processing potatoes from 2016 '000 tonnes Processing Potatoes Production graph Return to top of page Fresh Market Potatoes - Production
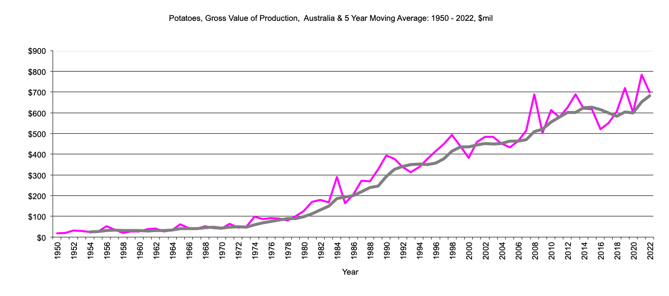
Production of Fresh Market potatoes from 2016 '000 tonnes $m Potatoe Fresh Market Production graph Return to top of page Potatoes - Gross Value Production Potatoes- Gross Value of production from 1950 $m,5 year moving average Gross Value of Production, Potatoes graph Return to top of page Tobacco - Area Area of Tobacco '000 hectares Area of Tobacco graph Return to top of page
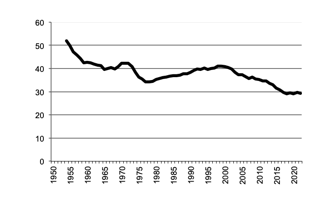
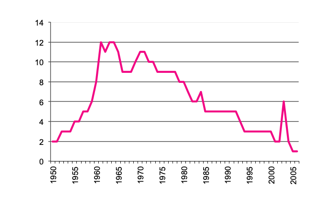
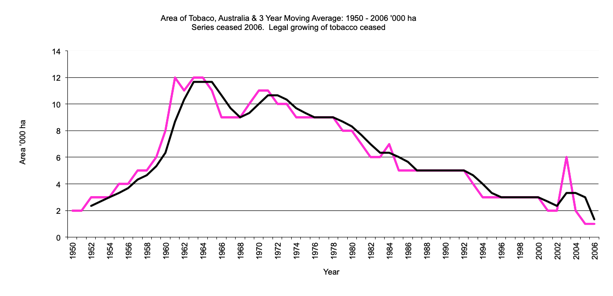
The area reached a peak of 12,000 hectares in the early 1960s. Since then, following the disclosure of the link between tobacco and cancer, the area has declined to 2,000 hectares. Tobacco has been grown mainly in Queensland and Victoria. Production of Tobacco '000 tonnes Tobacco Production graph Return to top of page Tobacco - Gross Value Production Tobacco - Gross Value of production, $m Gross Value of Production,Potatoes graph Return to top of page
5 year moving average 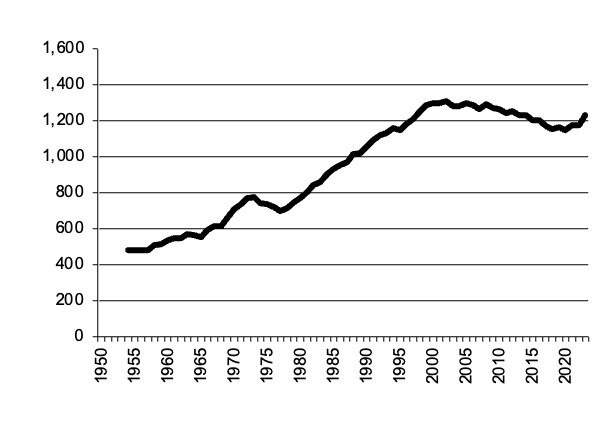
Potato Production data
Go to Potato Production by State
Back to front page
Processing Potatoes Production data
Go to production of Processing Potatoes by State
Back to front page
Potatoe Fresh Market Production data
Go to Potatoes Fresh Market Production by State
Back to front page
Gross Value of Production,Potatoes data
Go to Gross Value of Production, Potatoes by State
Back to front page
Data collection ceased in 2006. The growing of tobacco has ceased.
Area of Tobacco data
Go to Area of Tobacco by State
Back to front page
Tobacco Production data
Go to Production of Tobacco by State
Back to front page
Data collection ceased in 2006. The production of tobacco has ceased.
Gross Value of Production, Tobacco data
Go to Gross Value of Production, Tobacco by State
Back to front page
AgEc Data
Last Updated 13 September 2024
Site prepared by Bob Cason (rgcason@webone.com.au)Email
for more information