Production of grapes'000 tonnes, 5 year moving average
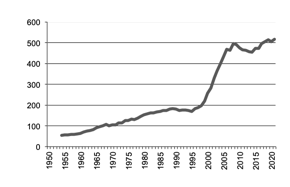
NSW Grapes Production graph
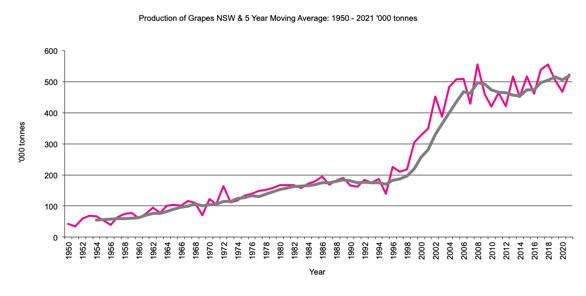
NSW Grapes Production data
Return to top of page
Back to Crops
Back to front page
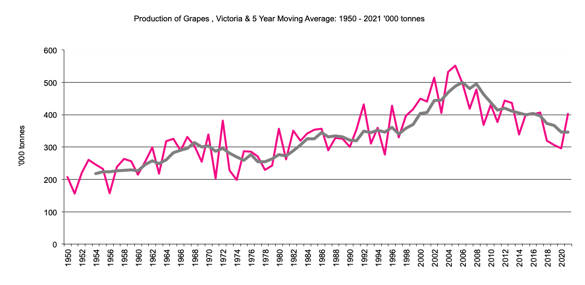
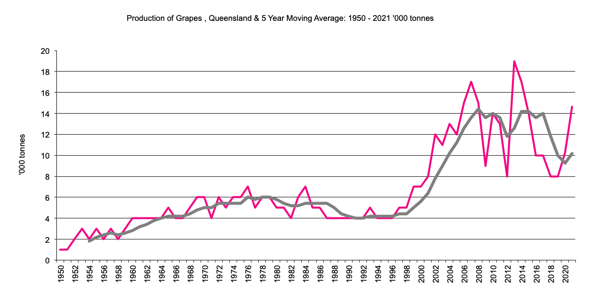
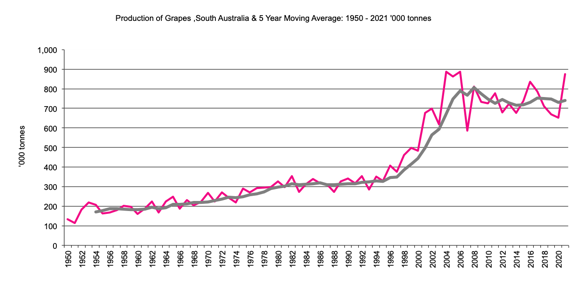
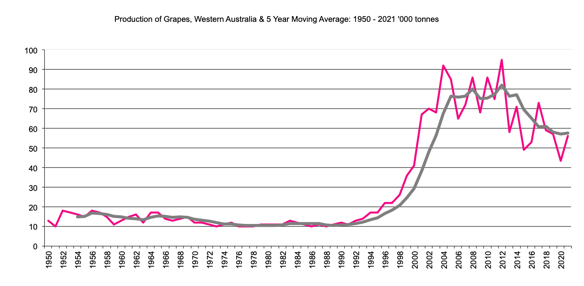
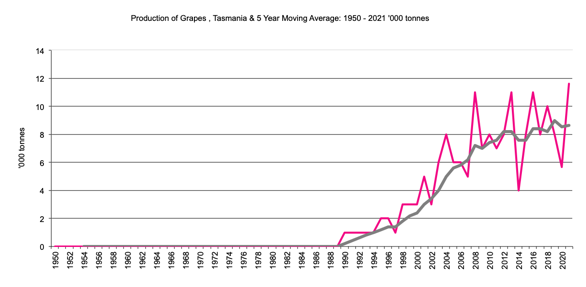
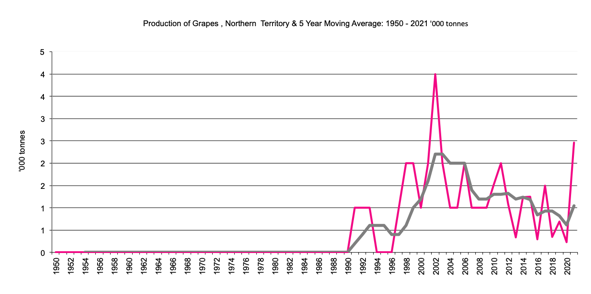
Grapes production includes grapes for wine, table use and dried fruits.
|
|
|
Production of grapes'000 tonnes, 5 year moving average
|
NSW Grapes Production graph |
Return to top of page |
|
Production of grapes '000 tonnes, 5 year moving average 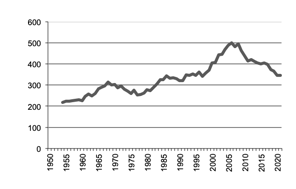
|
Victoria Grapes Production graph |
Return to top of page |
|
Production of grapes '000 tonnes, 5 year moving average 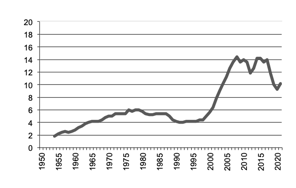
|
Queensland Grapes Production graph |
Return to top of page |
|
Production of grapes'000 tonnes, 5 year moving average 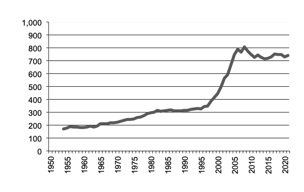
|
South Australia Grapes Production graph |
Return to top of page |
|
Production of grapes'000 tonnes, 5 year moving average 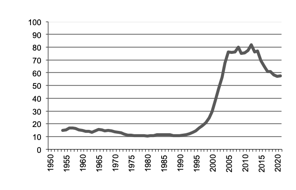
|
Western Australia Grapes Production graph |
Return to top of page |
|
Production of grapes'000 tonnes, 5 year moving average 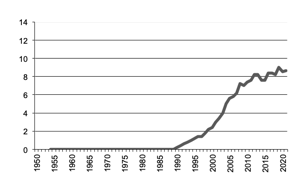
|
Tasmania Grapes Production graph |
Return to top of page |
|
Production of grapes'000 tonnes, 5 year moving average 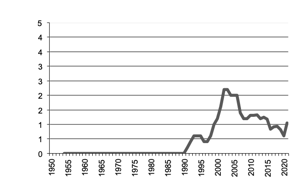
|
Northern Territory Grapes Production graph |
Return to top of page |