Area of Cotton in '000 hectares, 5 year moving average.
NSW Cotton graph
NSW Cotton data
Return to top of page
Back to Crops
Back to front page
|
|
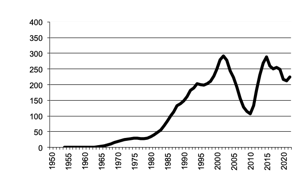
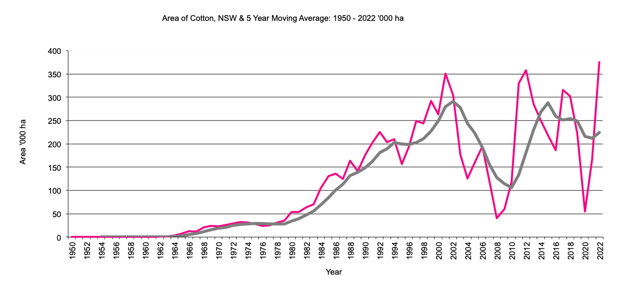
NSW Cotton
|
Area of Cotton in '000 hectares, 5 year moving average.
|
NSW Cotton graph |
Return to top of page |
The area halved from over 300,000 hectares in 2001 and 2002, most likely due to drought conditions. Cotton growing commenced in NSW in the early 1960's.
Queensland Cotton
|
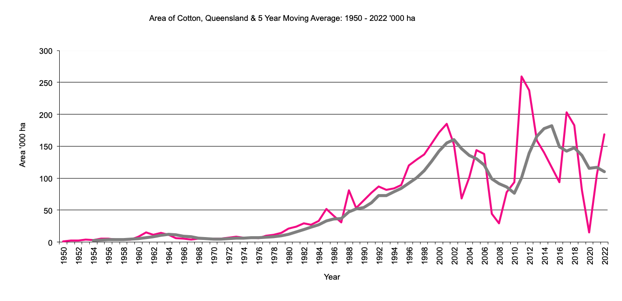
Area of Cotton in '000 hectares,5 year moving average. 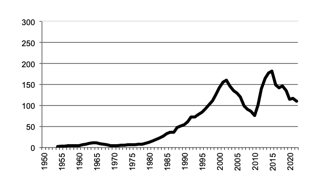
|
Queensland Cotton graph |
Return to top of page |
The area has fallen from a peak of over 170,000 hectares in 2000 and 2001 . Cotton has been grown in Queensland for over 50 years.
Western Australia Cotton
|
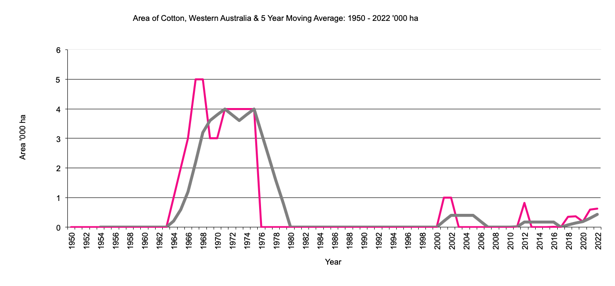
Area of Cotton in '000 hectares, 5 year moving average.. 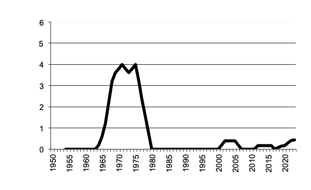
|
Western Australia Cotton graph |
Return to top of page |
Northern Territory Cotton
|
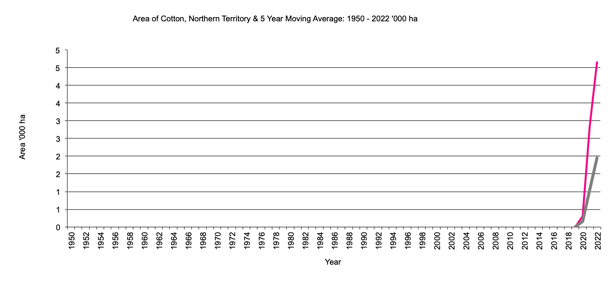
Area of Cotton in '000 hectares, 5 year moving average.. 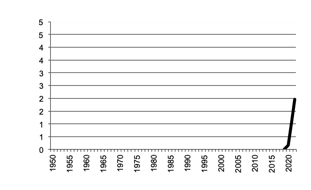
|
Northern Territory Cotton graph |
Return to top of page |