Area of Potatoes in '000 hectares, 5 year moving average.
NSW Potatoes graph
NSW Potatoes data
Return to top of page
Back to Crops
Back to front page
|
|
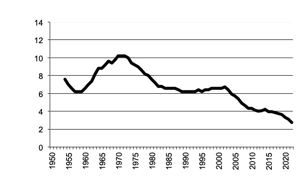
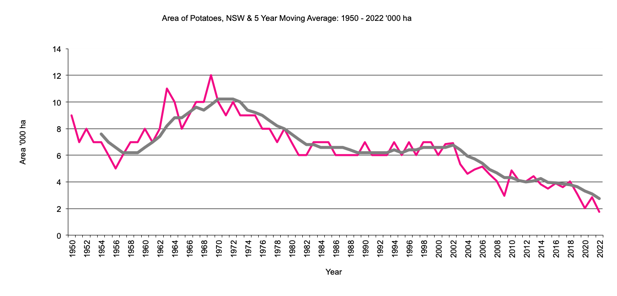
NSW Potatoes
|
Area of Potatoes in '000 hectares, 5 year moving average.
|
NSW Potatoes graph |
Return to top of page |
Victoria Potatoes
|
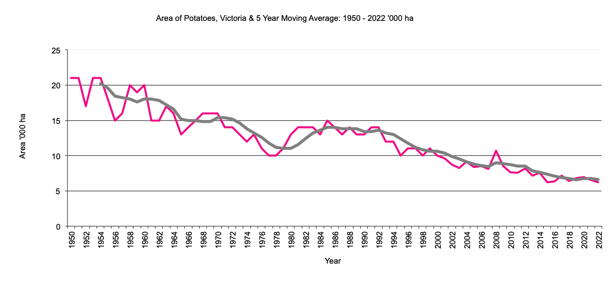
Area of Potatoes in '000 hectares, 5 year moving average. 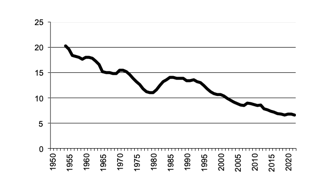
|
Victoria Potatoes graph |
Return to top of page |
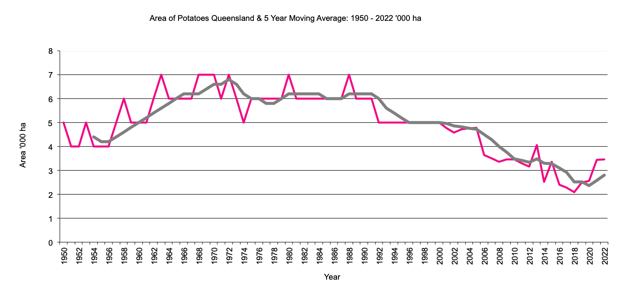
Queensland Potatoes
|
Area of Potatoes in '000 hectares, 5 year moving average. 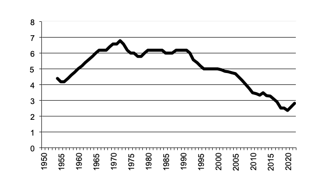
|
Queensland Potatoes graph |
Return to top of page |
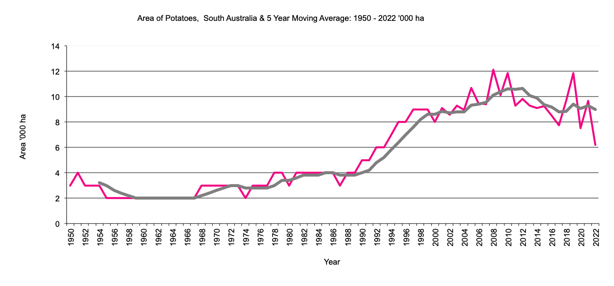
South Australia Potatoes
|
Area of Potatoes in '000 hectares, 5 year moving average. 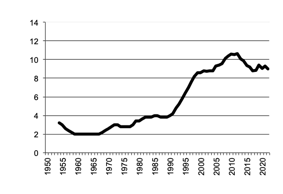
|
South Australia Potatoes graph |
Return to top of page |
From 1990 the area of potatoes has more than doubled .
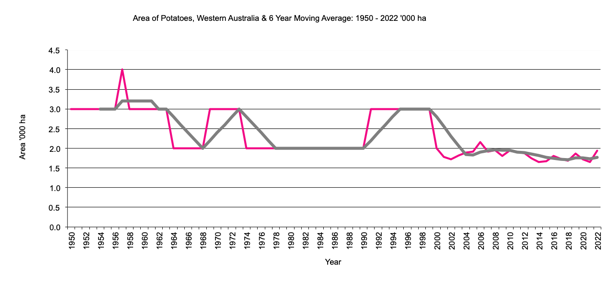
Western Australia Potatoes
|
Area of Potatoes in '000 hectares, 5 year moving average. 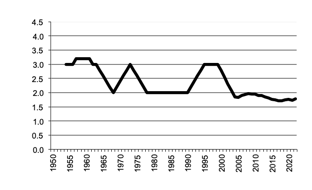
|
Western Australia Potatoes graph |
Return to top of page |
The area of potatoes grown has been stable around 2,000 hectares.
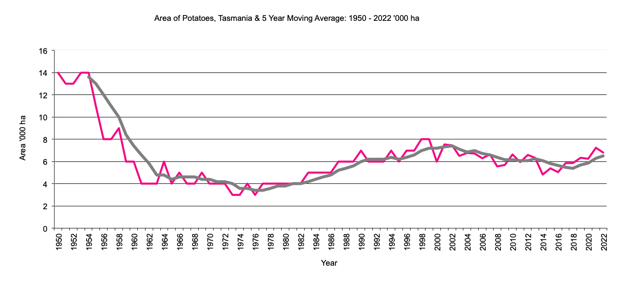
Tasmania Potatoes
|
Area of Potatoes in '000 hectares, 5 year moving average. 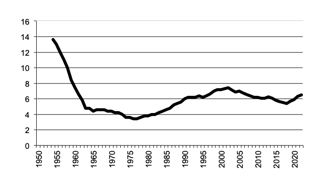
|
Tasmania Potatoes graph |
Return to top of page |
Tasmania has seen a decline in area of potatoes in the 1950's with a partial recovery in the last few years to around 6,000 hectares.