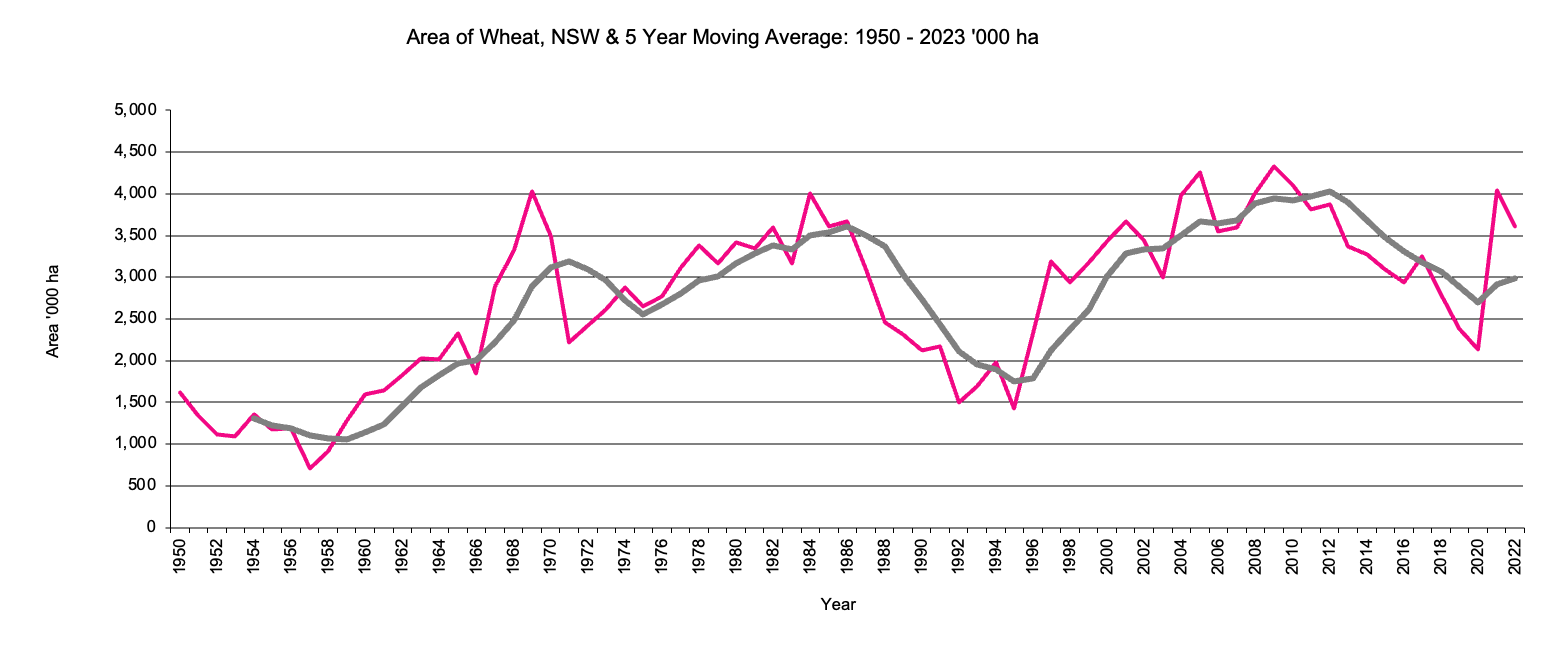
Area of Wheat in '000 hectares, 5 year moving average.
Return to top of page
Back to Crops
Back to front page
|
|
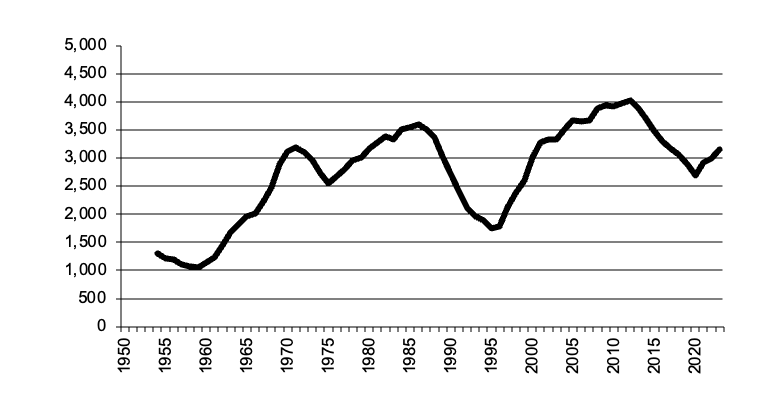
NSW Wheat
|
Area of Wheat in '000 hectares, 5 year moving average.
|
Return to top of page |
In recent years the area has reached previous peaks of around 4 million hectares
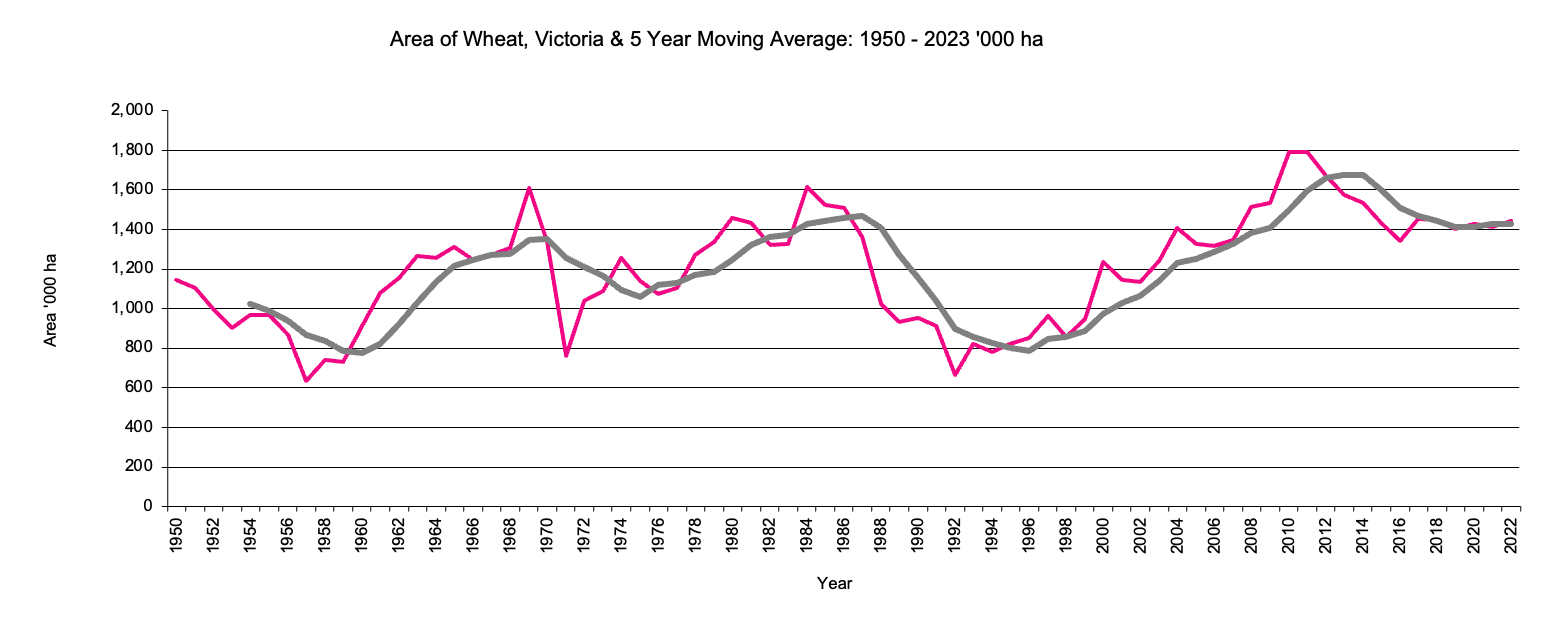
Victoria Wheat
|
Area of Wheat in '000 hectares,5 year moving average.. 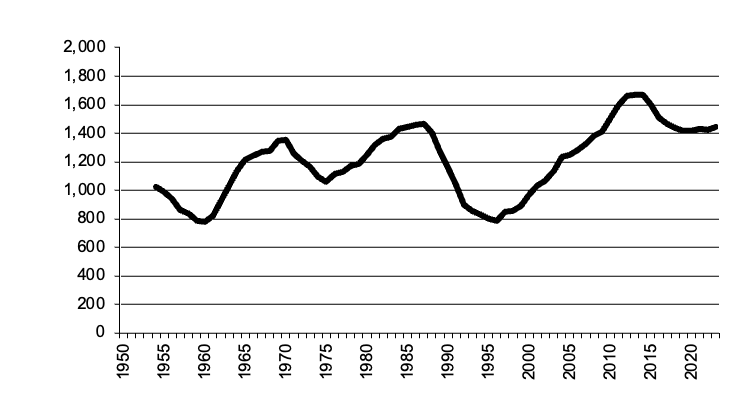
|
Victoria Wheat graph |
Return to top of page |
Area of wheat has reached around 1.7 million hectares. Previously the area peaked around 1984 and 1969 at 1.6mil hectares.
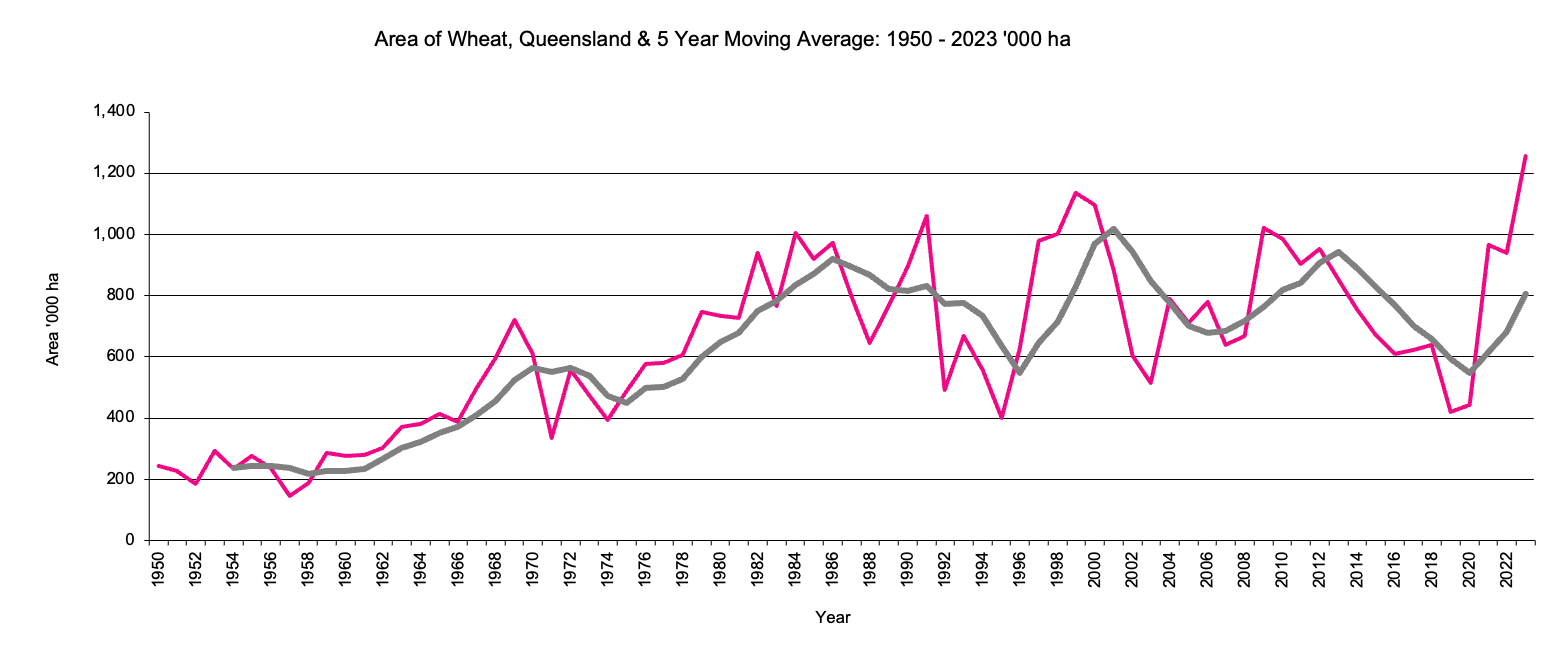
Queensland Wheat
|
Area of Wheat in '000 hectares,5 year moving average.. 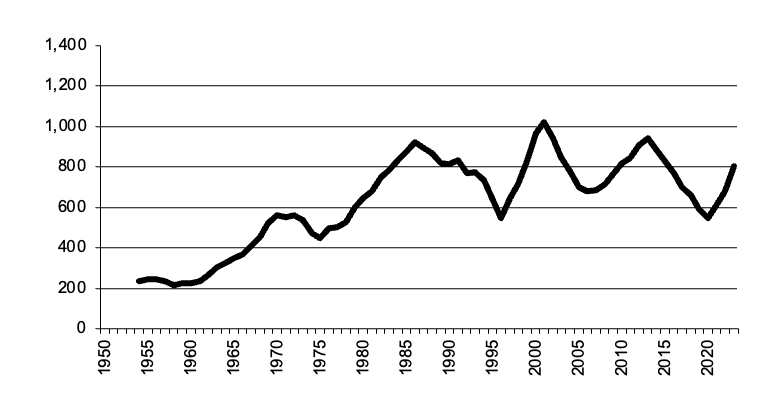
|
Queensland Wheat graph |
Return to top of page |
Area of wheat has fluctuated more than other states varying from 1,100 thousand hectares to around 600 thousand hectares during the last decade. Queensland also had peaks in 1969,1984 1999 and 2009.
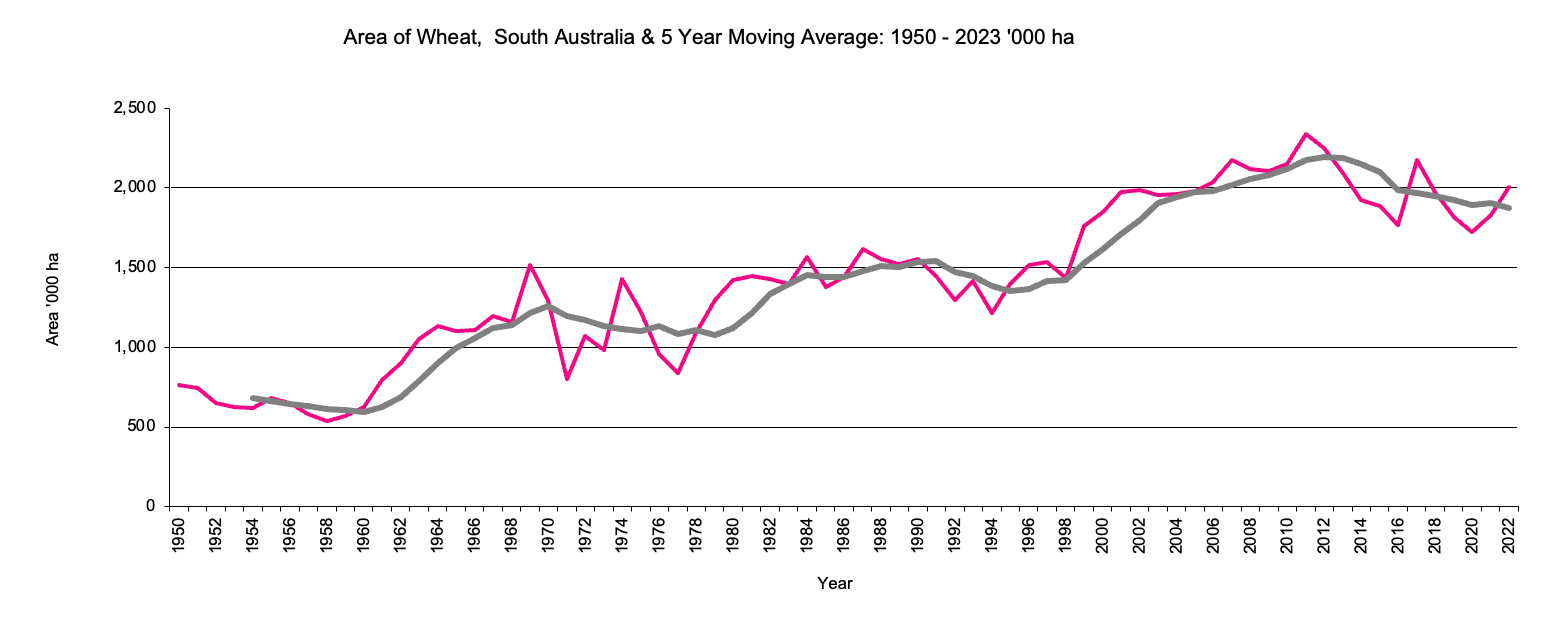
South Australia Wheat
|
Area of Wheat in '000 hectares,5 year moving average. 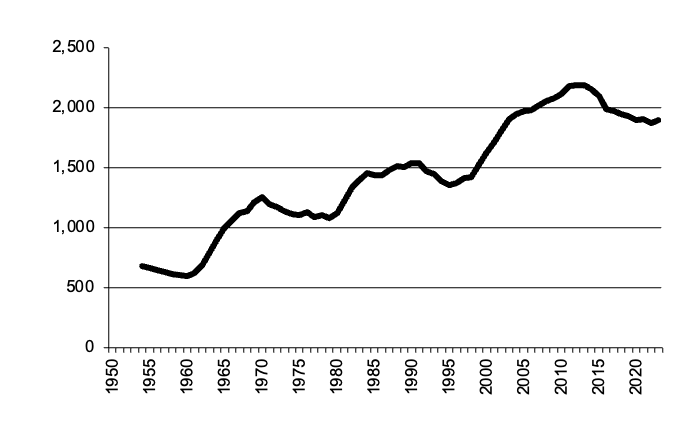
|
South Australia Wheat graph |
Return to top of page |
From 1984 the area of wheat has been around 1.5mil. hectares, rising to over 2.0mil. hectares during the last few years.
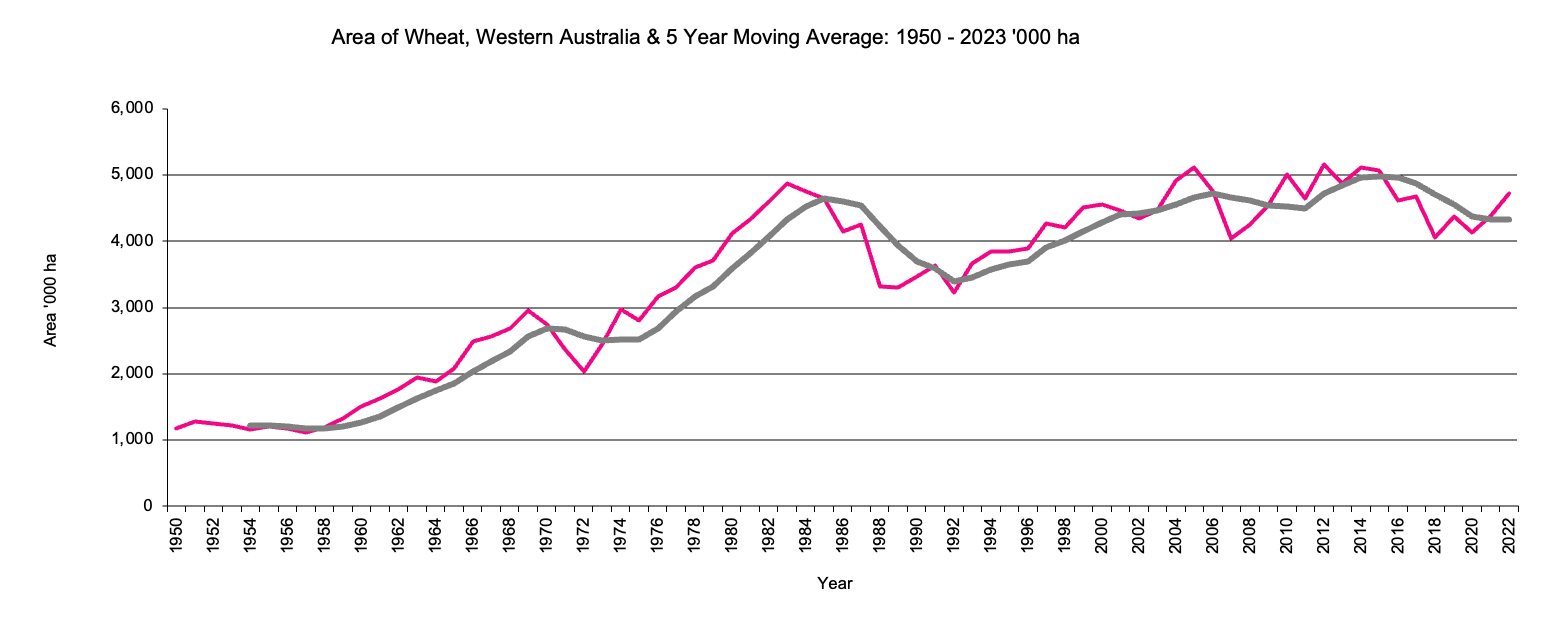
Western Australia Wheat
|
Area of Wheat in '000 hectares,5 year moving average.. 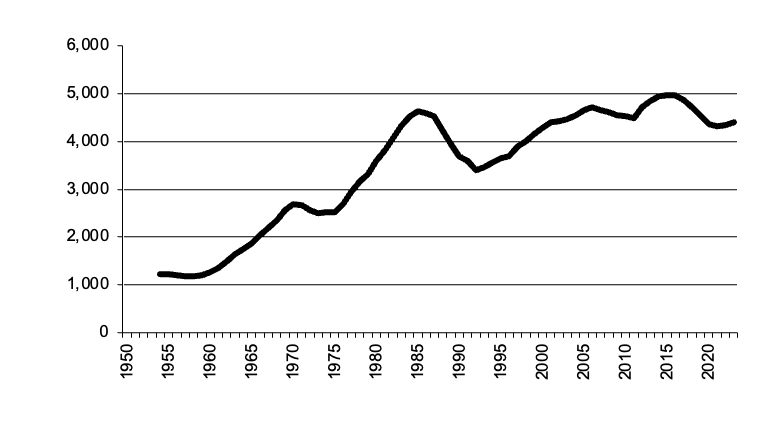
|
Western Australia Wheat graph |
Return to top of page |
Western Australia became the major wheat growing state by area in 1974 when it surpased NSW. Current area has been around 5mil hectares.
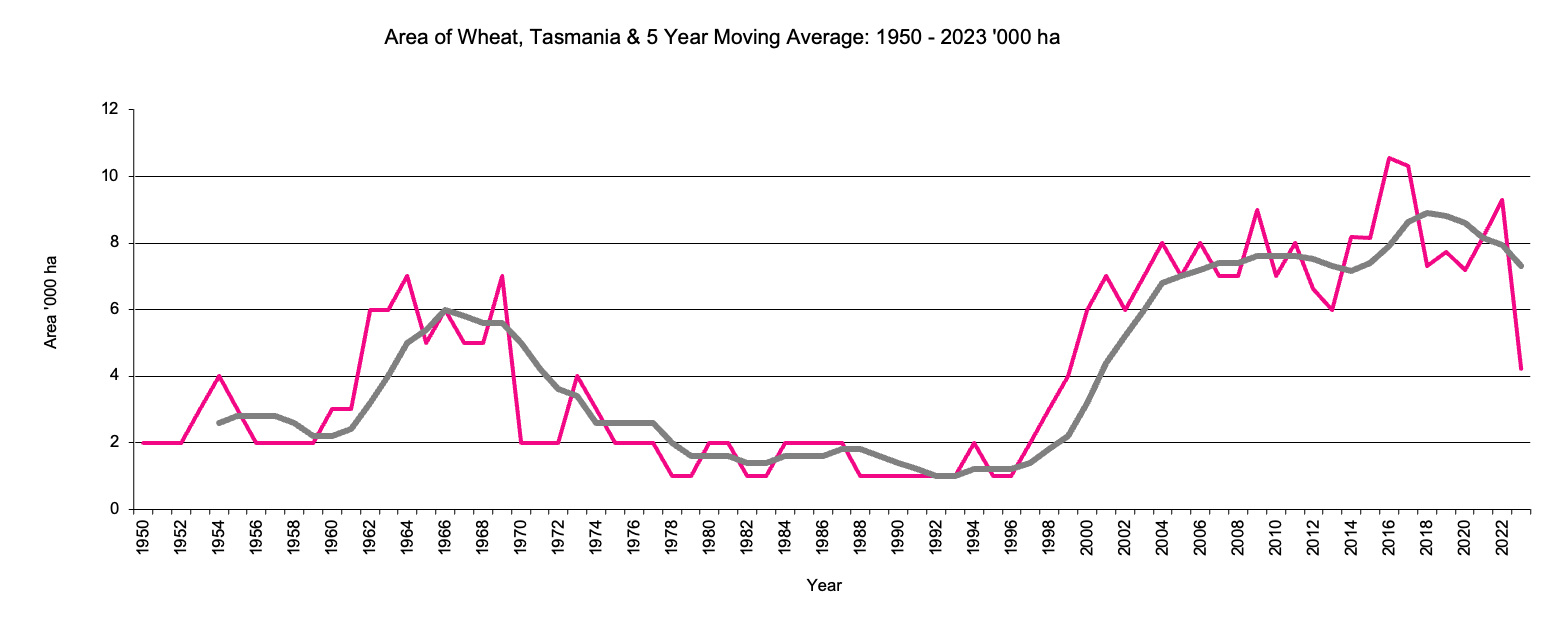
Tasmania Wheat
|
Area of Wheat in '000 hectares,5 year moving average.. 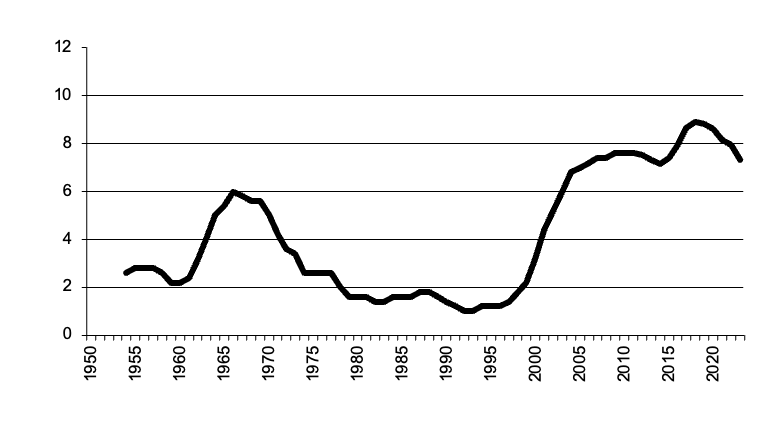
|
Tasmania Wheat graph |
Return to top of page |
Tasmania has less than 1% of Australia's wheat. Since 1950 the area has varied from 1,000 to around 8,000 hectares.