Production of maize '000 tonnes,
5 year moving average
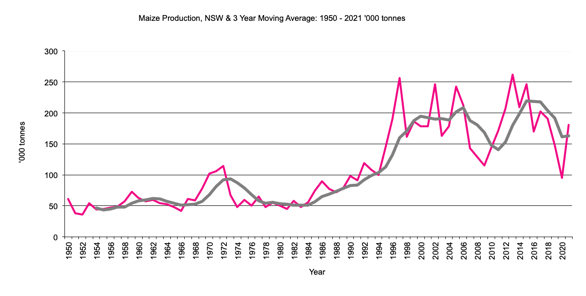
NSW Maize Production graph
NSW Maize Production data
Return to top of page
Back to Crops
Back to front page
|
|
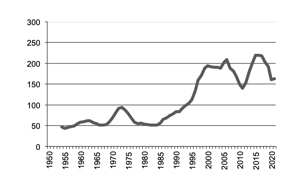
NSW Maize Production
|
Production of maize '000 tonnes,
|
NSW Maize Production graph |
Return to top of page |
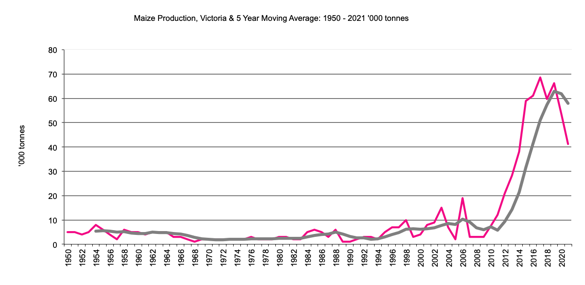
Victoria Maize Production
|
Production of maize '000 tonnes, 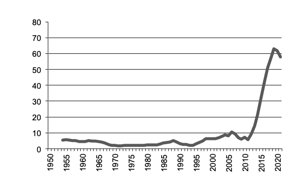
|
Victoria Maize Production graph |
Return to top of page |
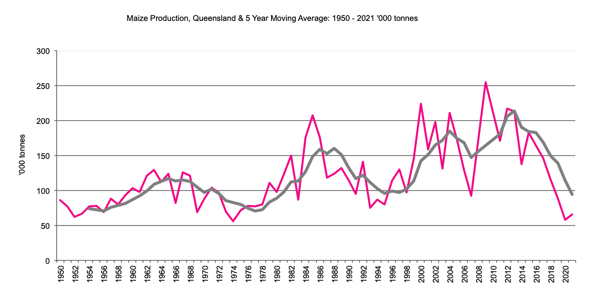
Queensland Maize Production
|
Production of maize '000 tonnes, 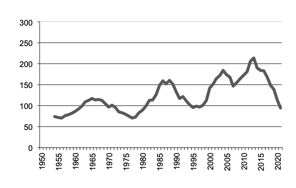
|
Queensland Maize Production graph |
Return to top of page |
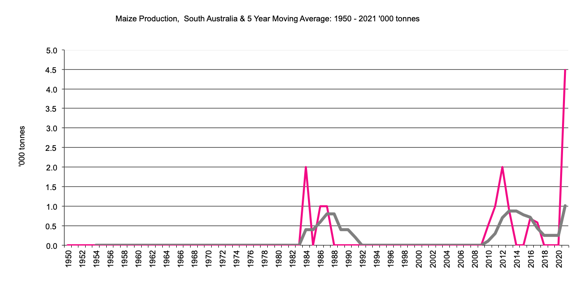
South Australia Maize Production
|
Production of maize '000 tonnes, 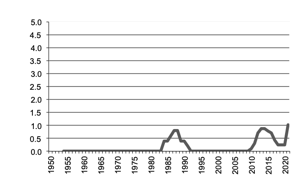
|
South Australia Maize Production graph |
Return to top of page |
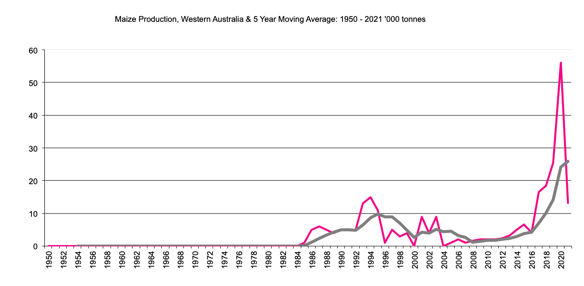
Western Australia Maize Production
|
Production of maize '000 tonnes, 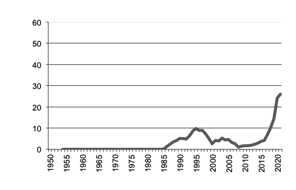
|
Western Australia Maize Production graph |
Return to top of page |
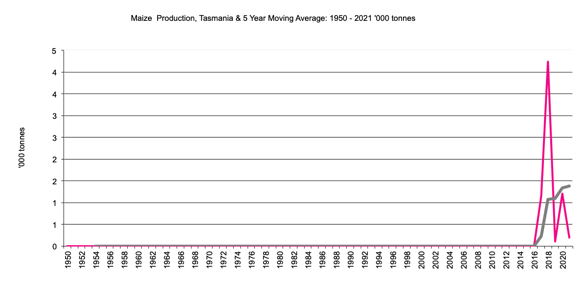
Tamania Maize Production
|
Production of maize '000 tonnes, 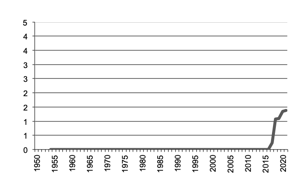
|
Tamania Maize Production graph |
Return to top of page |
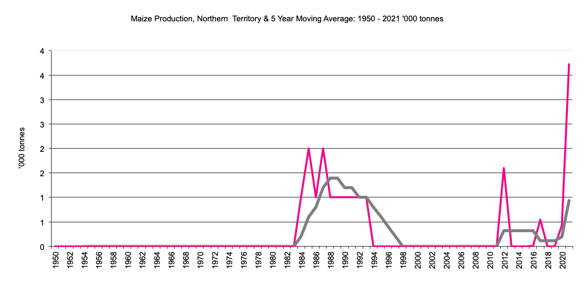
Northern Territory Maize Production
|
Production of maize '000 tonnes, 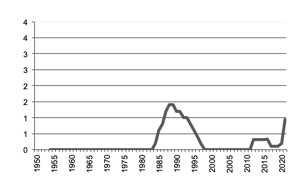
|
Northern Territory Maize Production graph |
Return to top of page |