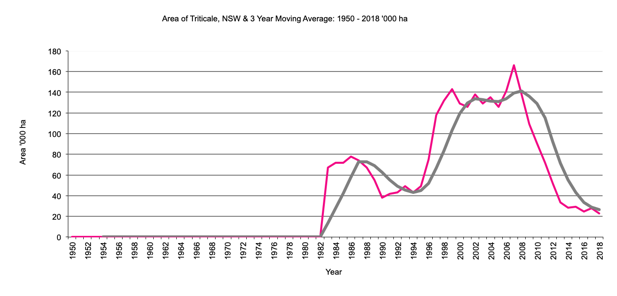
Area of Triticale in '000 hectares, 5 year moving average.
Data not published after 2018
NSW Triticale graph
NSW Triticale data
Return to top of page
Back to Crops
Back to front page
|
|
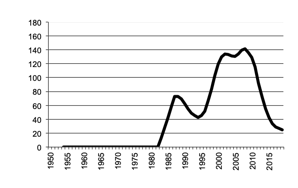
NSW Triticale
|
Area of Triticale in '000 hectares, 5 year moving average. |
NSW Triticale graph |
Return to top of page |
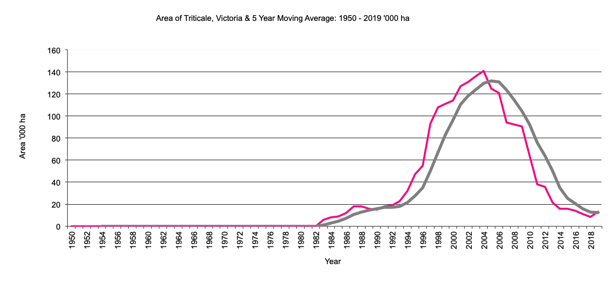
Victoria Triticale
|
Area of Triticale in '000 hectares, 5 year moving average. 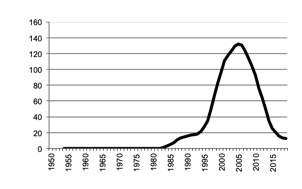
Data not published after 2018 |
Victoria Triticale graph |
Return to top of page |
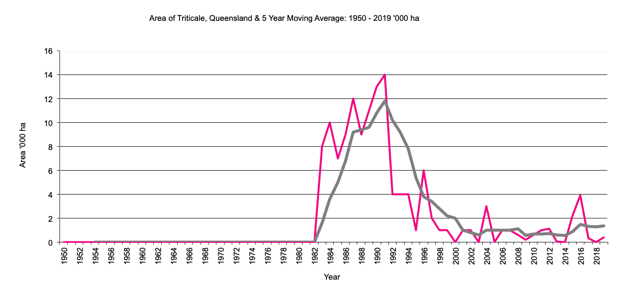
Queensland Triticale
|
Area of Triticale in '000 hectares, 5 year moving average. 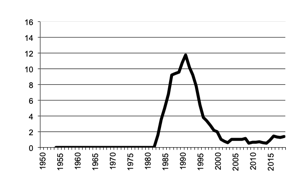
Data not published after 2018 |
Queensland Triticale graph |
Return to top of page |
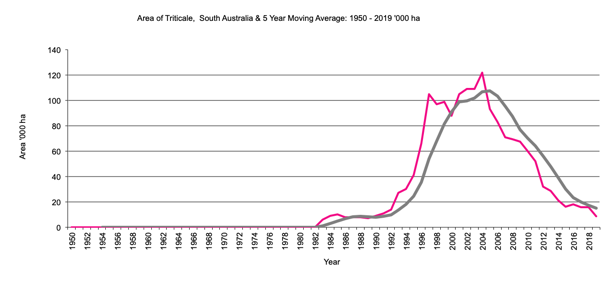
South Australia Triticale
|
Area of Triticale in '000 hectares, 5 year moving average. 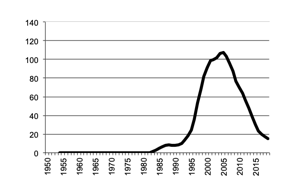
Data not published after 2018 |
South Australia Triticale graph |
Return to top of page |
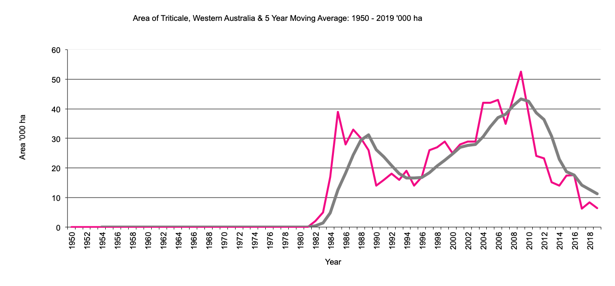
Western Australia Triticale
|
Area of Triticale in '000 hectares, 5 year moving average. 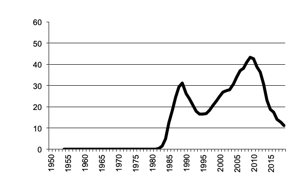
Data not published after 2018 |
Western Australia Triticale graph |
Return to top of page |
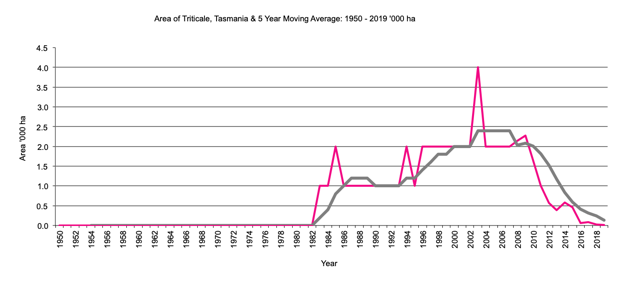
Tasmania Triticale
|
Area of Triticale in '000 hectares, 5 year moving average. 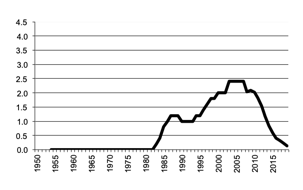
Data not published after 2018 |
Tasmania Triticale graph |
Return to top of page |