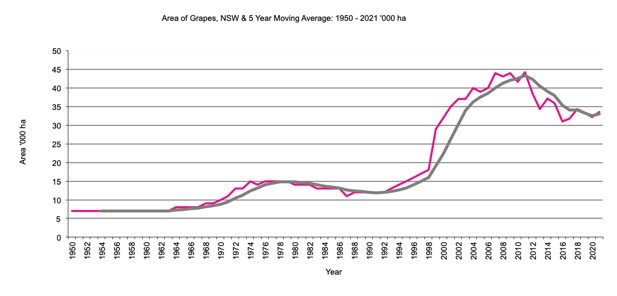
Area of Grapes in '000 hectares, 5 year moving average.
NSW Grapes graph
NSW Grapes data
Return to top of page
Back to Crops
Back to front page
|
|
NSW Grapes
|
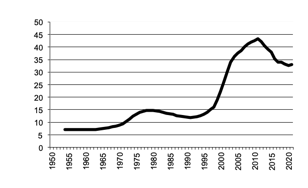
Area of Grapes in '000 hectares, 5 year moving average.
|
NSW Grapes graph |
Return to top of page |
Area of grapes has trebled since the early 1990's to over 40,000 hectares.
Victoria Grapes
|
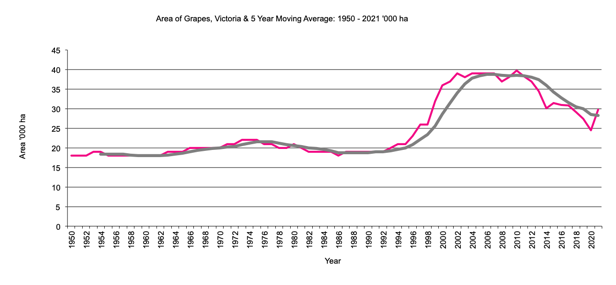
Area of Grapes in '000 hectares, 5 year moving average.. 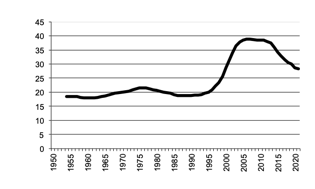
|
Victoria Grapes graph |
Return to top of page |
Area of grapes has doubled since the early 1990's to almost 40,000 hectares.
Queensland Grapes
|
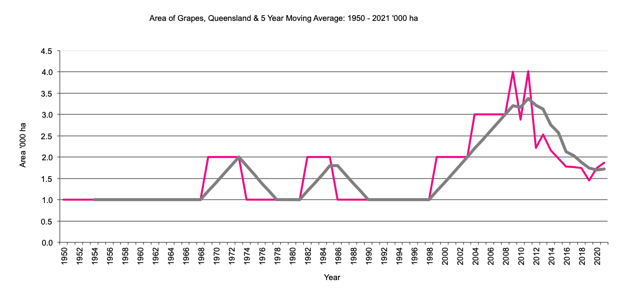
Area of Grapes in '000 hectares, 5 year moving average. 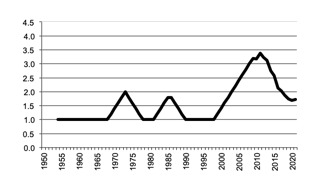
|
Queensland Grapes graph |
Return to top of page |
South Australia Grapes
|
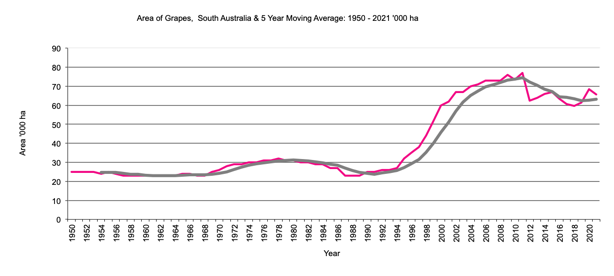
Area of Grapes in '000 hectares, 5 year moving average.. 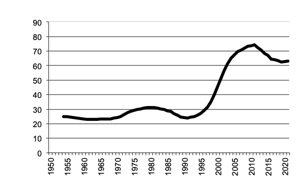
|
South Australia Grapes graph |
Return to top of page |
From around 1990 the area of grapes has expanded 1 and a half times to over 70,000 hectares.
Western Australia Grapes
|
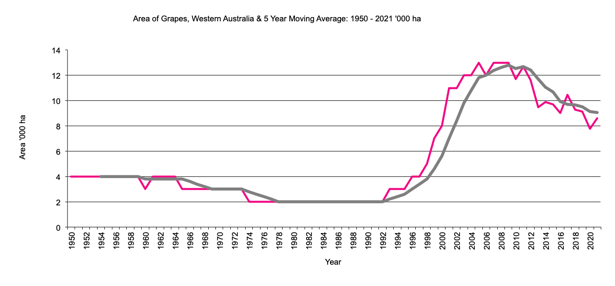
Area of Grapes in '000 hectares, 5 year moving average.. 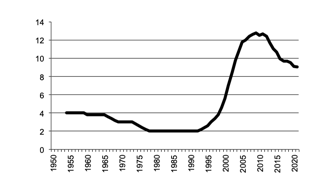
|
Western Australia Grapes graph |
Return to top of page |
From the early 1990's the area of grapes has expanded from 2,000 to 12,000 hectares.
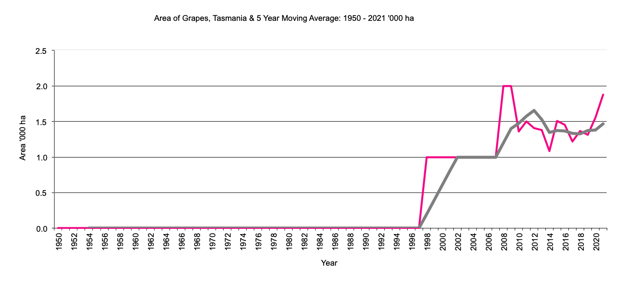
Tasmania Grapes
|
Area of Grapes in '000 hectares, 5 year moving average. 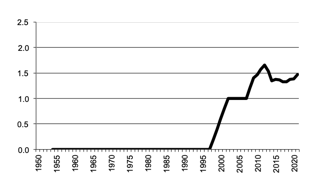
|
Tasmania Grapes graph |
Return to top of page |
Tasmania has only recently had a significant area of grapes with over 1000 ha. now grown.
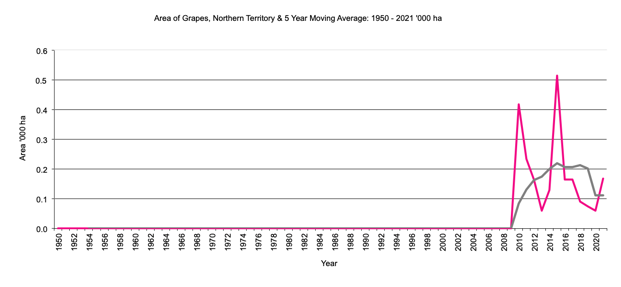
Northern Territory Grapes
|
Area of Grapes in '000 hectares, 5 year moving average.. 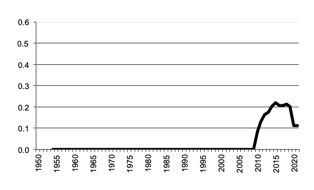
|
Northern Territory Grapes graph |
Return to top of page |
Only table grapes are grown in the Northern Territory