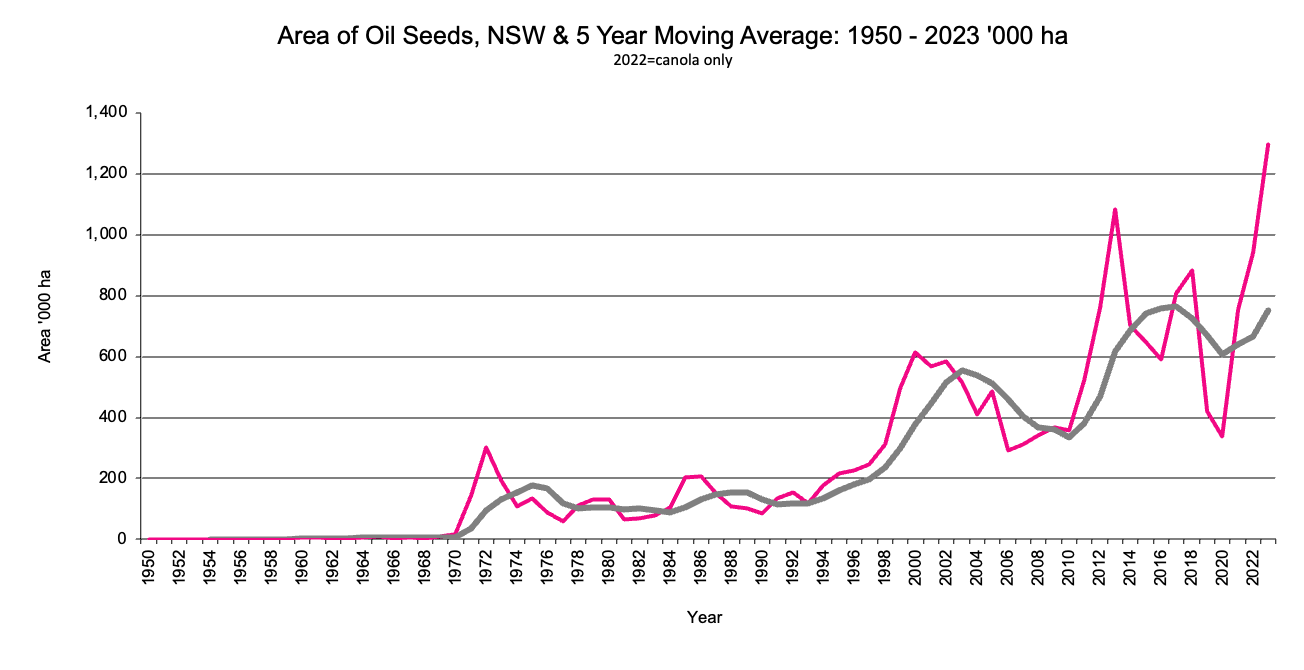
Area of Oil Seeds in '000 hectares, 5 year moving average.
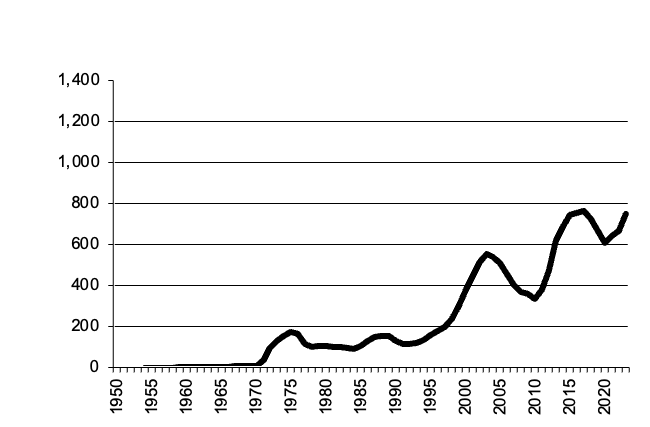
NSW Oil Seeds graph
NSW Oil Seeds data
Return to top of page
Back to Crops
Back to front page
|
|
NSW Oil Seeds
|
Area of Oil Seeds in '000 hectares, 5 year moving average.
|
NSW Oil Seeds graph |
Return to top of page |
After peaking at 300,000 hectares in 1972, the area of oilseeds has fluctuated reaching 1 million hectares.
Victoria Oil Seeds
|
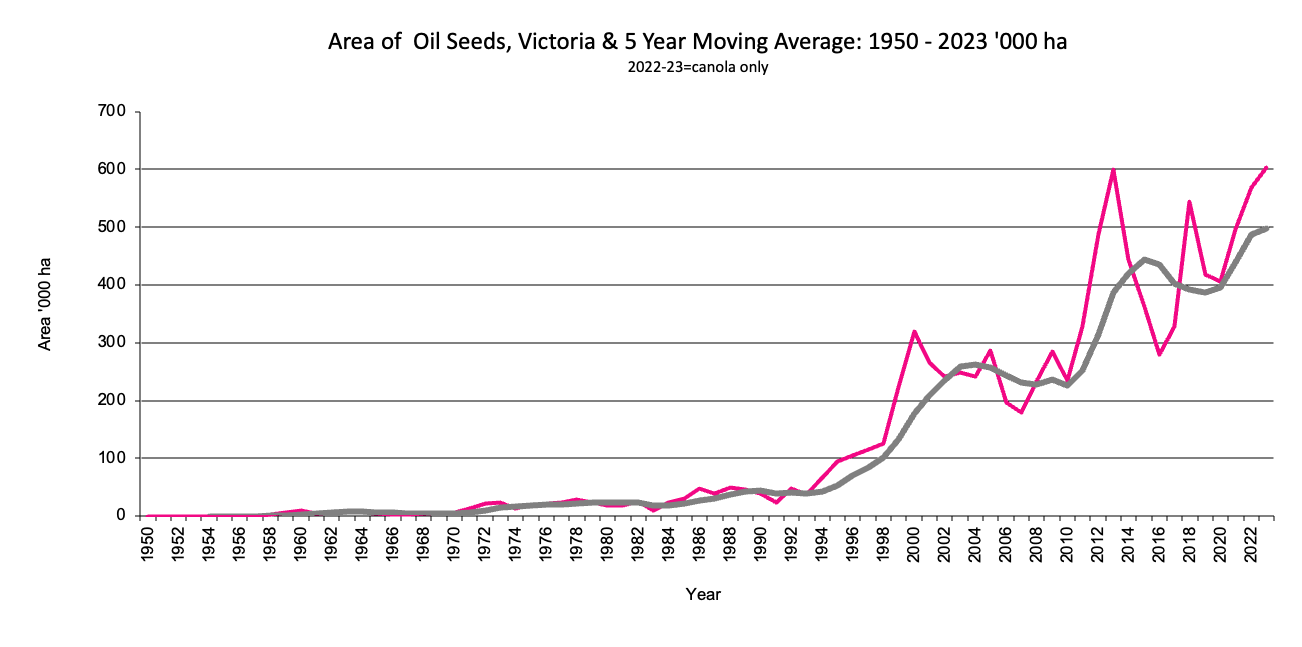
Area of Oil Seeds in '000 hectares, 5 year moving average. 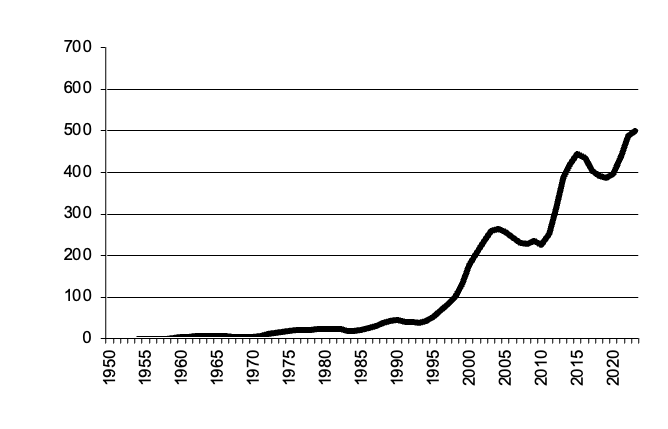
|
Victoria Oil Seeds graph |
Return to top of page |
The area of oil seeds expanded rapidly after 1994 from 50,000.
Queensland Oil Seeds
|
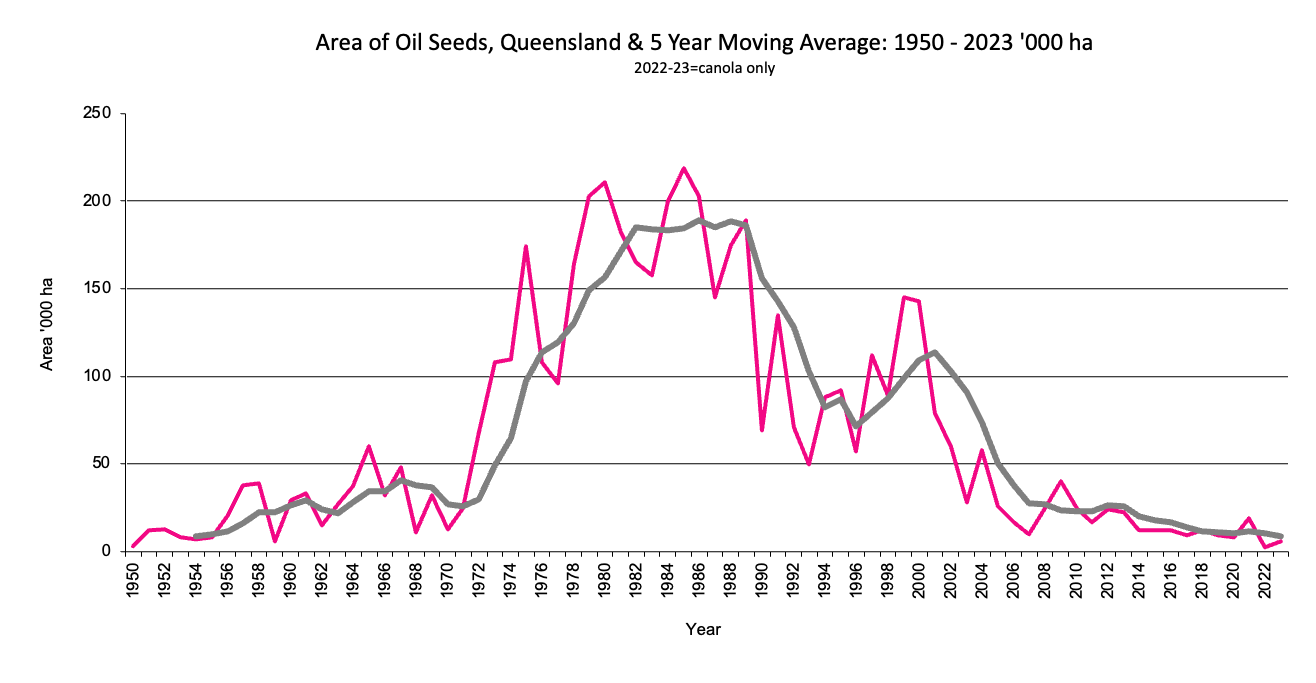
Area of Oil Seeds in '000 hectares, 5 year moving average.. 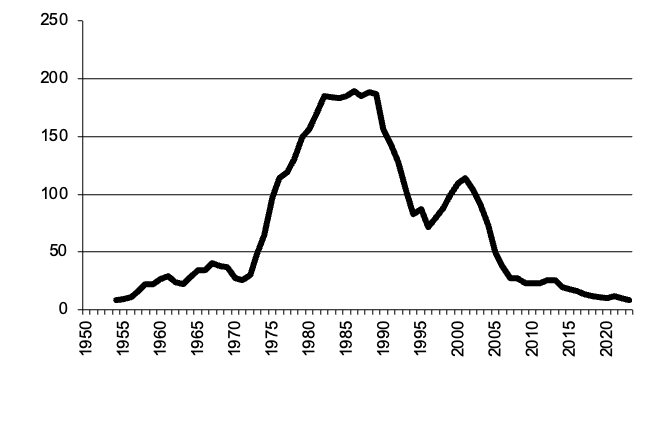
|
Queensland Oil Seeds graph |
Return to top of page |
The area of oil seeds reached peaks of around 200,000 hectares in the early 1980s. The area is now generally less than 100,000 hectares.
South Australia Oil Seeds
|
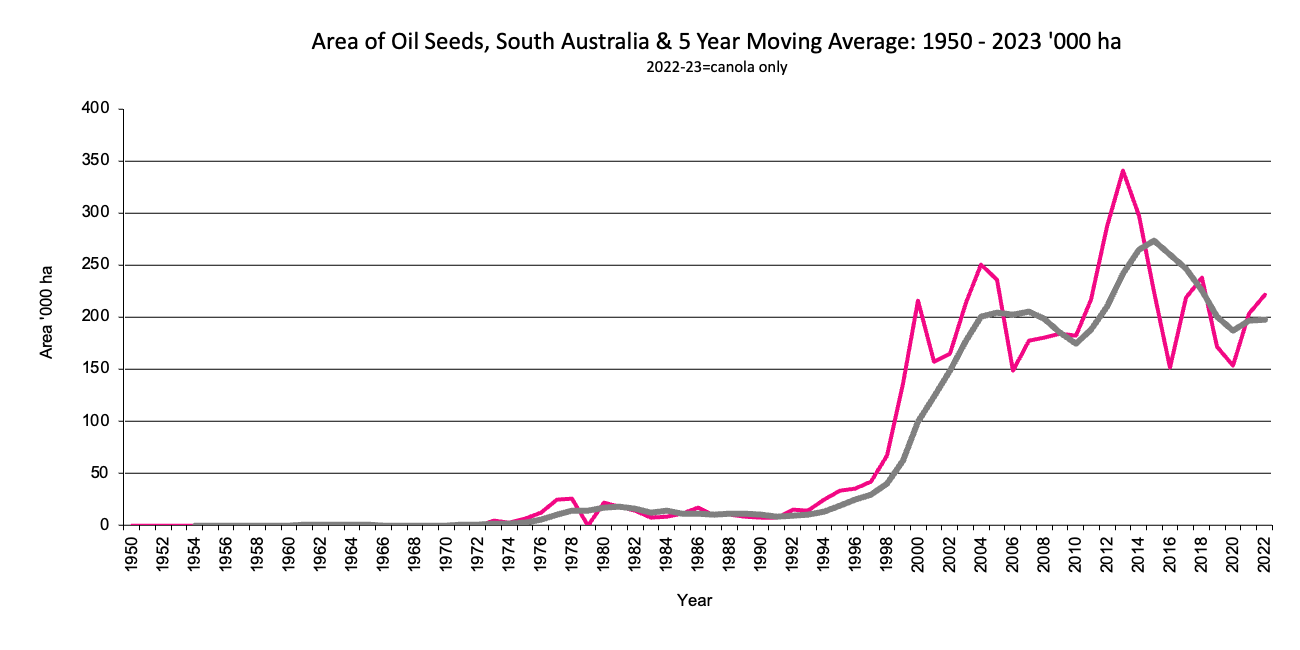
Area of Oil Seeds in '000 hectares, 5 year moving average. 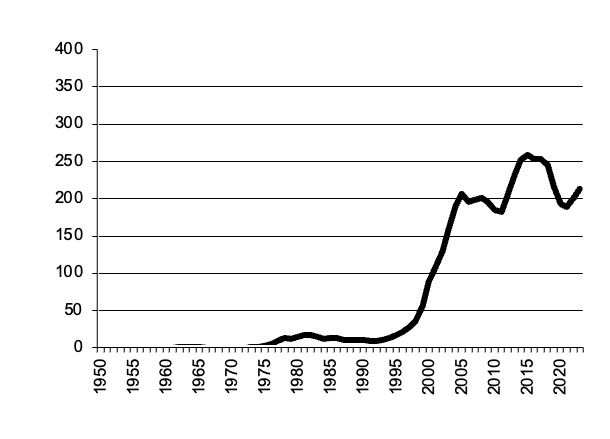
|
South Australia Oil Seeds graph |
Return to top of page |
The area of oil seeds went from less than 50,000 hectares in the early 1990s to over 200,000 hectares.
Western Australia Oil Seeds
|
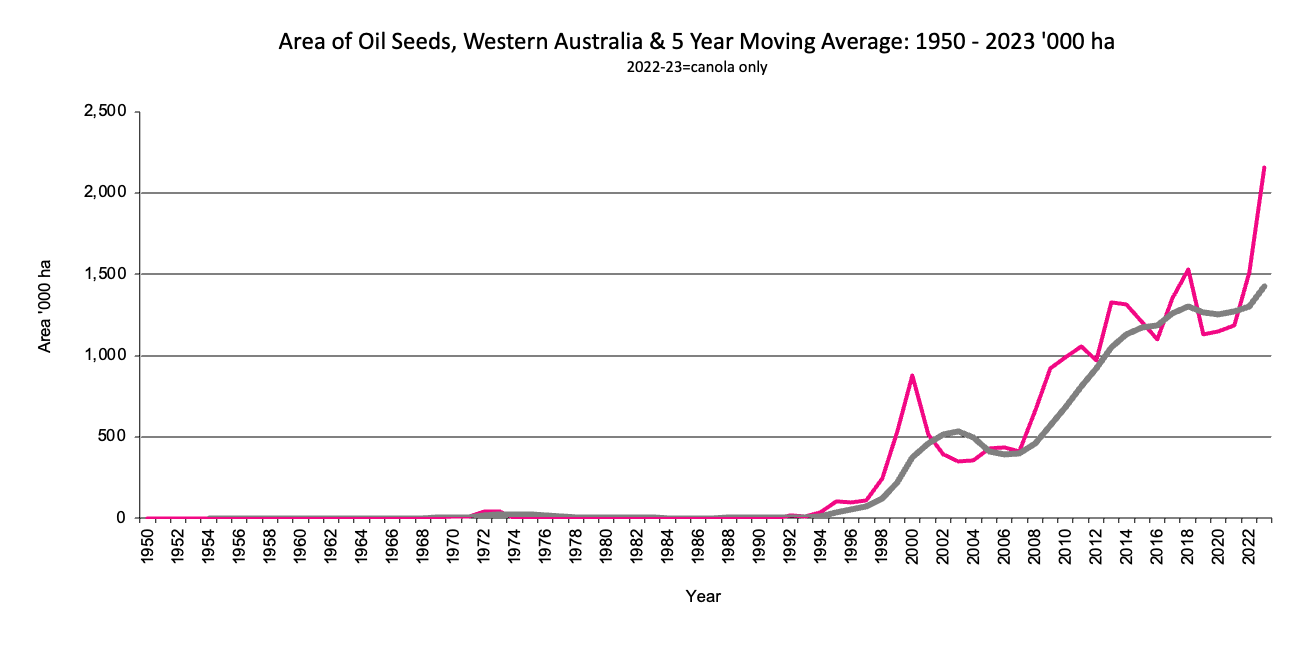
Area of Oil Seeds in '000 hectares, 5 year moving average. 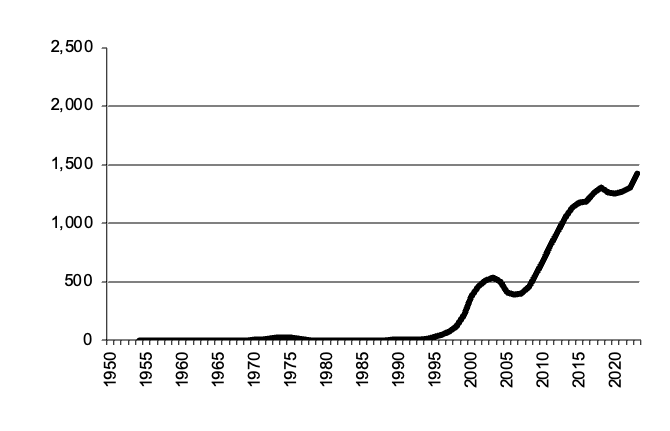
|
Western Australia Oil Seeds graph |
Return to top of page |
From almost nil area in the early 1990s the area of oil seeds in Western Australia reached around one million hectares.
Tasmania Oil Seeds
|
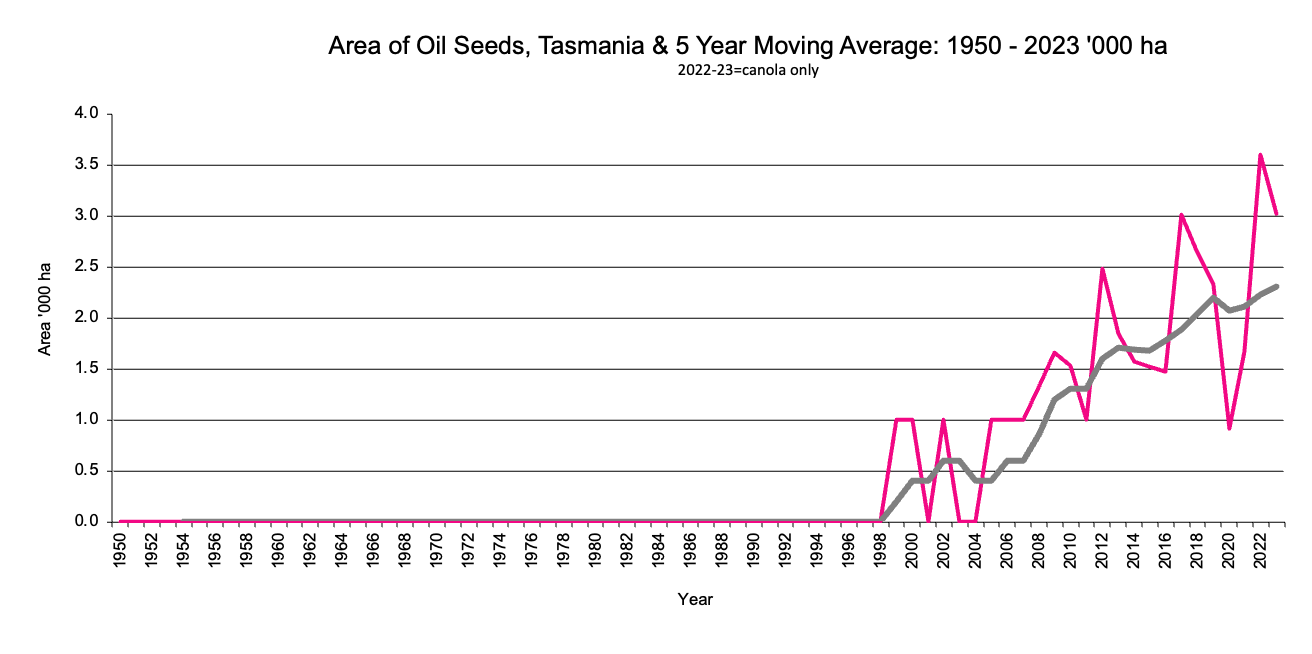
Area of Oil Seeds in '000 hectares, 5 year moving average. 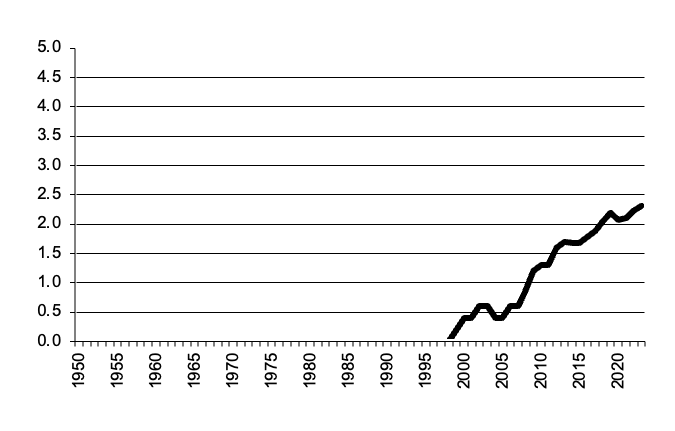
|
Tasmania Oil Seeds graph |
Return to top of page |
Oil seeds have only recently been grown in Tasmania as shown by the data.
Northern Territory Oil Seeds
|
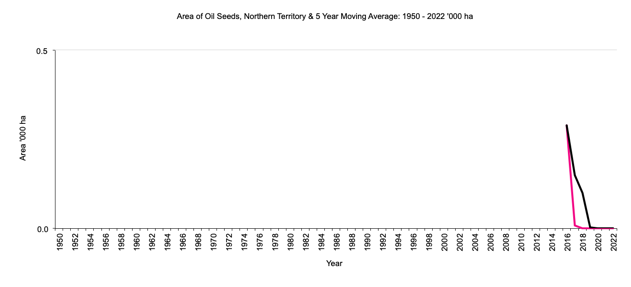
Area of Oil Seeds in '000 hectares, 5 year moving average. 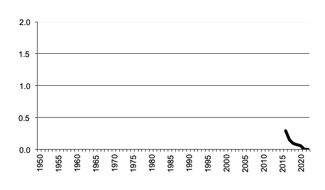
|
Northern Territory Oil Seeds graph |
Return to top of page |