Area of Oats in '000 hectares, 5 year moving average.
Return to top of page
Back to Crops
Back to front page
|
|
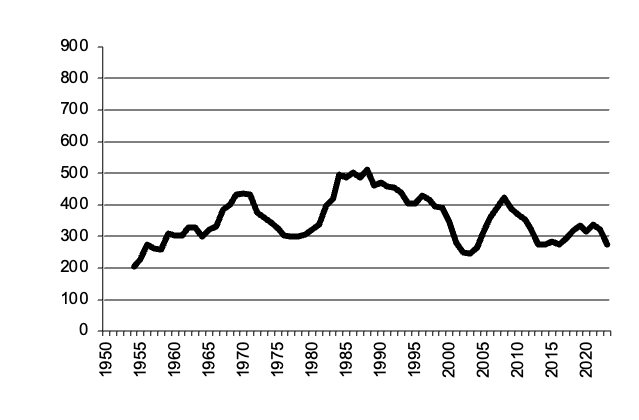
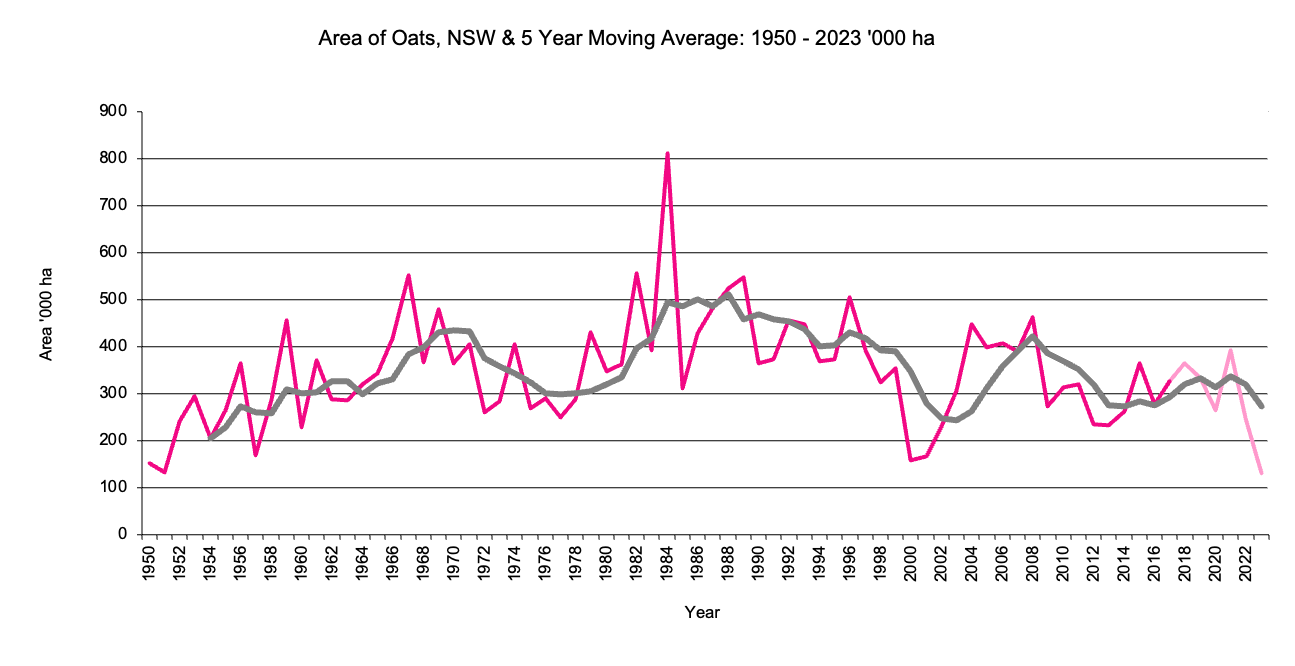
NSW Oats
|
Area of Oats in '000 hectares, 5 year moving average.
|
Return to top of page |
Area of oats has been 400 thousand hectares. The area has fluctuated widely around this level to a peak of 800,000 hectares in 1984 down to 300 thousand hectares in 2011.
Victoria Oats
|
Area of Oats in '000 hectares,5 year moving average. 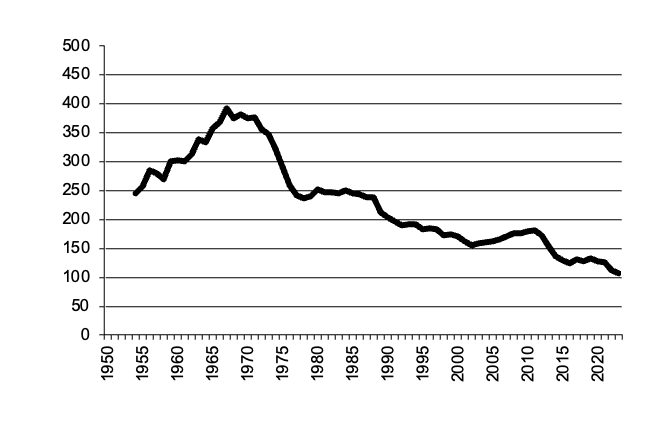
|
Victoria Oats graph |
Return to top of page |
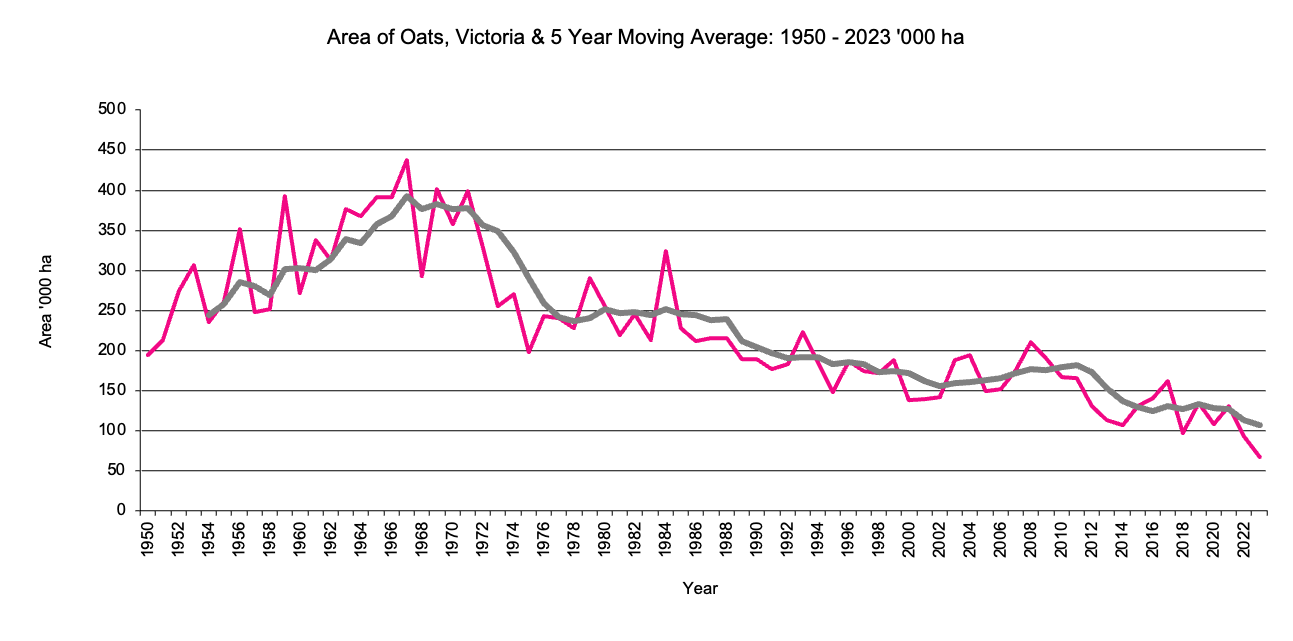
Area of oats is currently less than 50 years ago. The area peaked around 400,000 hectares in 1967 before declining gradually to present levels.
Queensland Oats
|
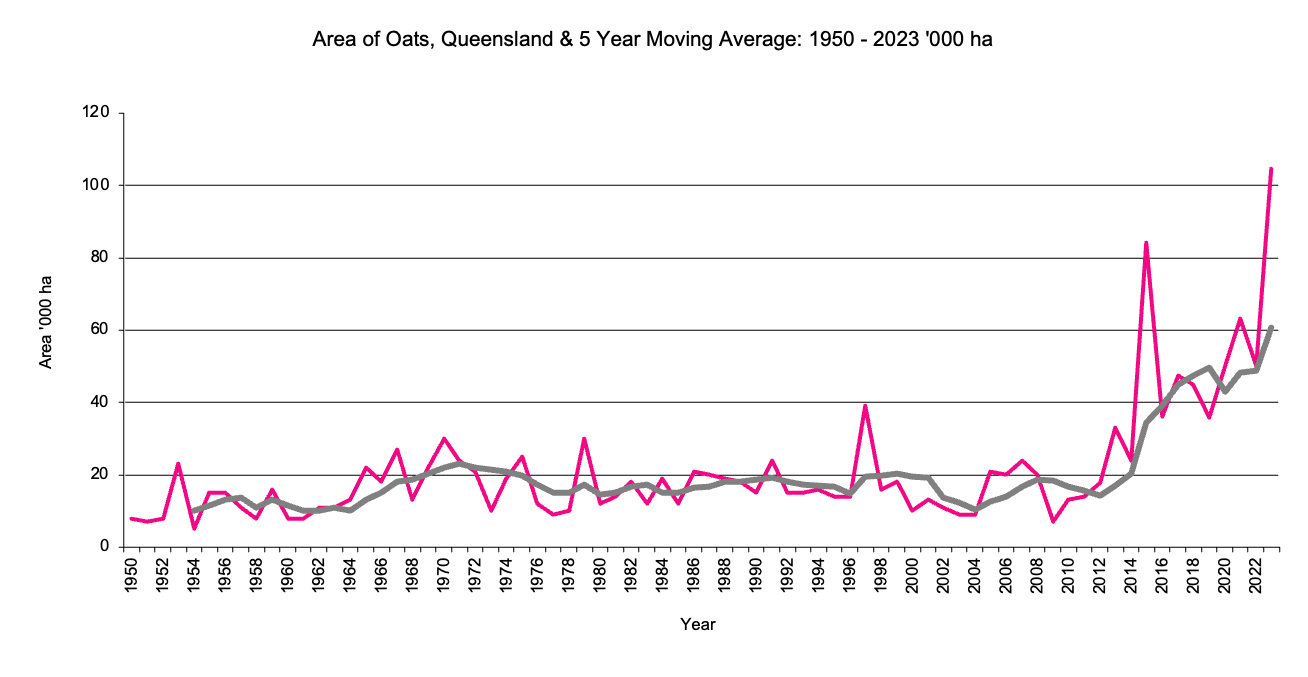
Area of Oats in '000 hectares,5 year moving average. 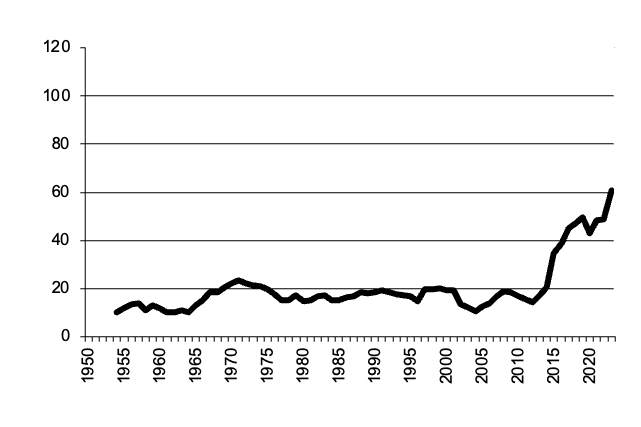
|
Queensland Oats graph |
Return to top of page |
Despite wide fluctuations the area of oats has trended upwards over 50 years.
South Australia Oats
|
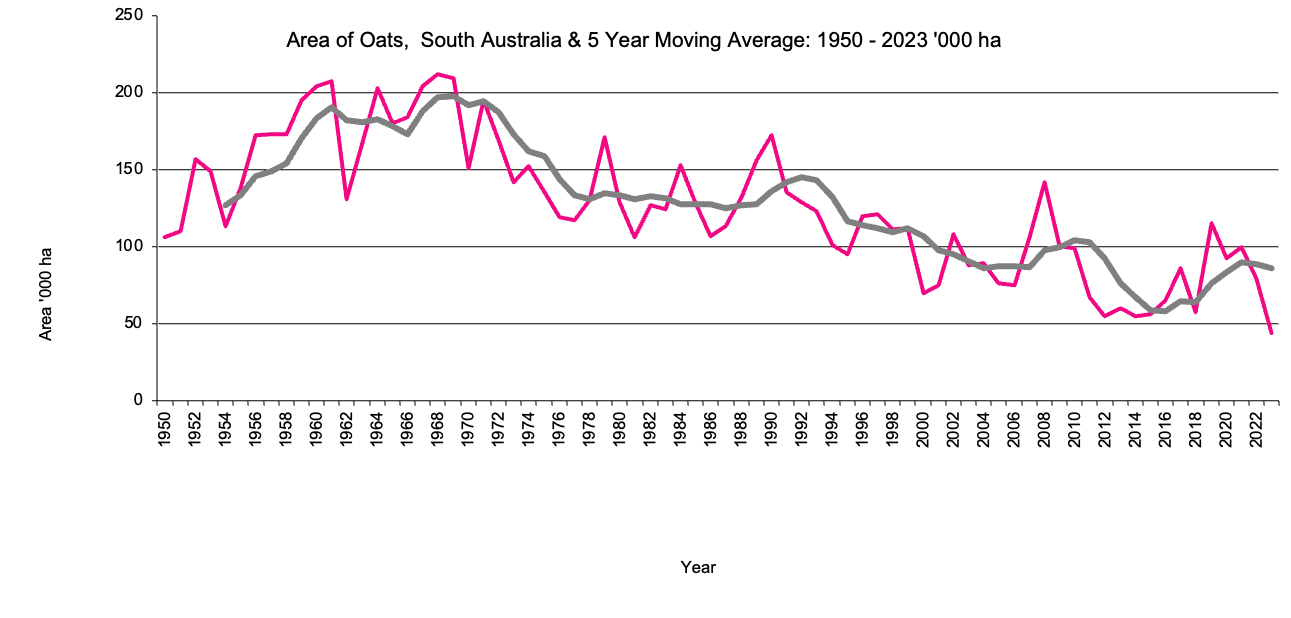
Area of Oats in '000 hectares,5 year moving average. 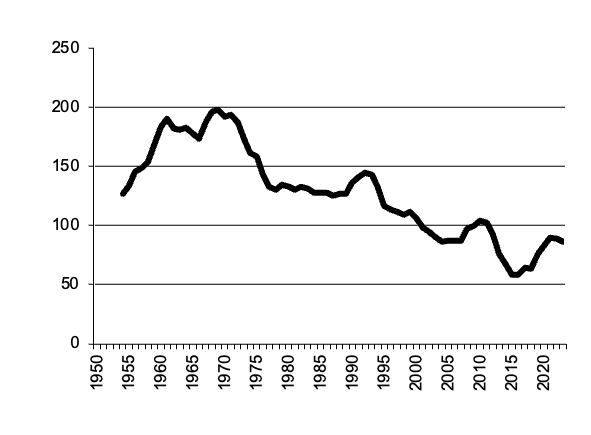
|
South Australia Oats graph |
Return to top of page |
The area of oats ihs trended down since 1950.
Western Australia Oats
|
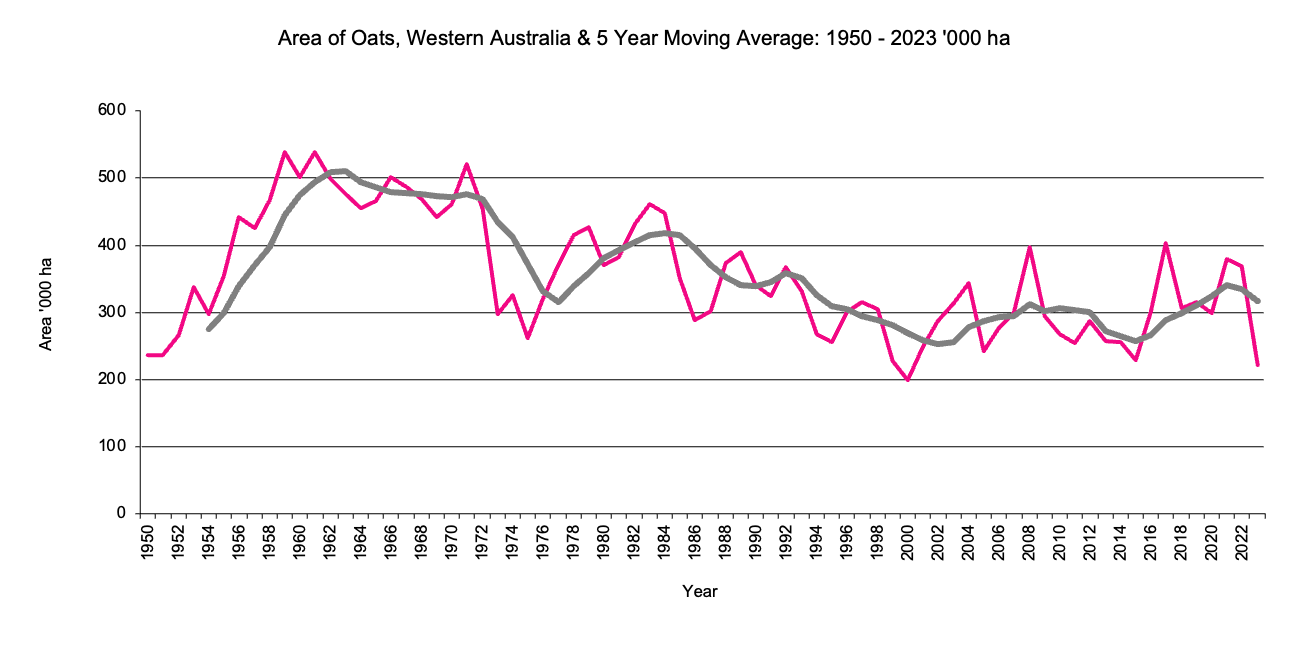
Area of Oats in '000 hectares,5 year moving average. 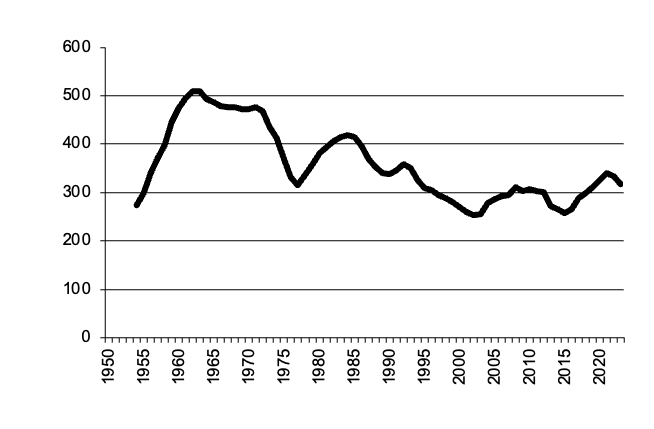
|
Western Australia Oats graph |
Return to top of page |
The area of oats is now around the same as 50 years ago. Oats reached a peak of over twice this level in the early to mid 1960s.
Tasmania Oats
|
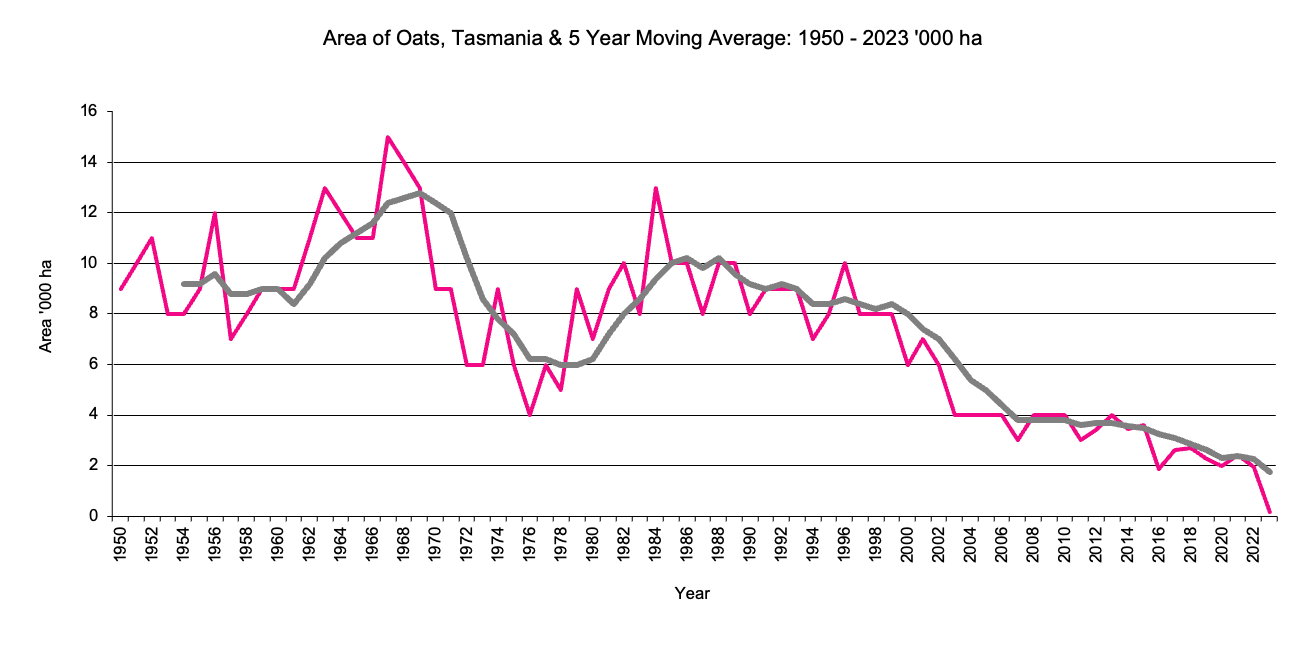
Area of Oats in '000 hectares,5 year moving average. 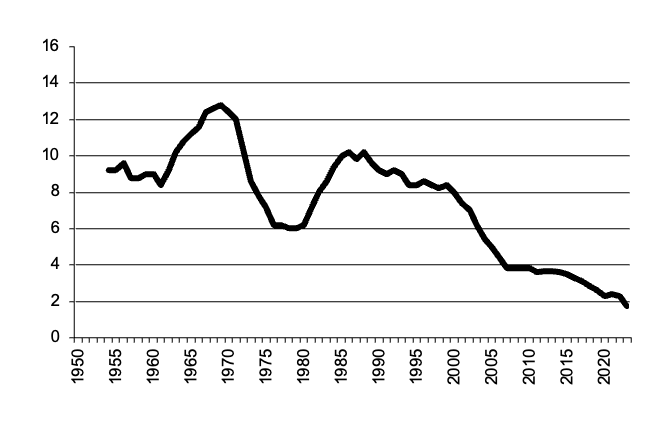
|
Tasmania Oats graph |
Return to top of page |
Tasmania has less than 1% of Australia's oats. The area has fluctuated around 8,000 hectares reaching 15,000 hectares in 1967 and falling to 2,000 hectares.