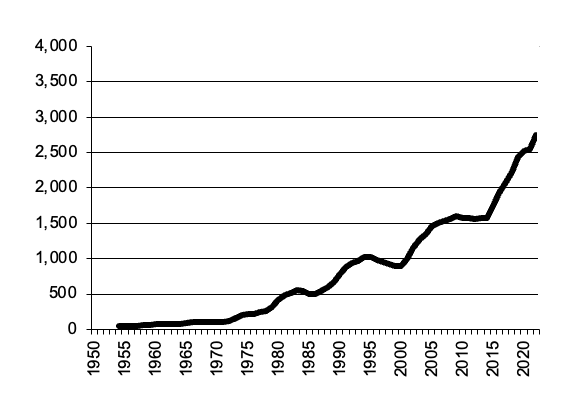
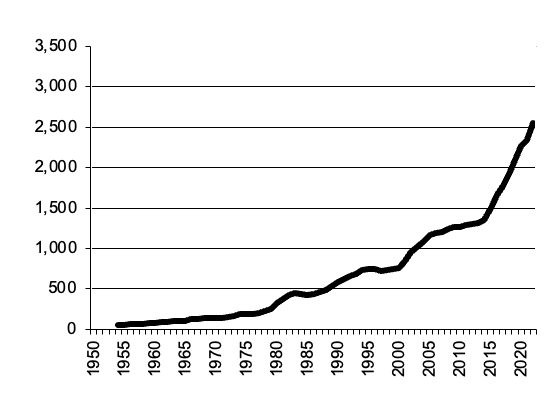
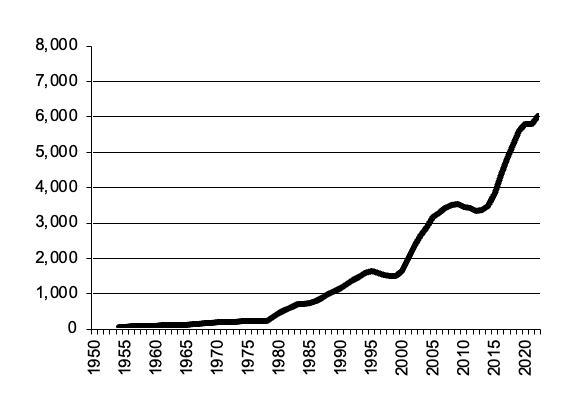
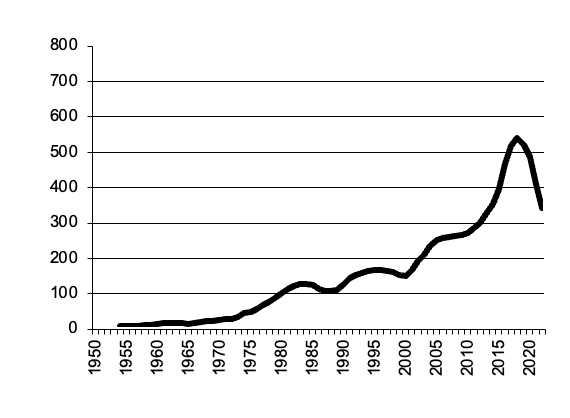
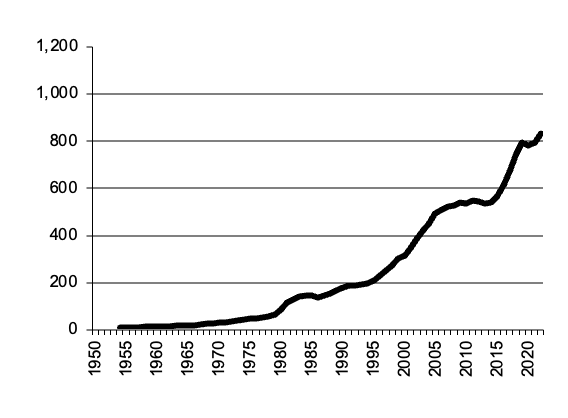
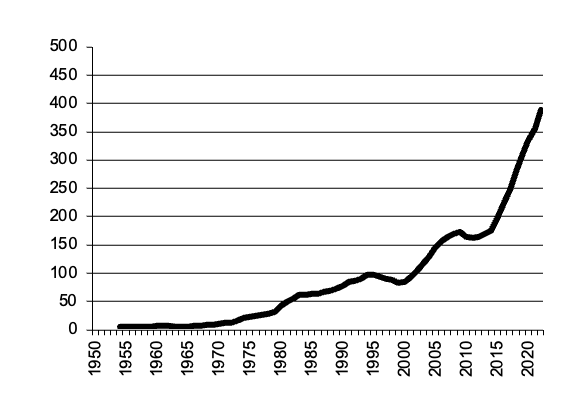
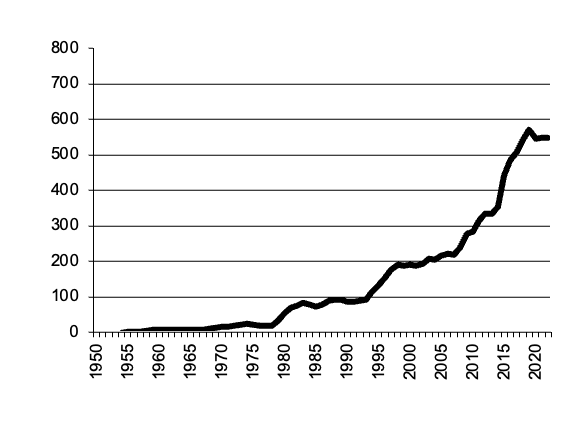
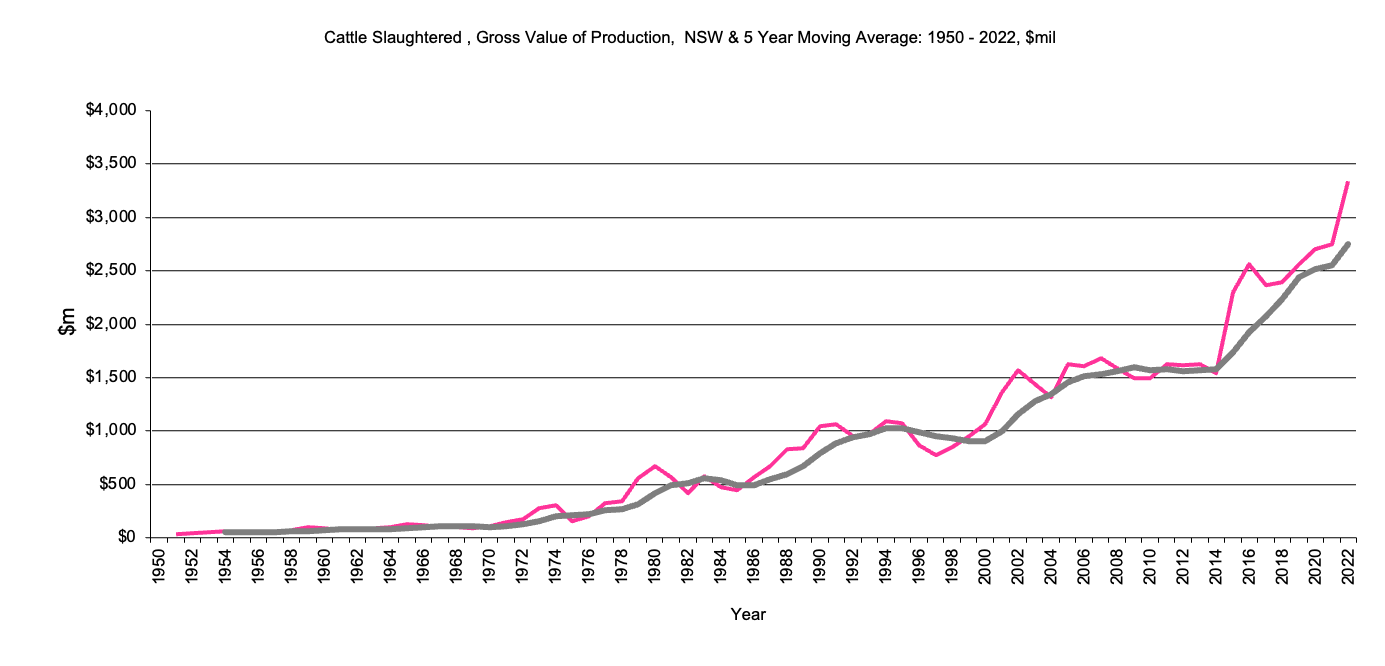
Cattle and calves slaughtered, gross value of production
|
|
NSW, Cattle Slaughtered- Gross Value Production
|
Cattle Slaughtered - Gross Value of production, $m, 5 year moving average
|
NSW Cattle Slaughtered, Gross Value Production graph |
Return to top of page |
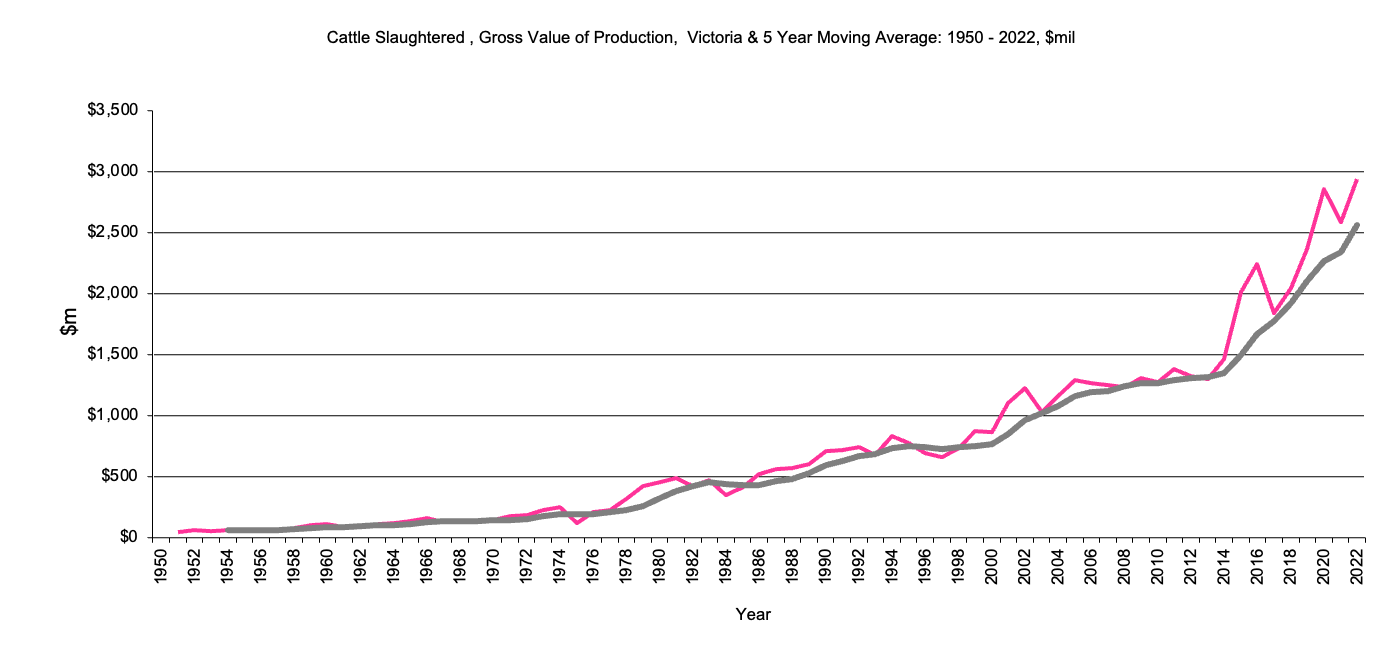
Victoria, Cattle Slaughtered - Gross Value Production
|
Cattle Slaughtered - Gross Value of production, $m, 5 year moving averag
|
Victoria Cattle Slaughtered, Gross Value Production graph |
Return to top of page |
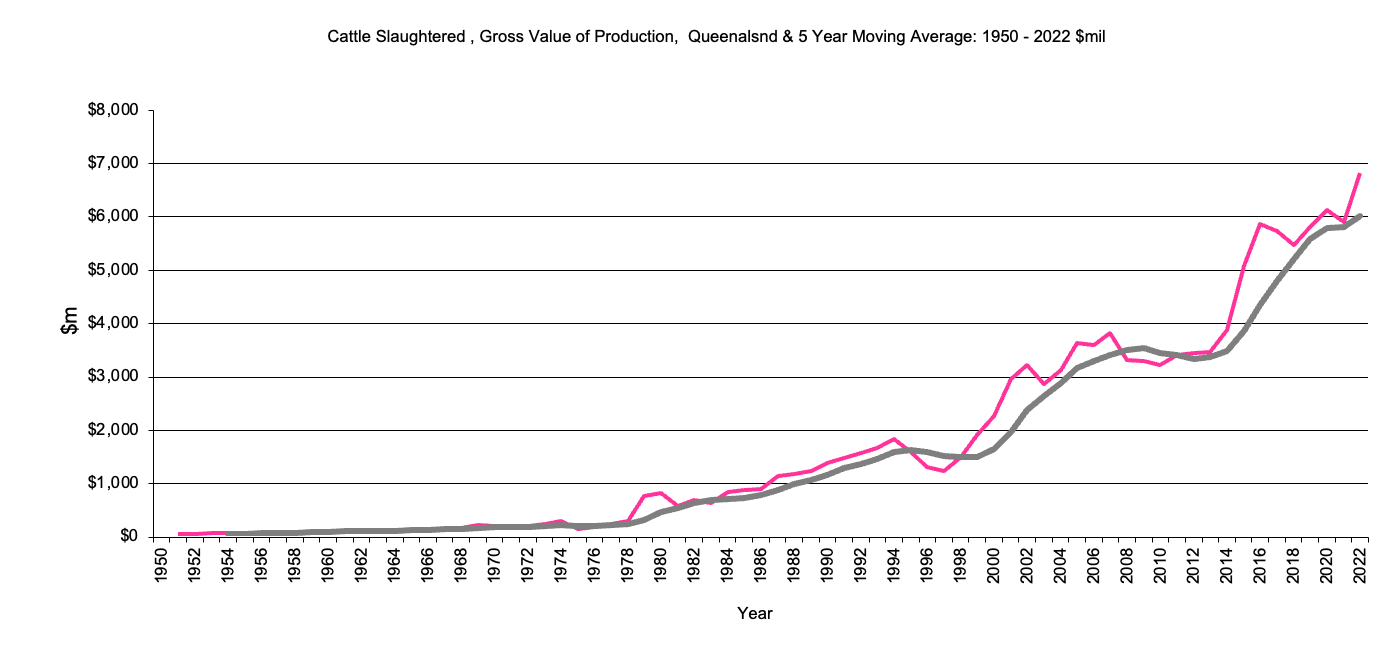
Queensland, Cattle Slaughtered Gross Value Production
|
Cattle Slaughtered - Gross Value of production, $m, 5 year moving averag
|
Queensland Cattle Slaughtered, Gross Value Production graph |
Return to top of page |
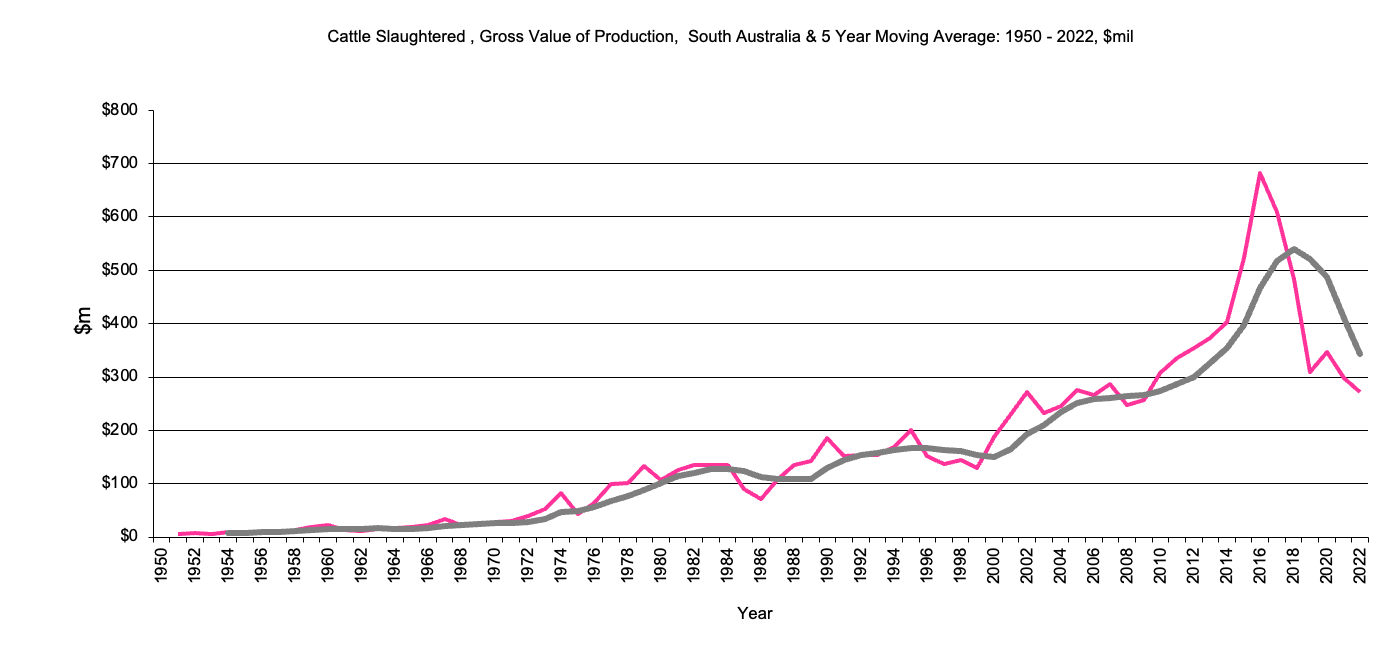
South Australia, Cattle Slaughtered Gross Value Production
|
Cattle Slaughtered - Gross Value of production, $m, 5 year moving averag
|
South Australia Cattle Slaughtered, Gross Value Production graph |
Return to top of page |
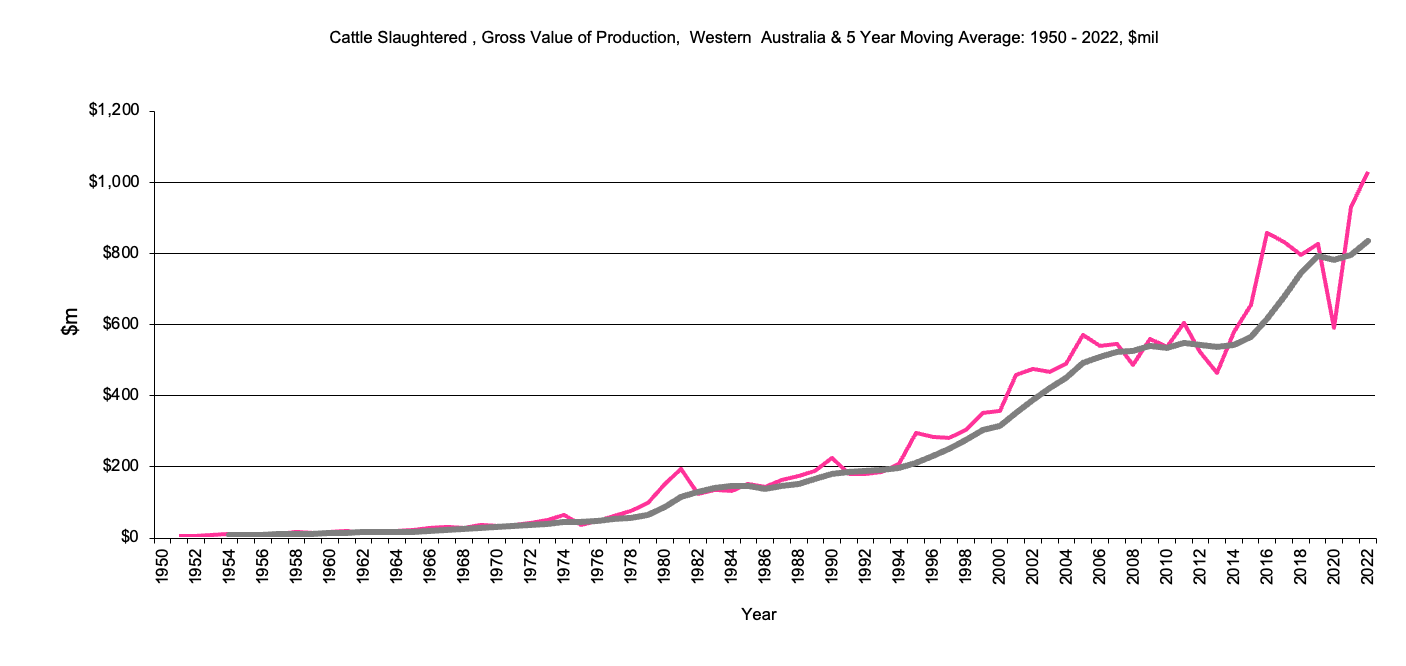
Western Australia, Cattle Slaughtered Gross Value Production
|
Cattle Slaughtered - Gross Value of production, $m, 5 year moving averag
|
Western Australia Cattle Slaughtered, Gross Value Production graph |
Return to top of page |
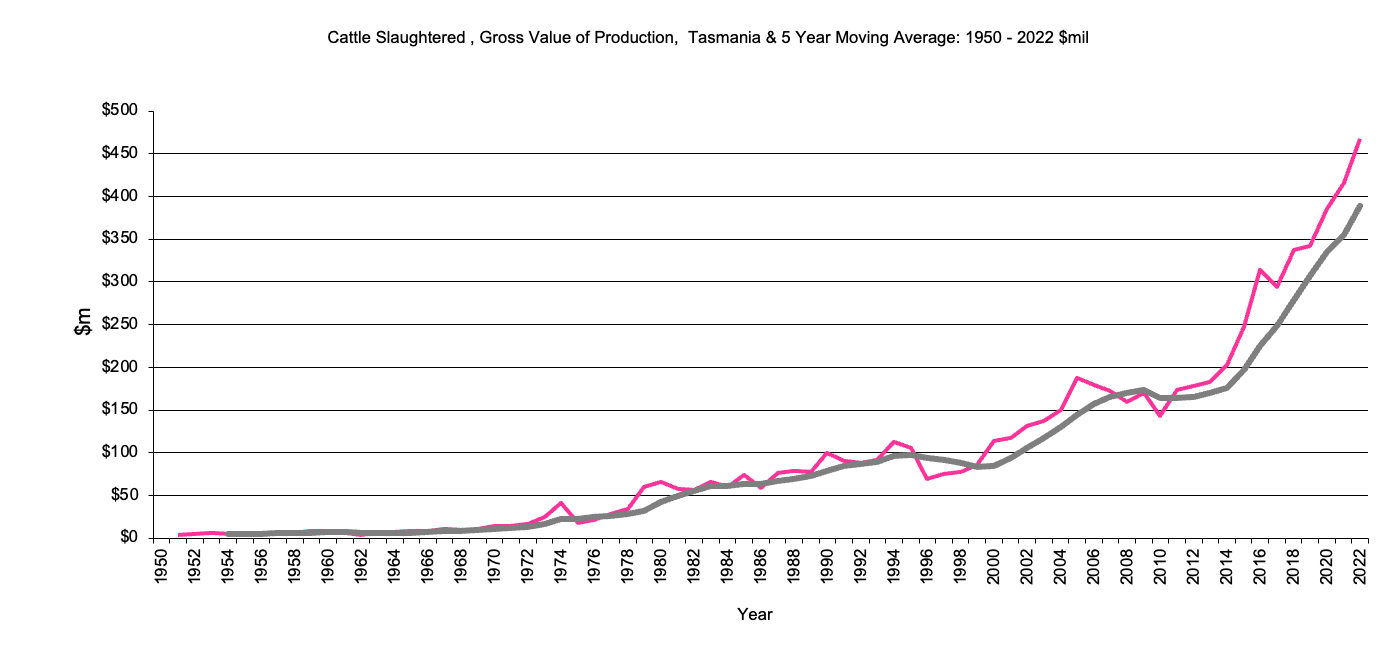
Tasmania, Cattle Slaughtered Gross Value Production
|
Cattle Slaughtered - Gross Value of production, $m, 5 year moving averag
|
Tasmania Cattle Slaughtered , Gross Value Production graph |
Return to top of page |
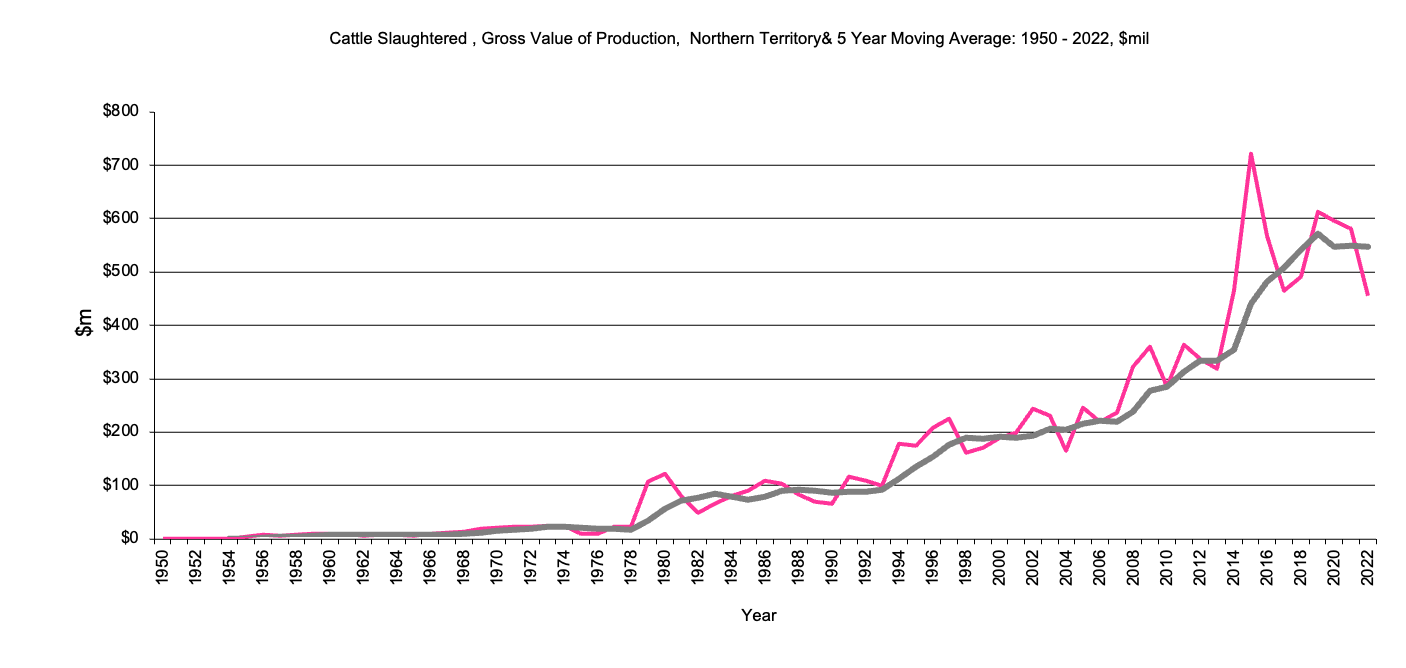
Northern Territory, Cattle Slaughtered Gross Value Production
|
Cattle Slaughtered - Gross Value of production, $m, 5 year moving averag
|
Northern Territory Cattle Slaughtered, Gross Value Production graph |
Return to top of page |