Agricultural Data For Australia, Gross Value of Production
1950 to Current Data
Introduction
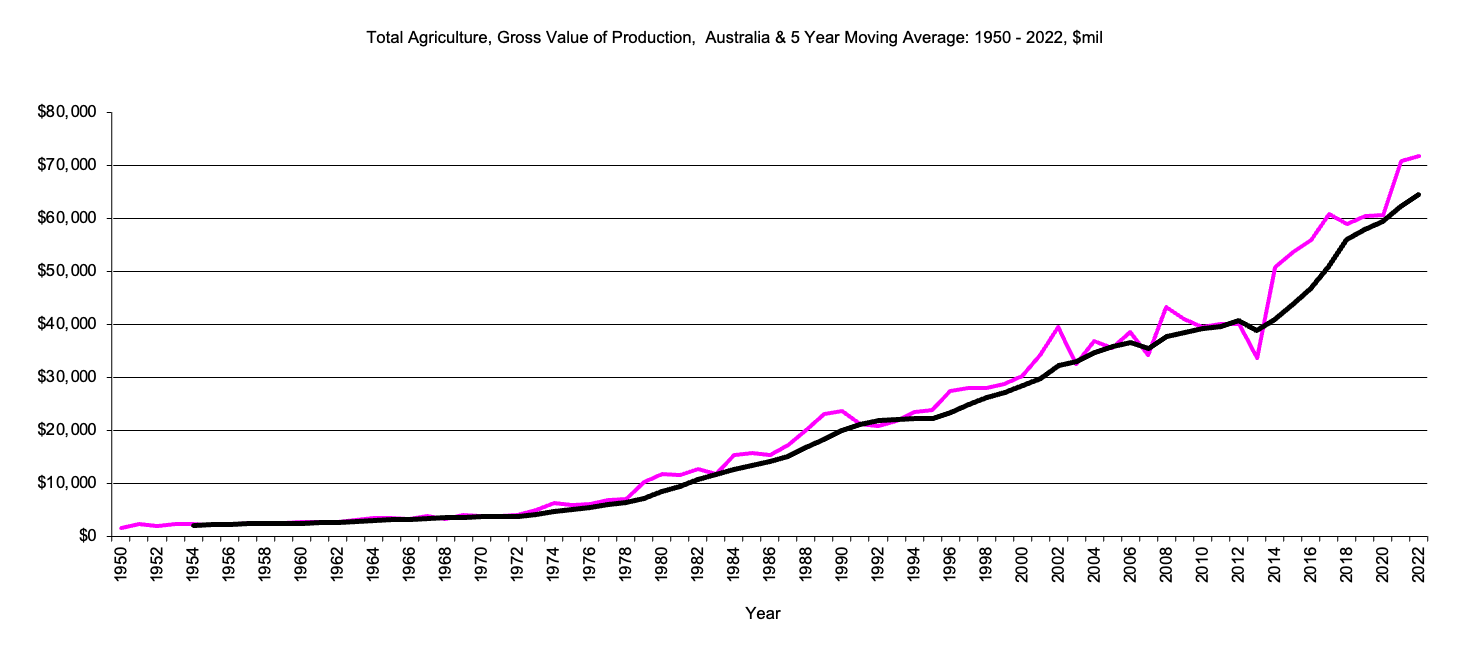
This page has data for all agriculture; ie crops and livestock combined, from 1950 to the present and the 5 year moving average.
Data for each state is also available. To see data by state, follow the link to state data.
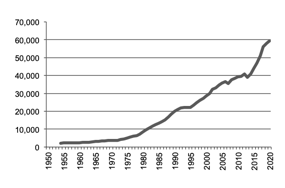
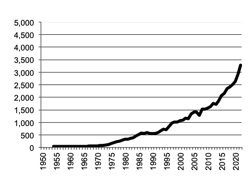
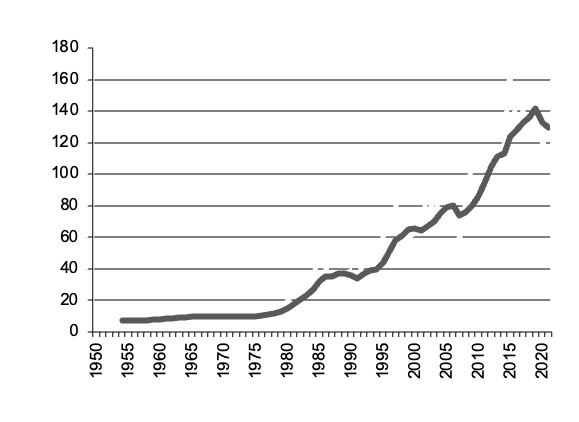
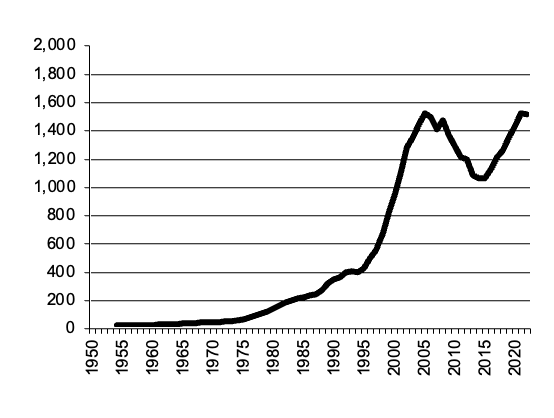
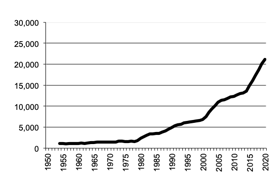
Total Agriculture
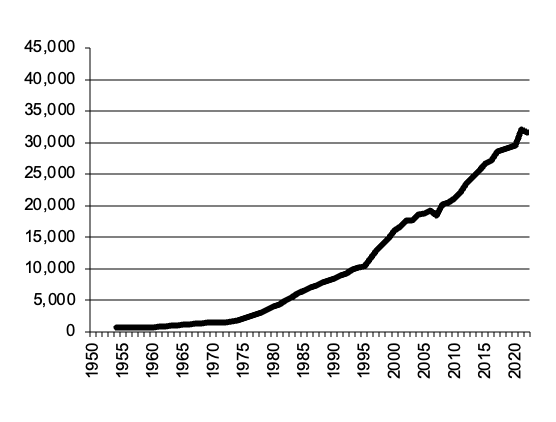
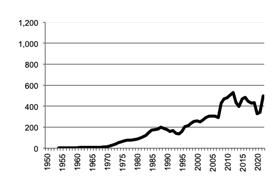
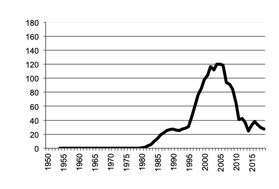
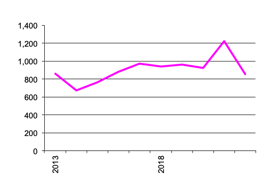
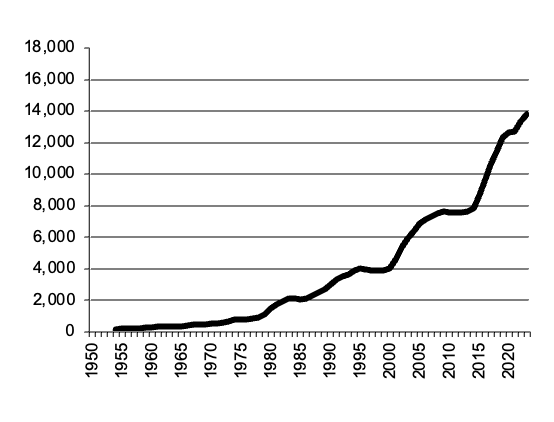
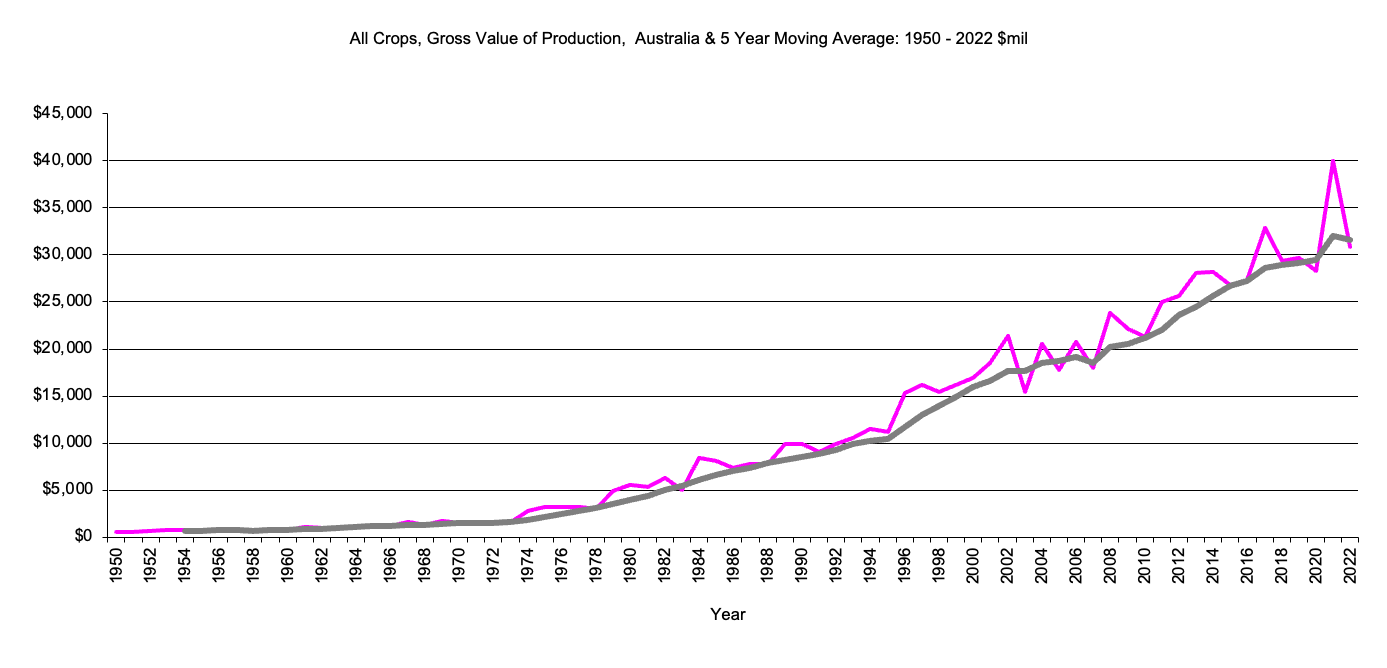
Crops Gross Value Production
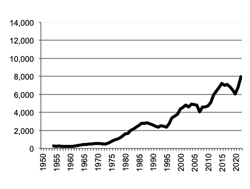
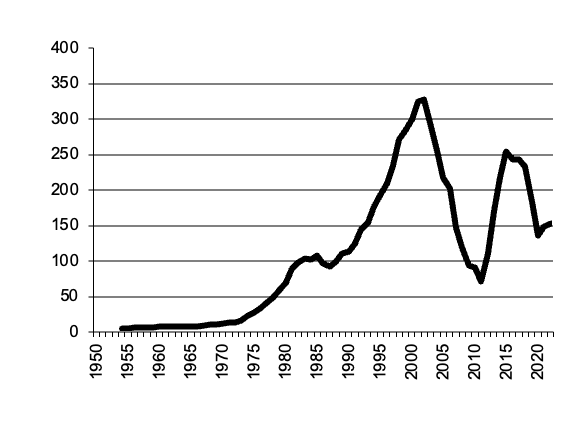
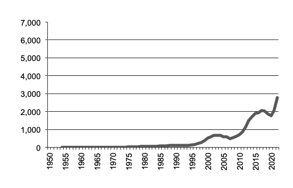
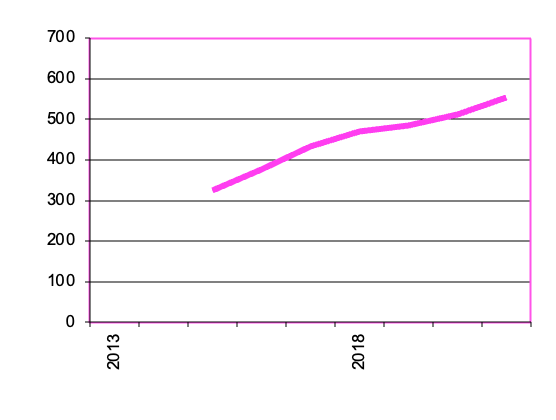
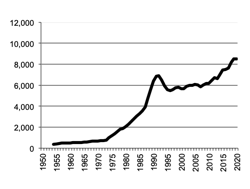
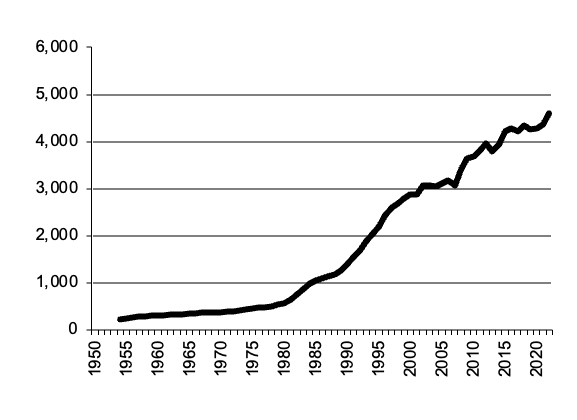
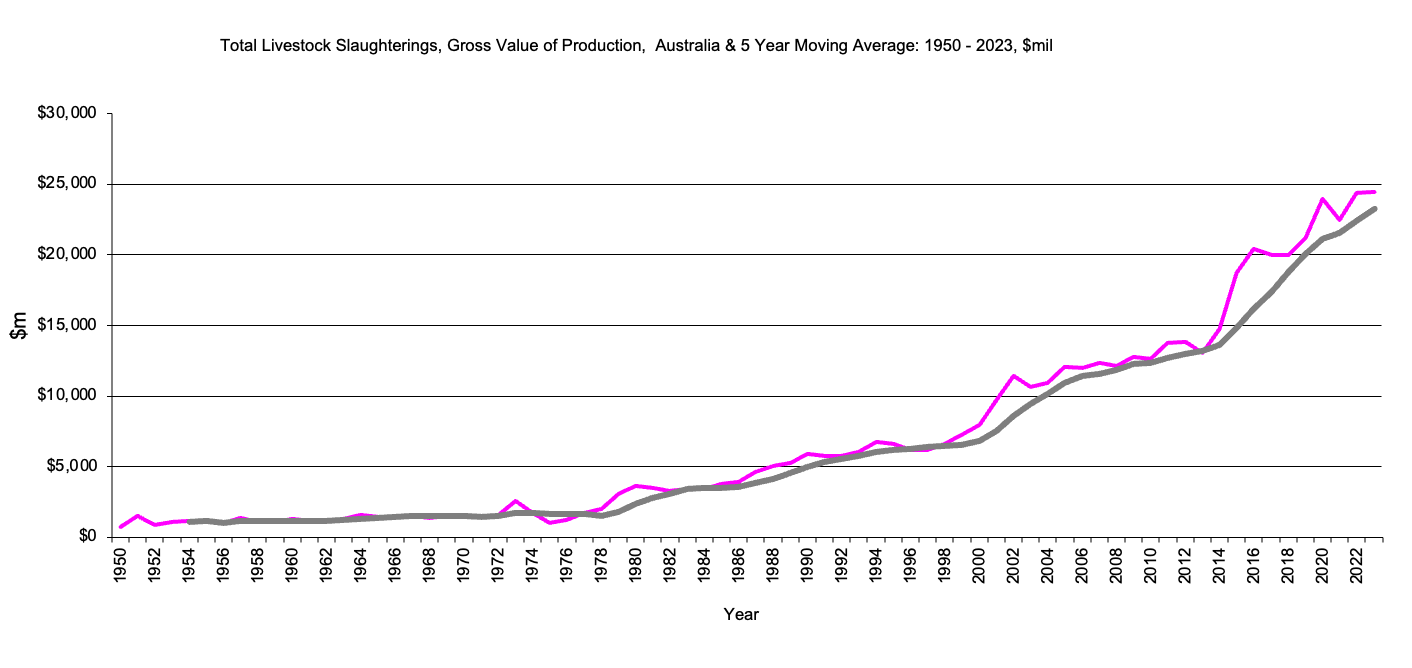
Livestock Slaughtered Gross Value Production
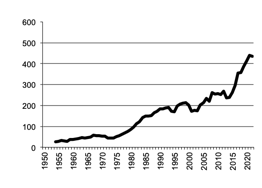
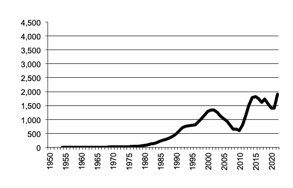
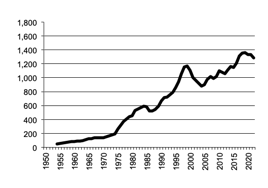
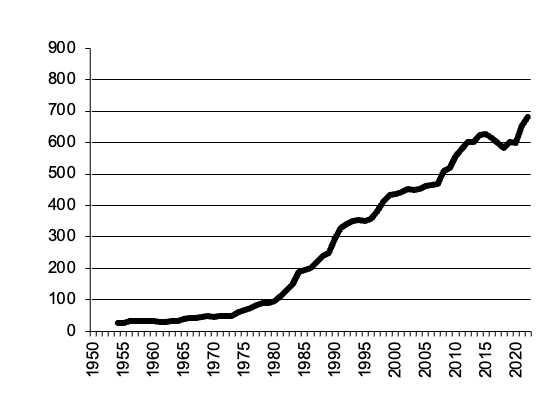
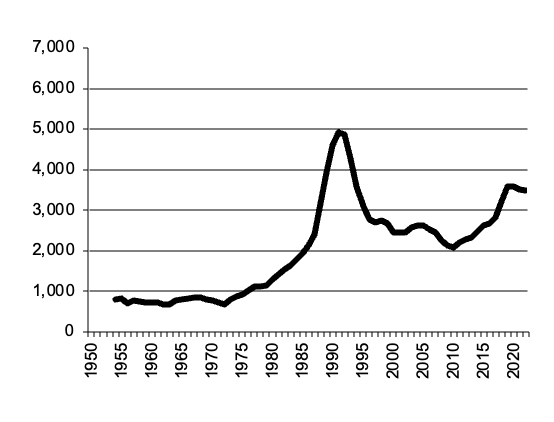
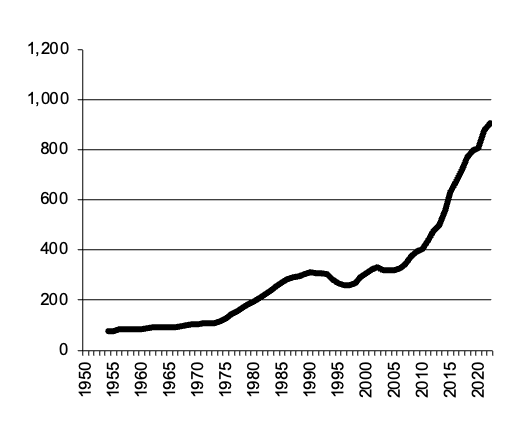
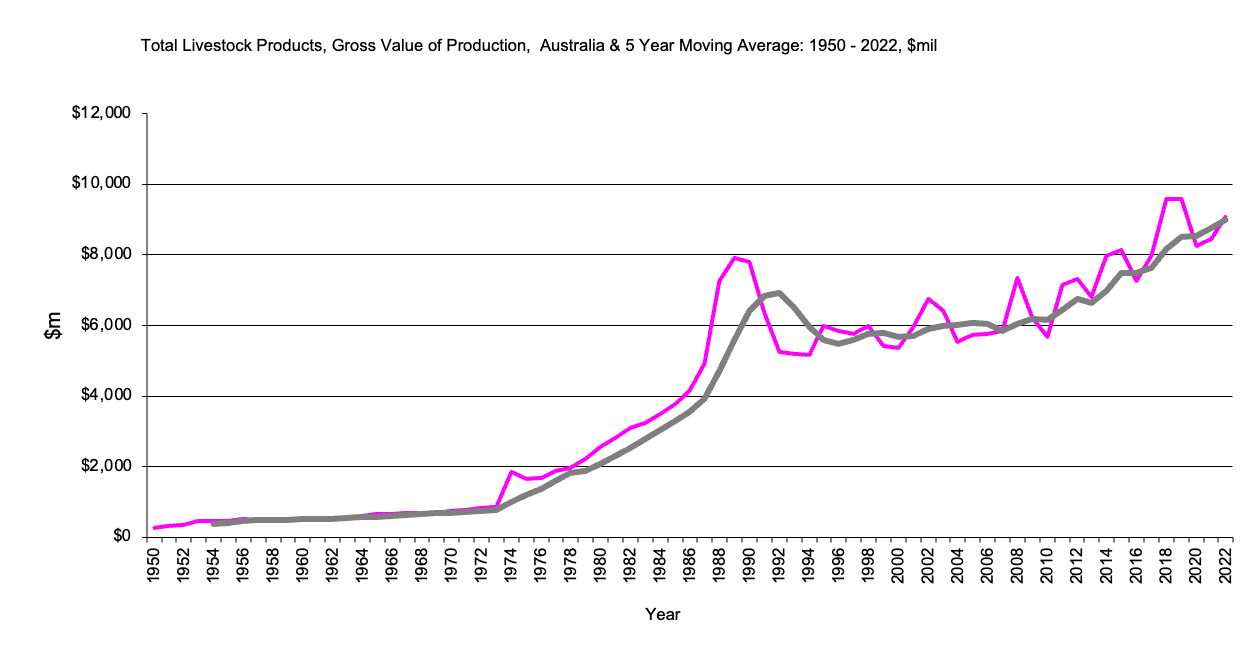
Livestock Products
Total Agriculture Gross Value of Production
Gross Value Production- All Crops
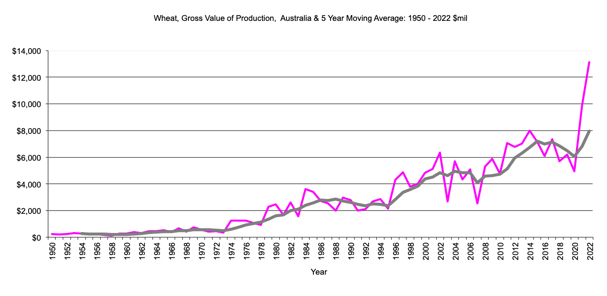
Gross Value Production- Wheat
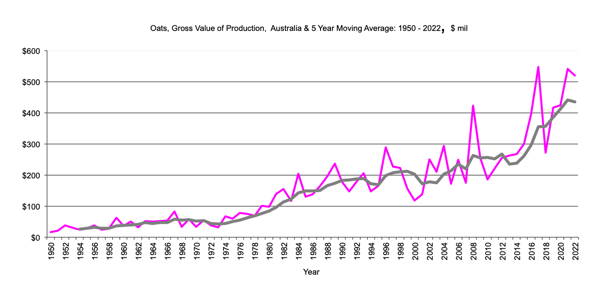
Gross Value Production- Oats
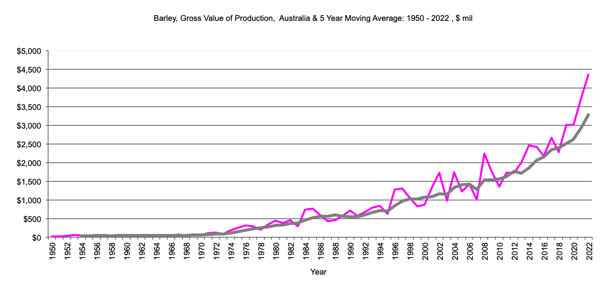
Gross Value Production- Barley
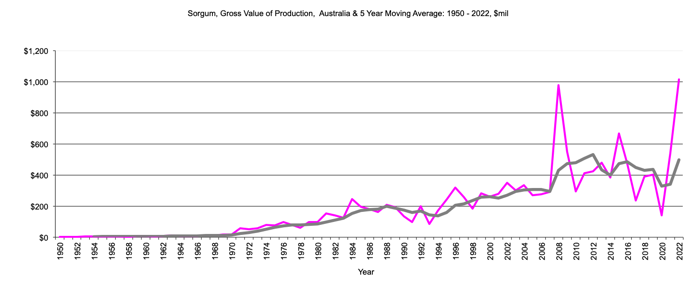
Gross Value Production- Sorghum
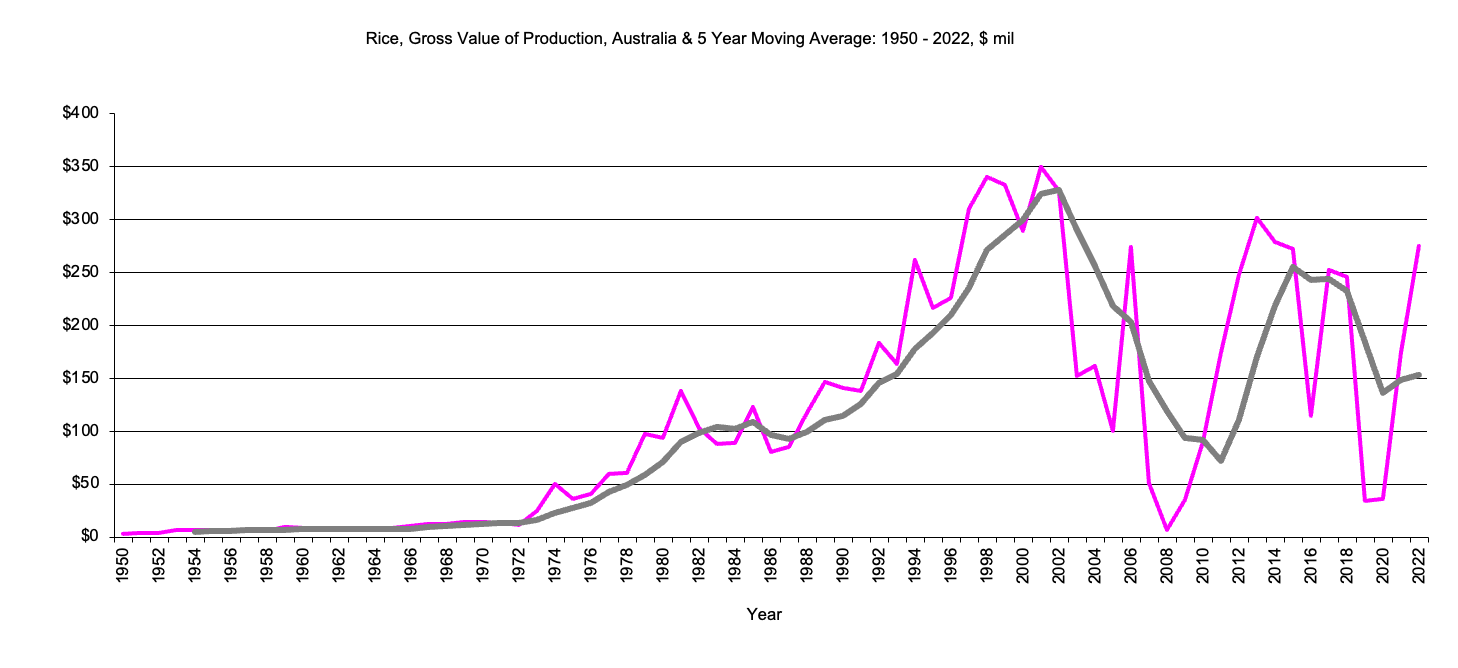
Gross Value Production- Rice
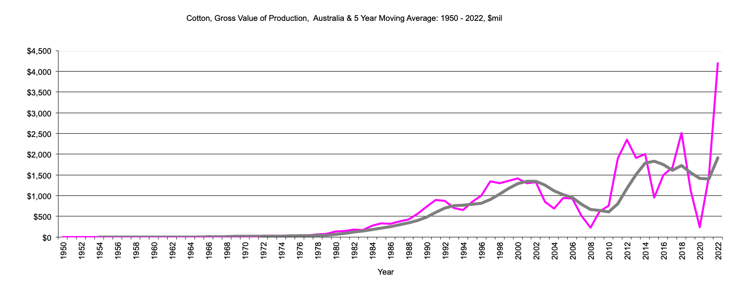
Gross Value Production- Cotton
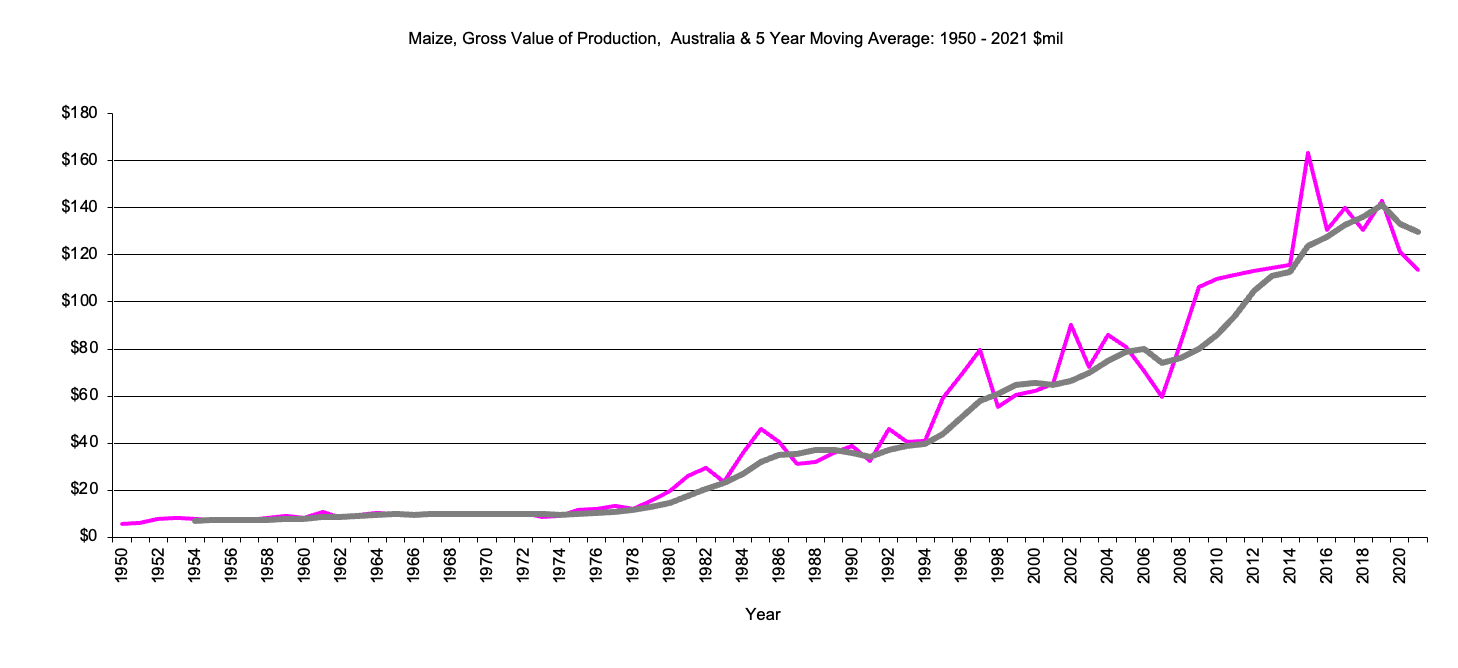
Gross Value Production- Maize
Gross Value Production- Triticale
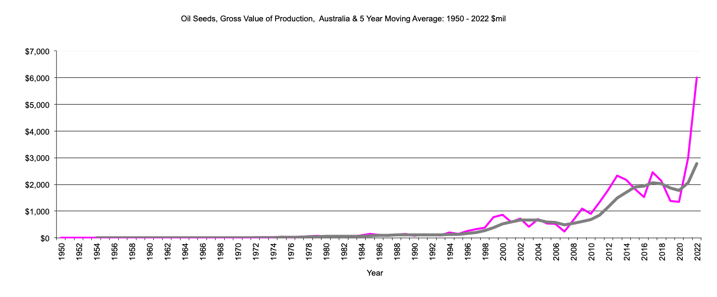
Gross Value Production- Oil Seeds
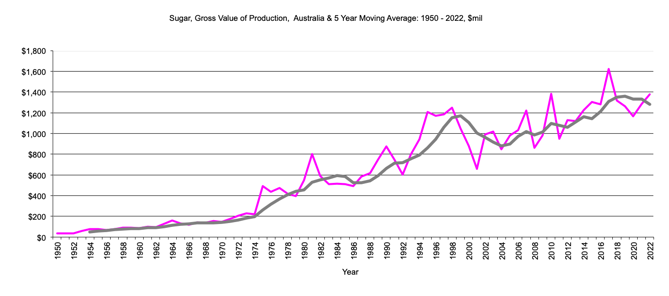
Gross Value Production- Sugar
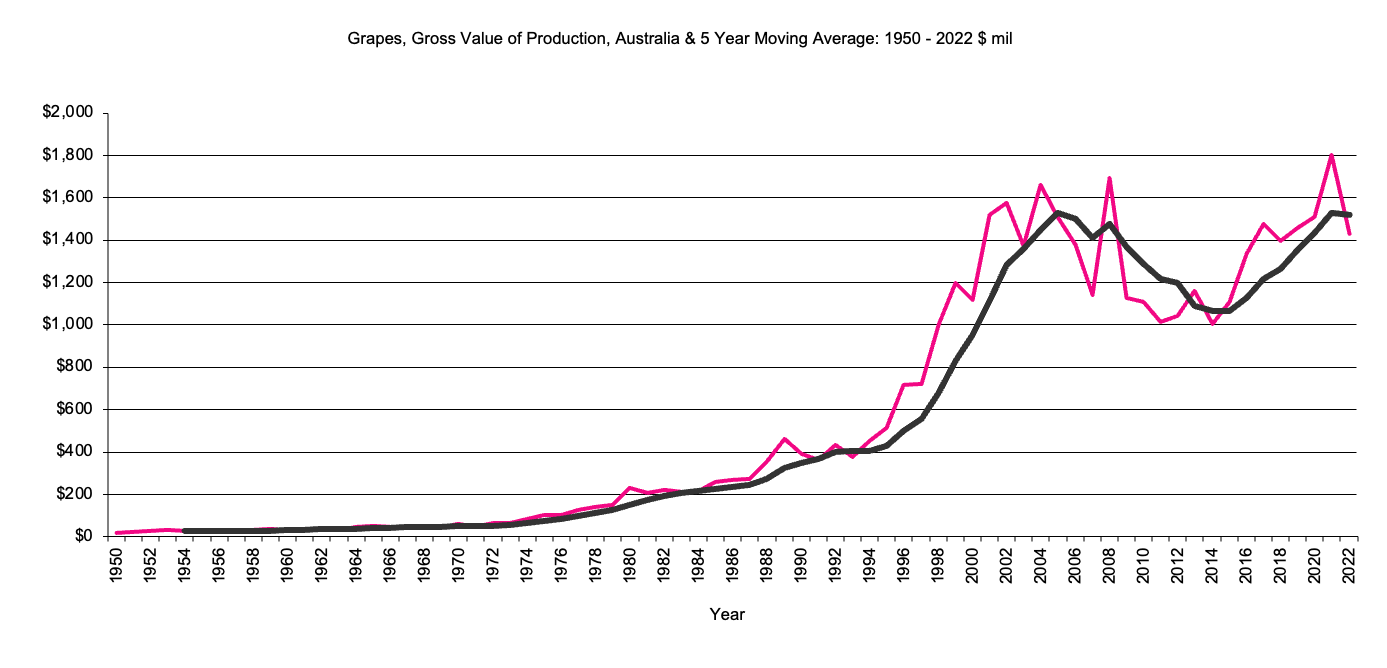
Gross Value Production- Grapes
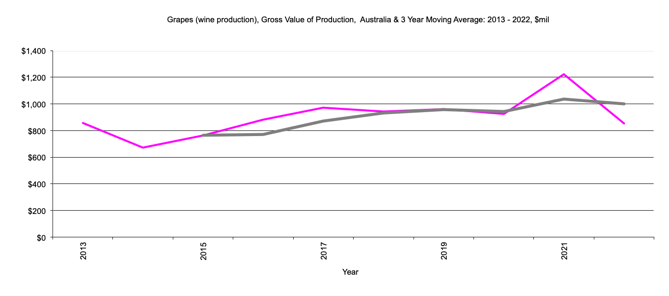
Gross Value Production- Grapes for Wine
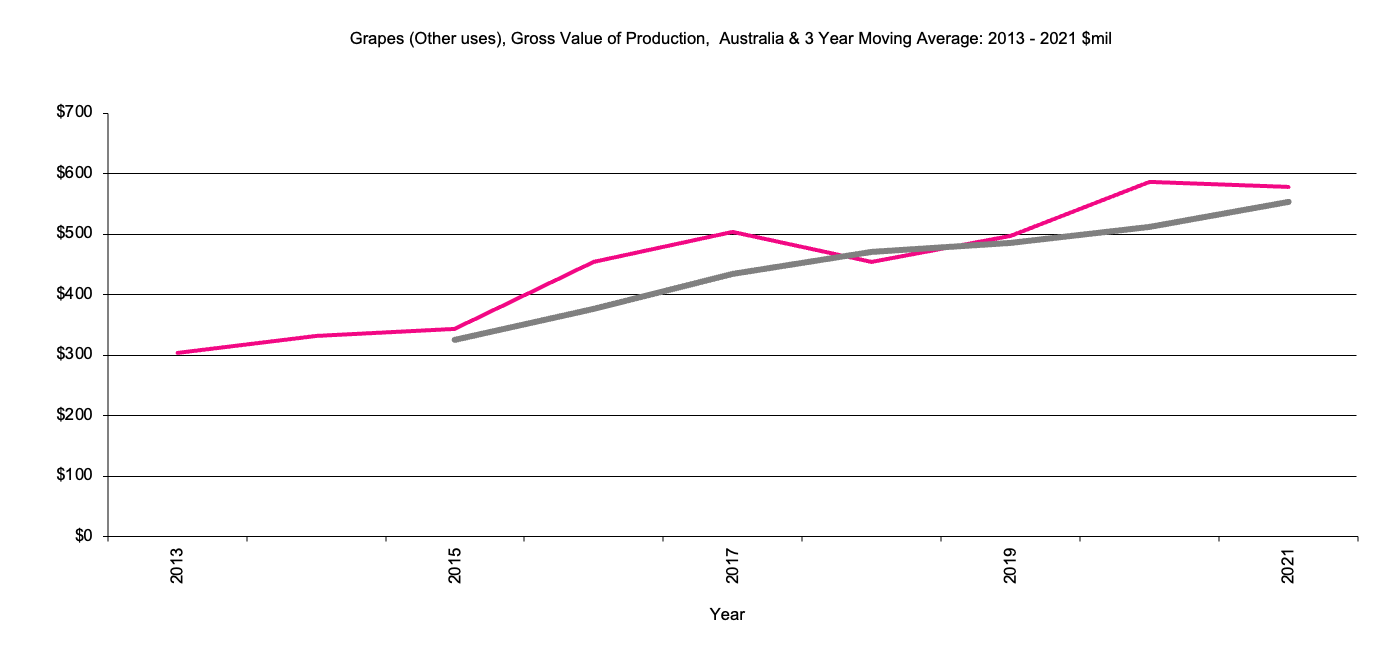
Gross Value Production- Grapes Other
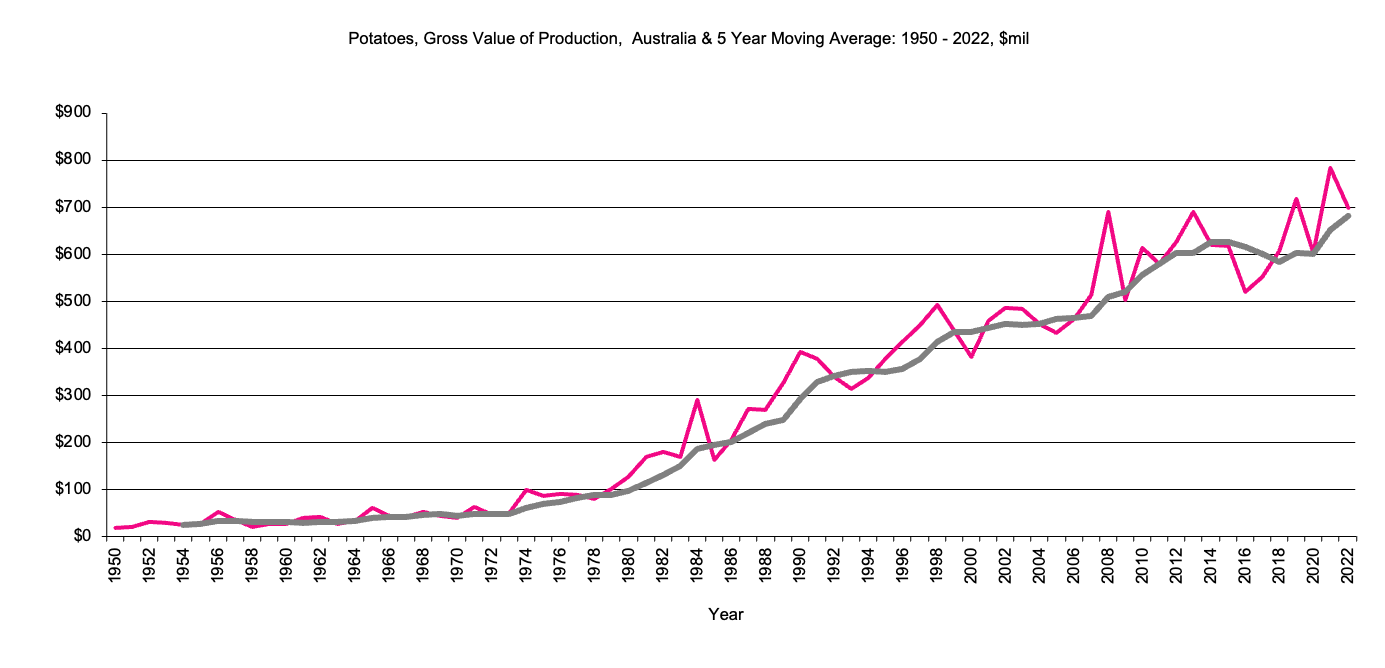
Gross Value Production- Potatoes
Total Livestock Slaughtered - Gross Value Production
Sheep and Lambs slaughtered - Gross Value Production
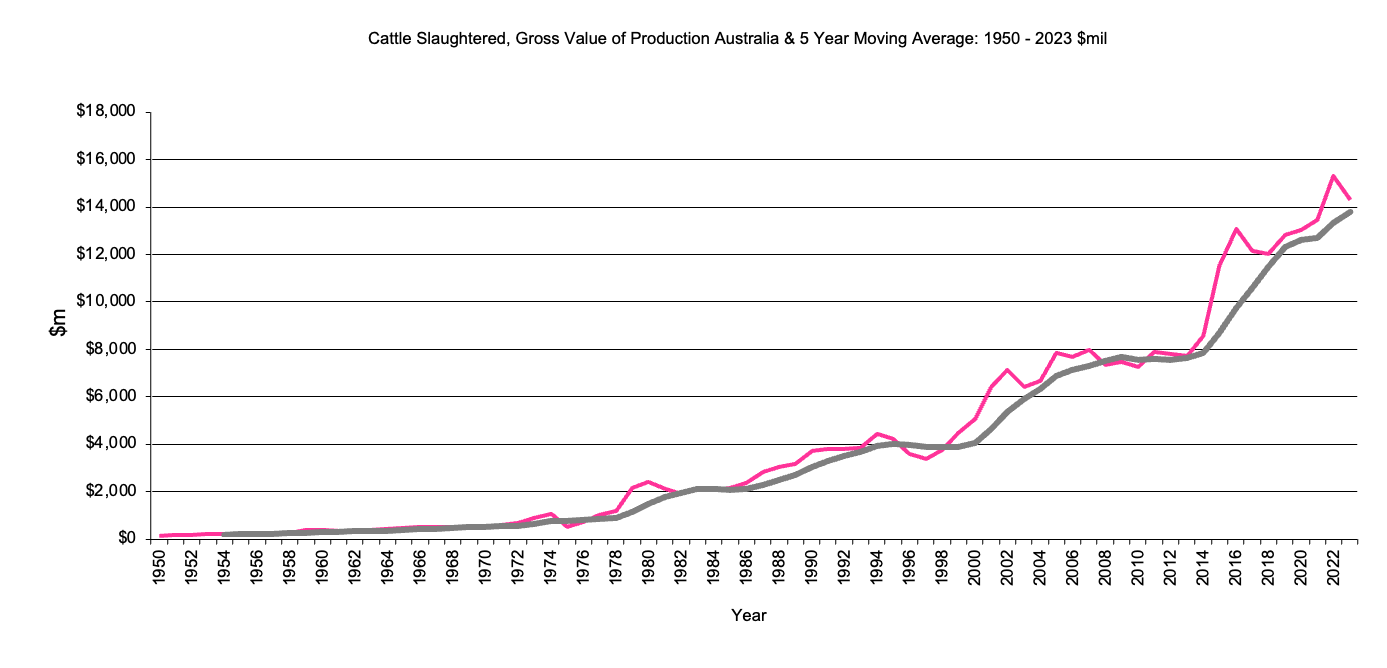
Gross Value Production- Cattle & Calves slaughtered
Total Livestock Products - Gross Value Production
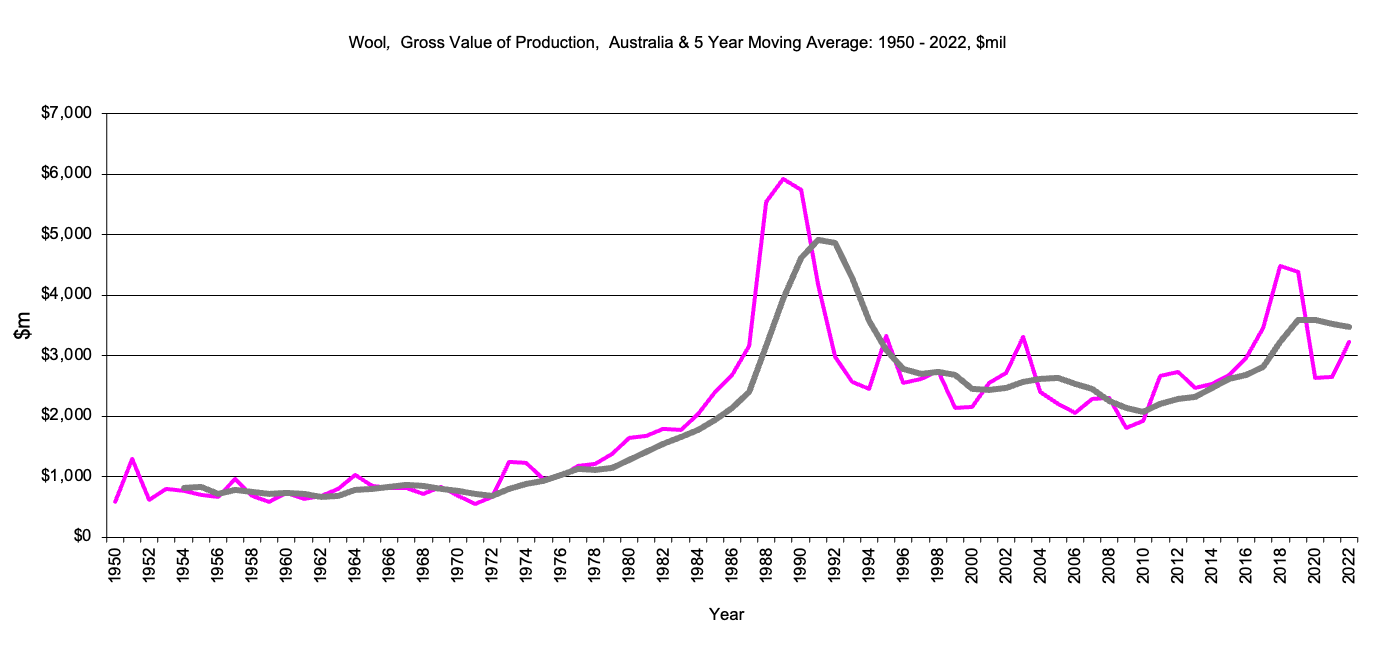
Gross Value Production- Wool
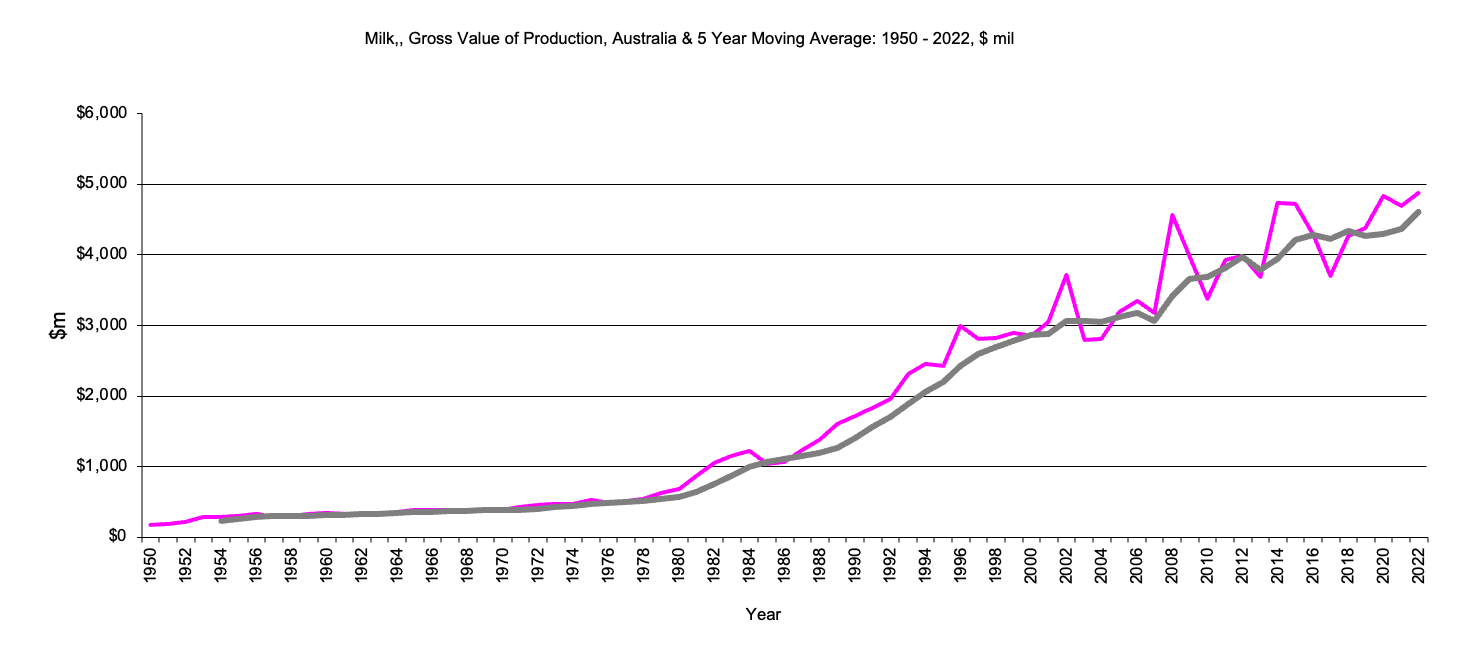
Gross Value Production- Milk
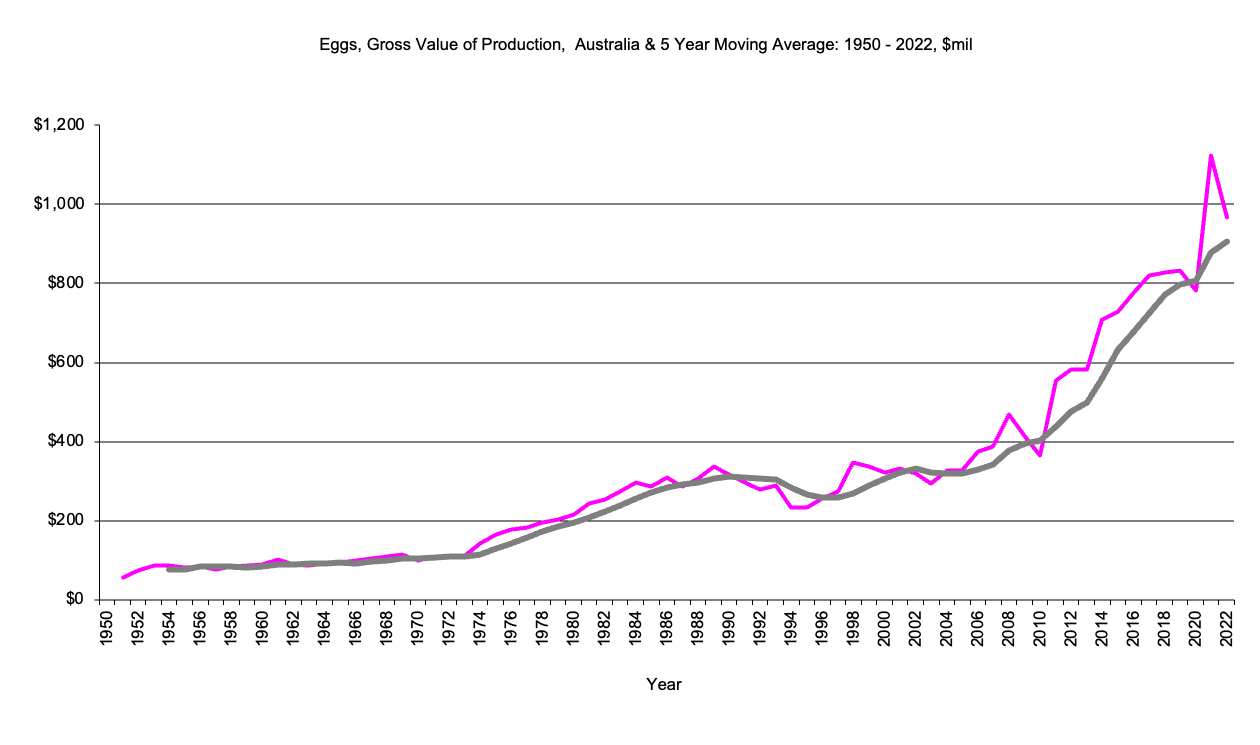
Gross Value Production- Eggs
AgEc Data
Last Updated 25 April 2024
Site prepared by Bob Cason (rgcason@webone.com.au)Email
for more information
