5 year moving average
NSW Total Livestock Slaughtered
Gross Value Production graph
NSW Total Livestock Slaughtered
Gross Value Production data
Return to top of page
Back to Gross Value Production
Back to front page
Livestock slaughtered, gross value of production
|
|
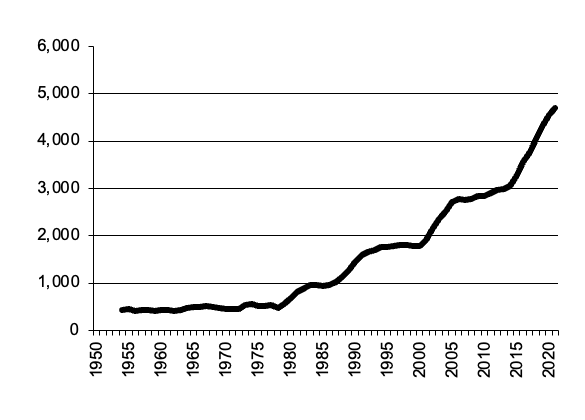
NSW, Total Livestock Slaughtered - Gross Value Production
|
Total Livestock Slaughtered - Gross Value of production, $m, 5 year moving average
|
NSW Total Livestock Slaughtered |
Return to top of page |
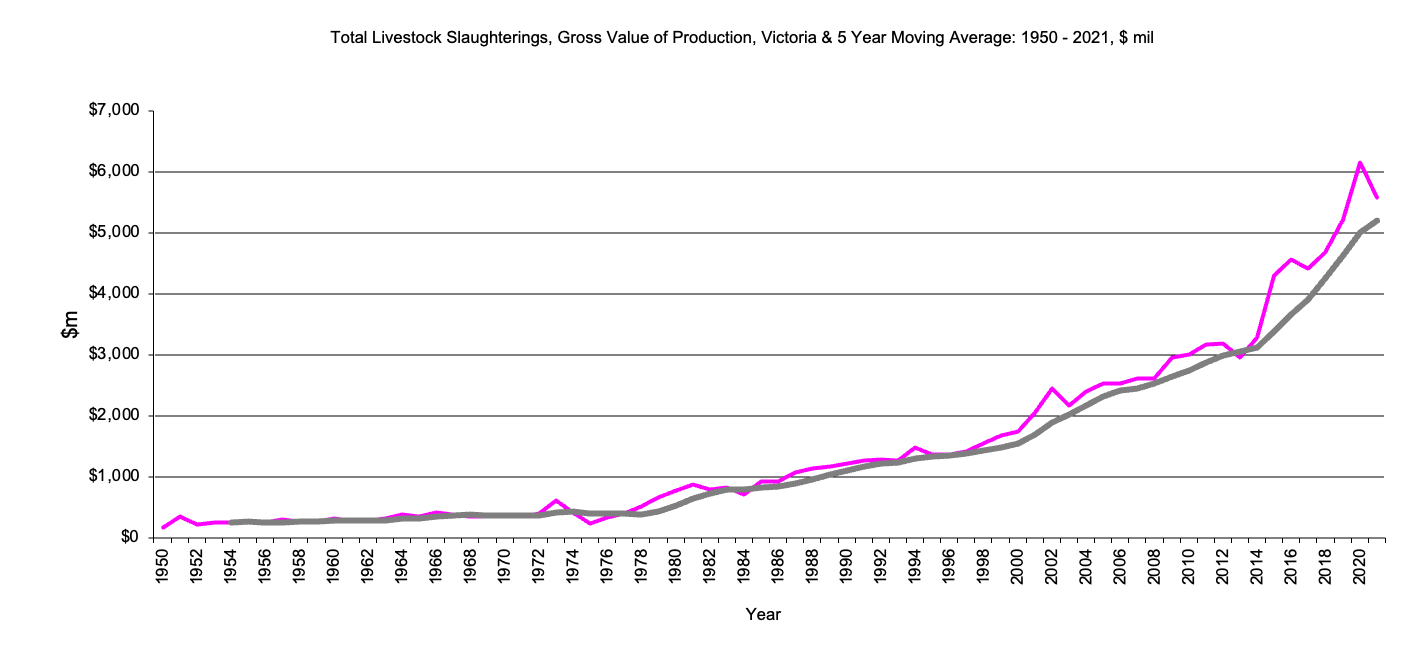
Victoria, Total Livestock Slaughtered - Gross Value Production
|
Total Livestock Slaughtered - Gross Value of production, $m, 5 year moving average 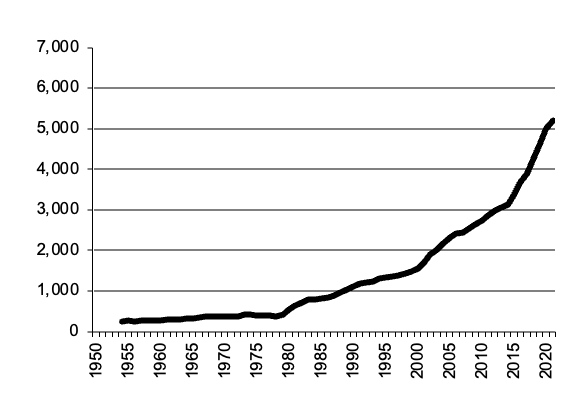
|
Victoria Total Livestock Slaughtered |
Return to top of page |
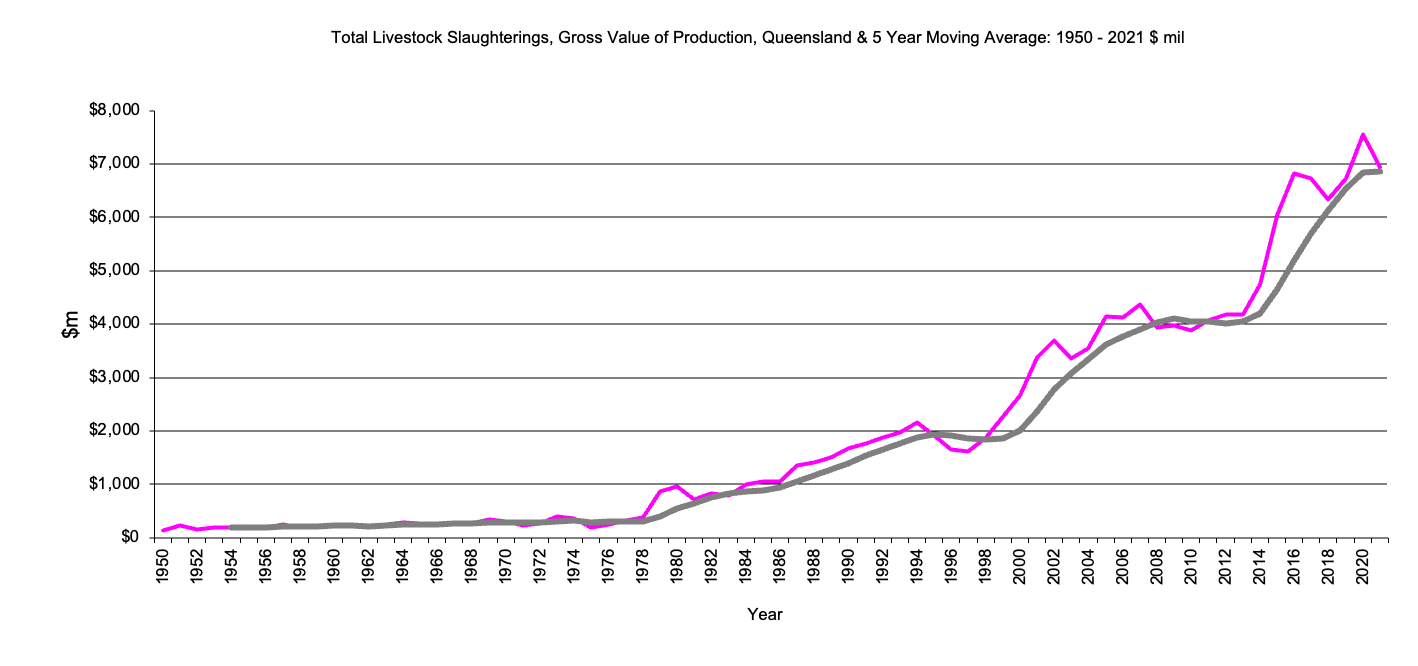
Queensland , Total Livestock Slaughtered - Gross Value Production
|
Total Livestock Slaughtered - Gross Value of production, $m 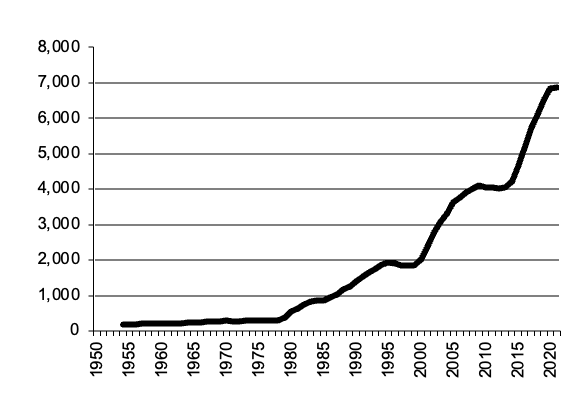
|
Queensland Total Livestock Slaughtered |
Return to top of page |
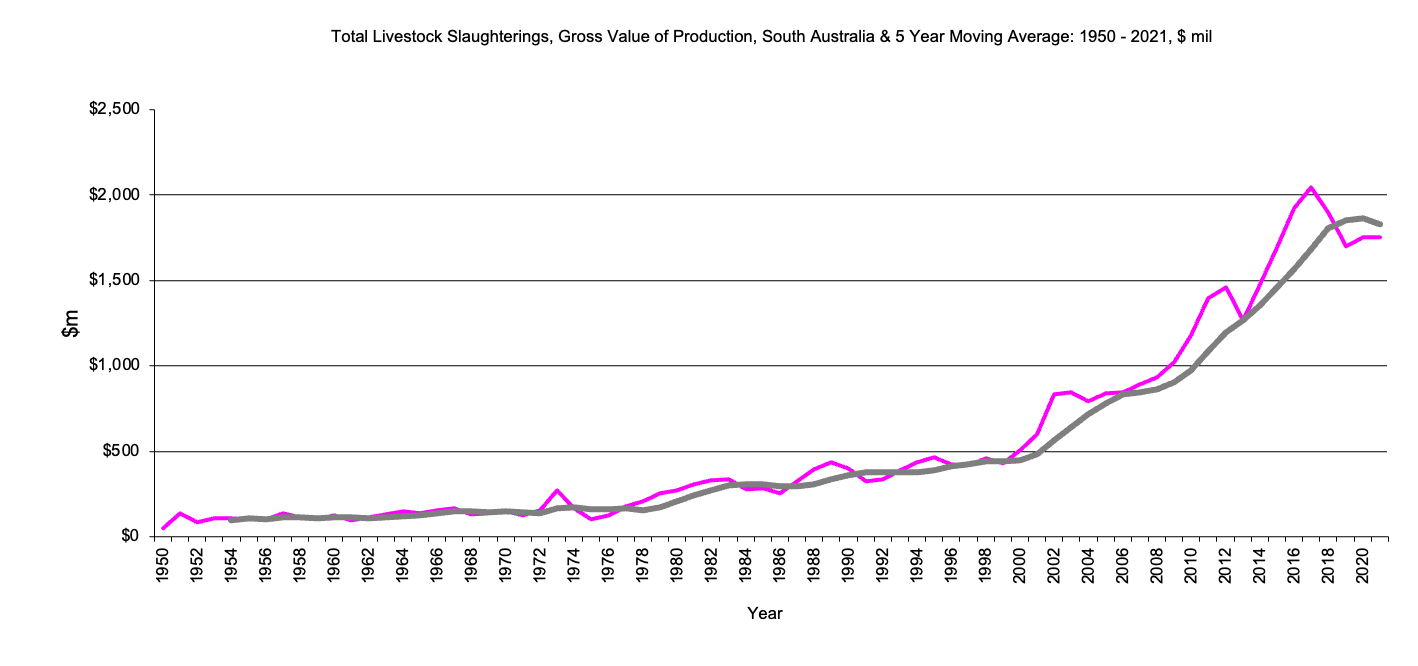
South Australia, Total Livestock Slaughtered - Gross Value Production
|
Total Livestock Slaughtered - Gross Value of production, $m, 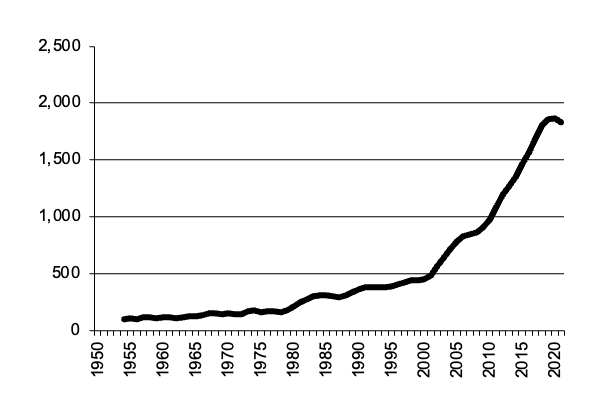
|
South Australia Total Livestock Slaughtered |
Return to top of page |
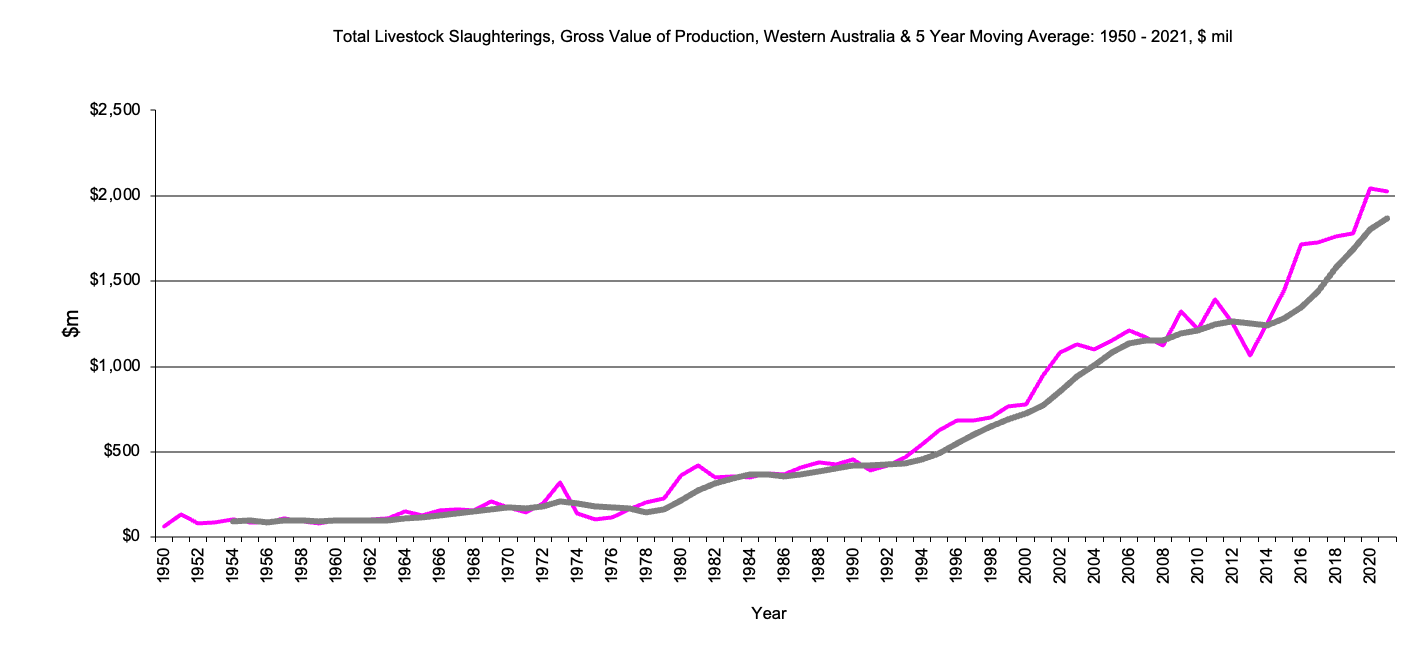
Western Australia, Total Livestock Slaughtered - Gross Value Production
|
Total Livestock Slaughtered - Gross Value of production, $m, 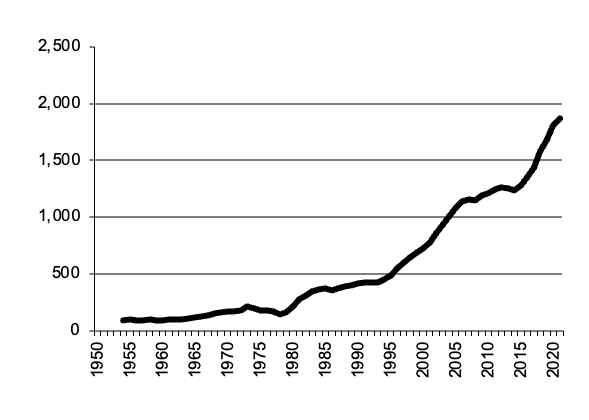
|
Western Australia Total Livestock Slaughtered |
Return to top of page |
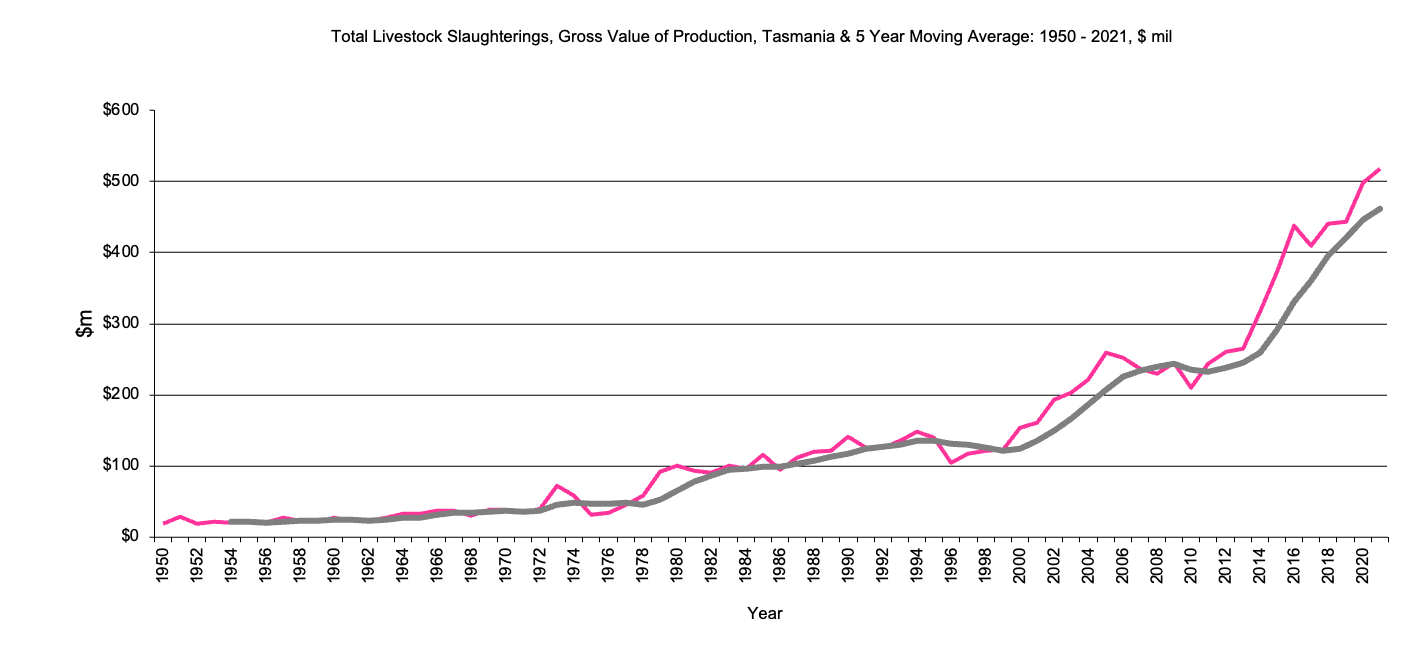
Tasmania, Total Livestock Slaughtered - Gross Value Production
|
Total Livestock Slaughtered - Gross Value of production, $m, 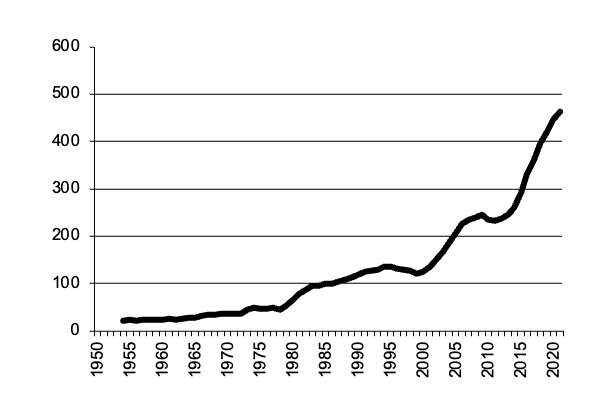
|
Tasmania Total Livestock Slaughtered |
Return to top of page |
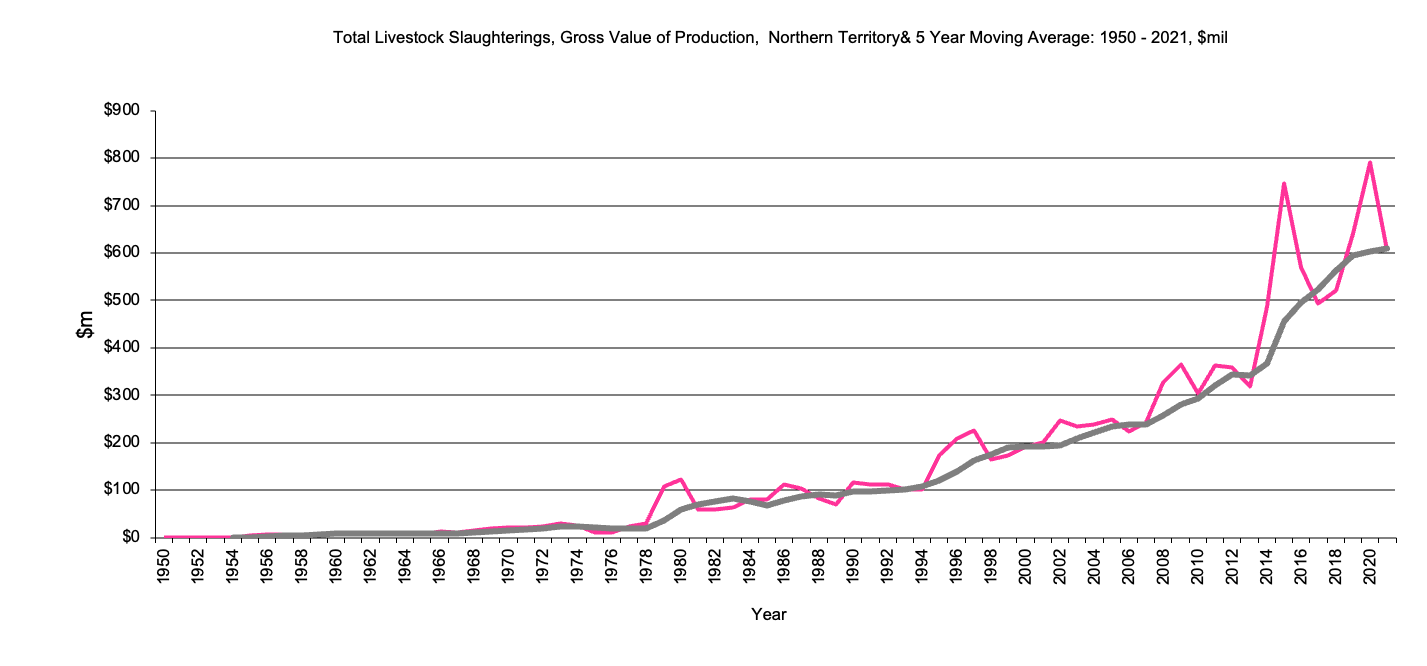
Northern Territory, Total Livestock Slaughtered - Gross Value Production
|
Total Livestock Slaughtered - Gross Value of production, $m, 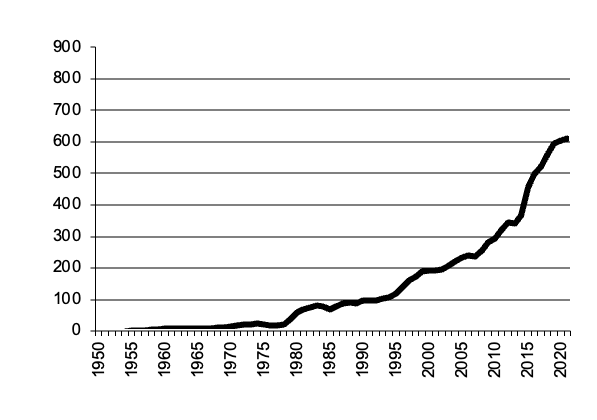
|
Northern Territory Total Livestock Slaughtered |
Return to top of page |
Data not recorded prior to 1955