NSW Milk Gross Value Production graph
NSW Milk , Gross Value Production data
Return to top of page
Back to Gross Value Production
Back to front page
Milk for manufacturing and human consumption
|
|
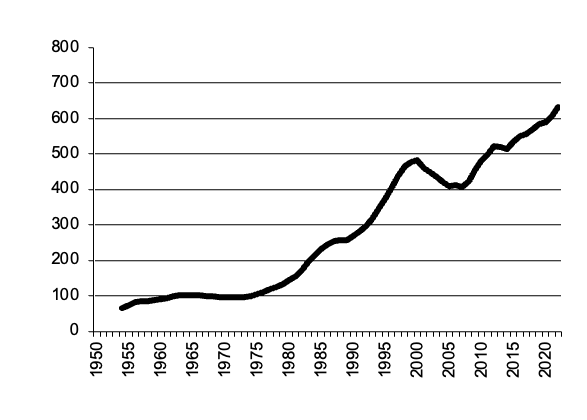
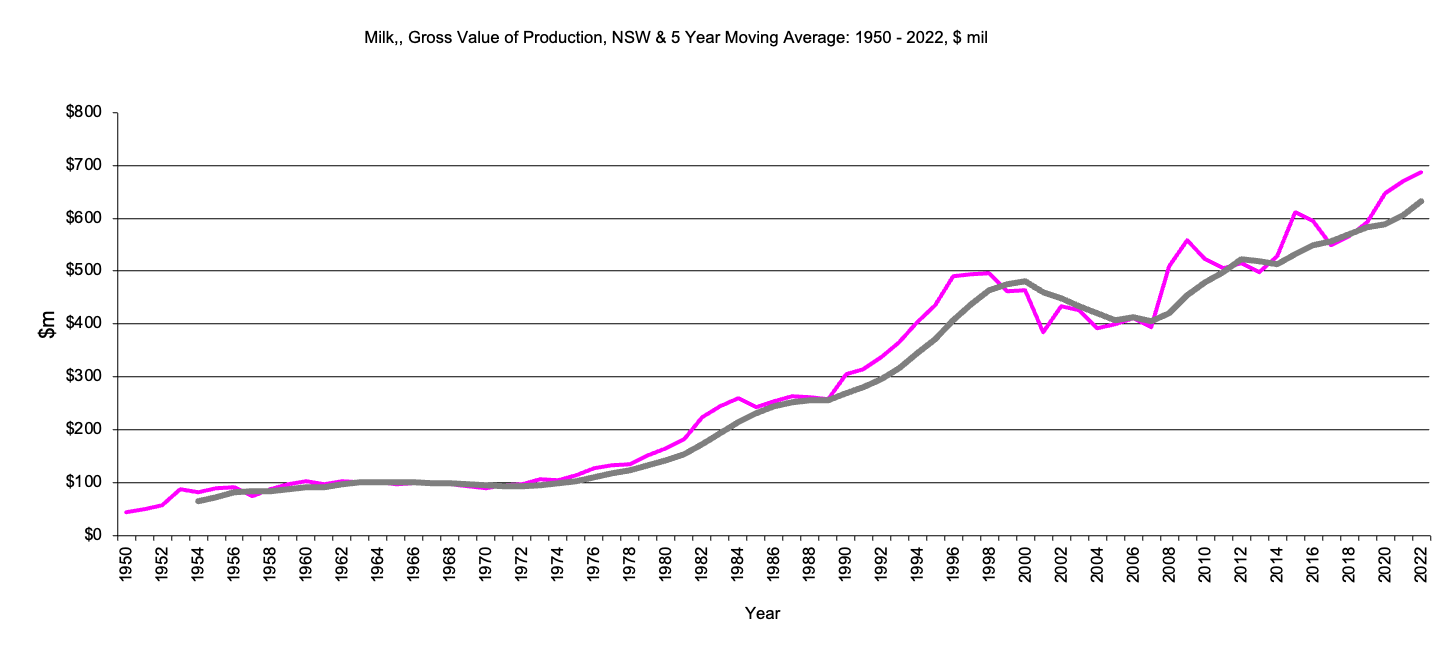
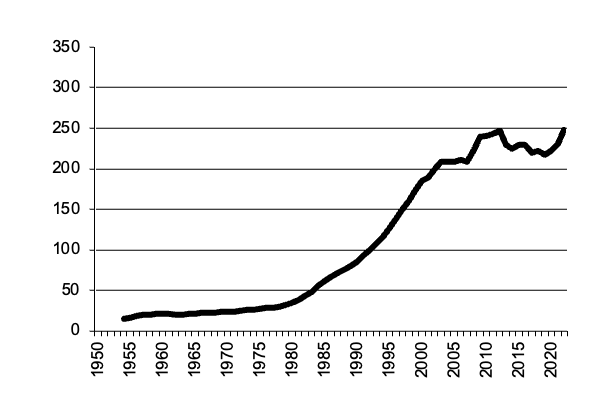
NSW, Milk - Gross Value Production
|
Milk - Gross Value of production, $m, 5 year moving average
|
NSW Milk Gross Value Production graph |
Return to top of page |
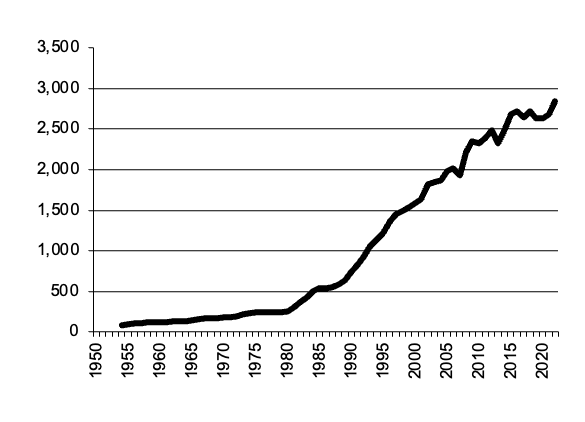
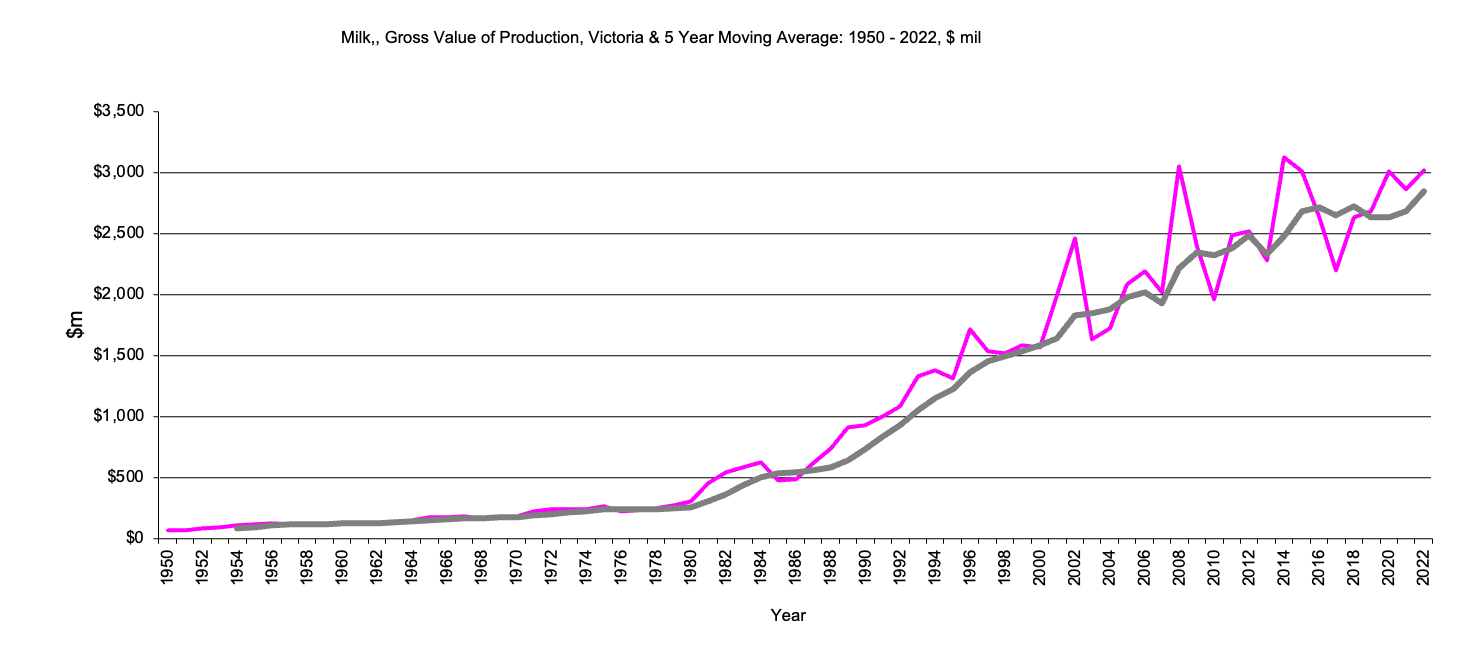
Victoria, Milk - Gross Value Production
Milk - Gross Value of production, $m, 5 year moving average
|
Victoria Milk Gross Value Production graph |
Return to top of page |
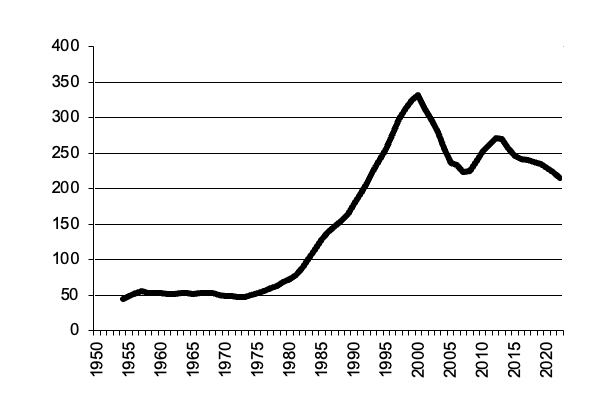
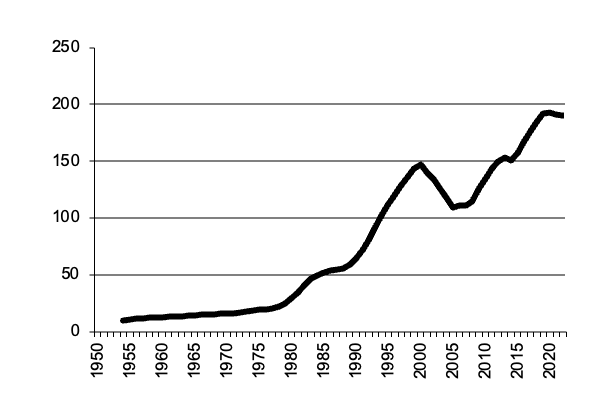
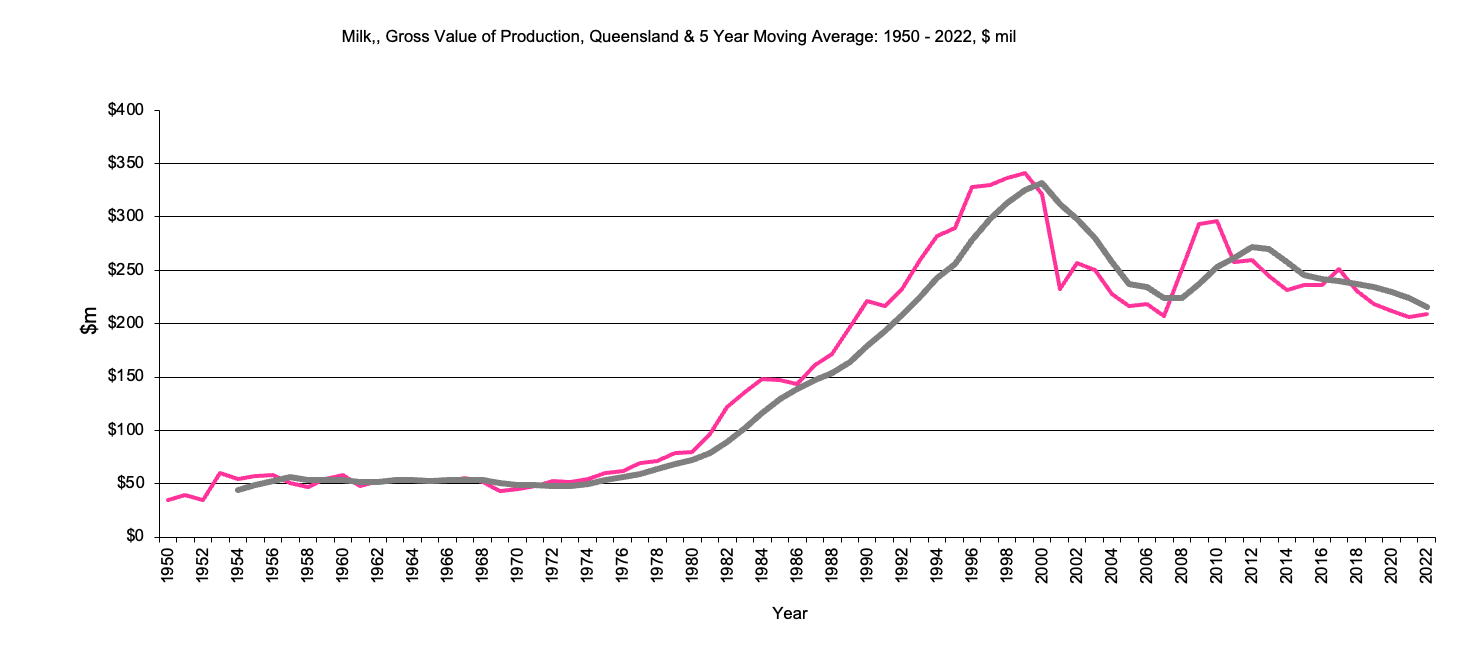
Queensland, Milk - Gross Value Production
Milk - Gross Value of production, $m, 5 year moving average
|
Queensland Milk Gross Value Production graph |
Return to top of page |
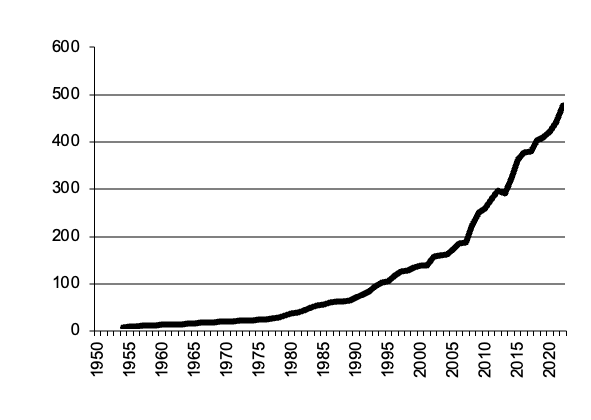
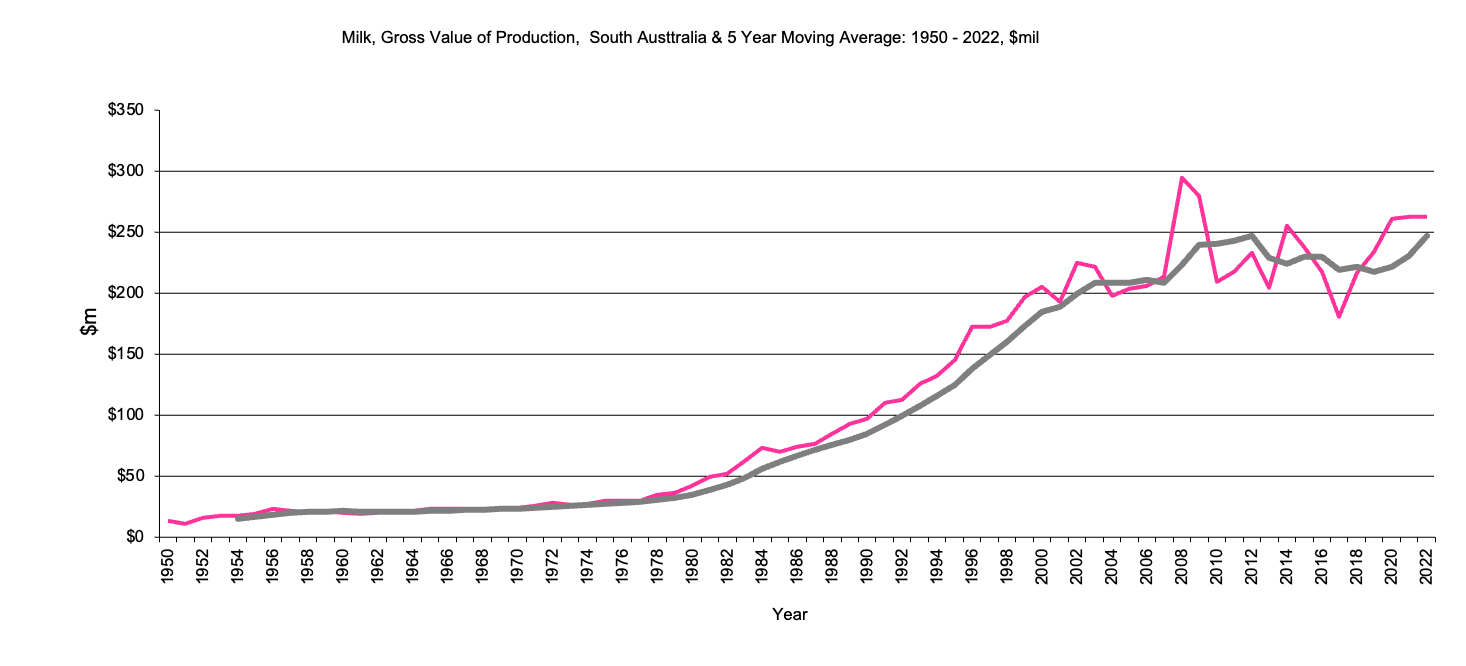
South Australia, Milk - Gross Value Production
Milk - Gross Value of production, $m, 5 year moving average
|
South Australia Milk Gross Value Production graph |
Return to top of page |
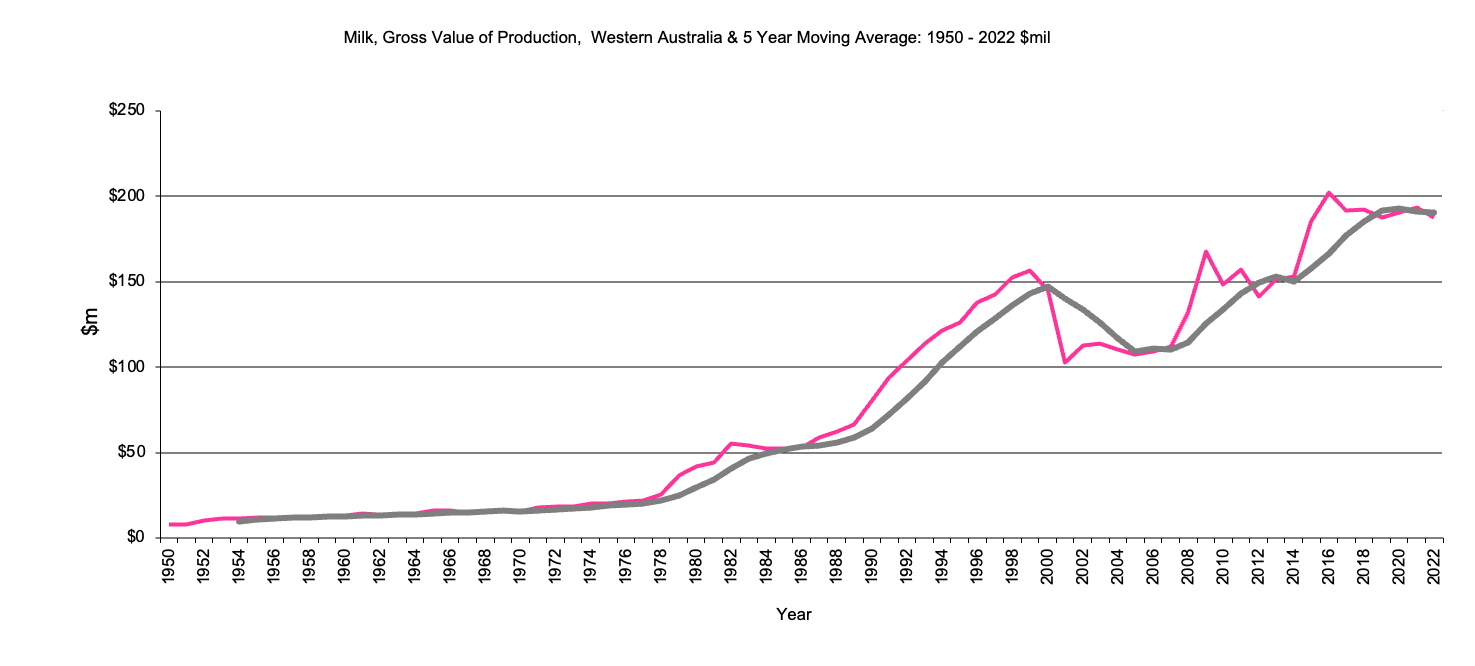
Western Australia, Milk - Gross Value Production
Milk - Gross Value of production, $m, 5 year moving average
|
Western Australia Milk Gross Value Production graph |
Return to top of page |
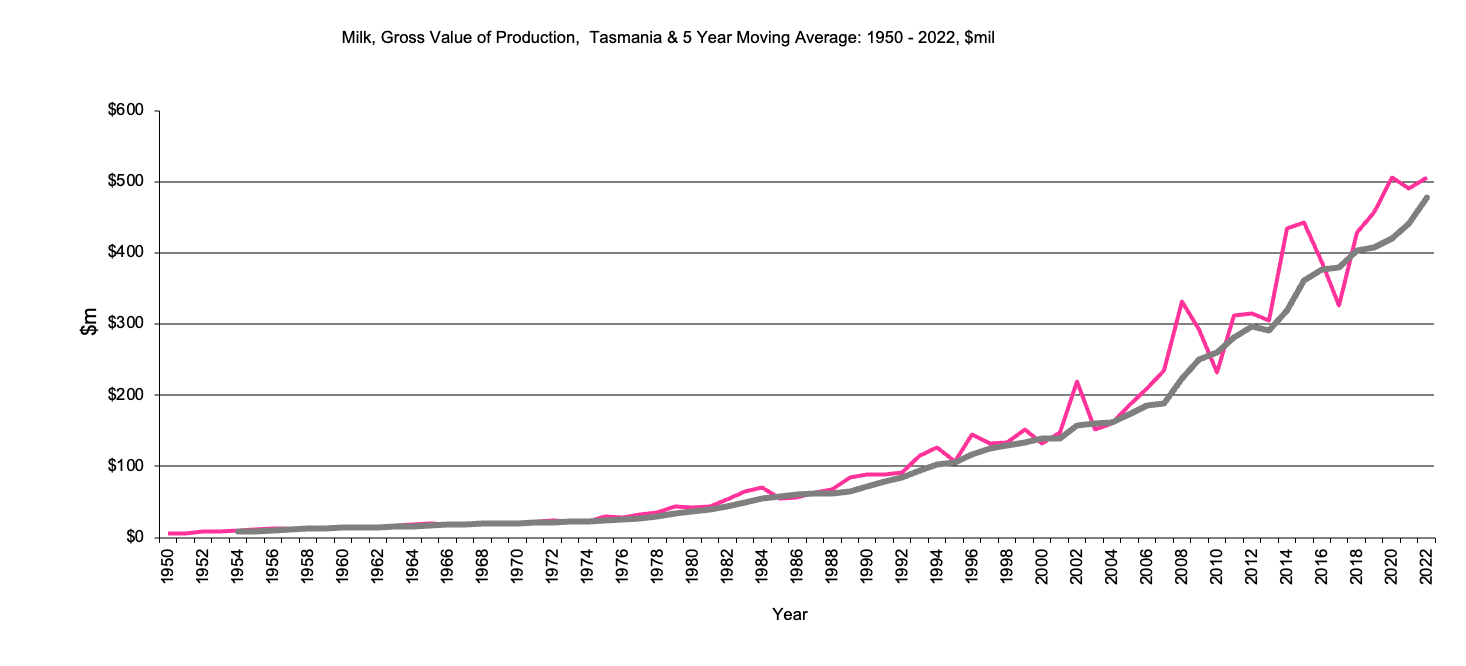
Tasmania, Milk - Gross Value Production
Milk - Gross Value of production, $m, 5 year moving average
|
Tasmania Milk Gross Value Production graph |
Return to top of page |