|
Gross value Total Livestock Slaughtered 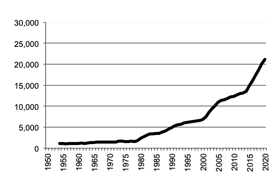
|
Total Livestock Slaughtered Gross Value Production graph |
Return to top of page |
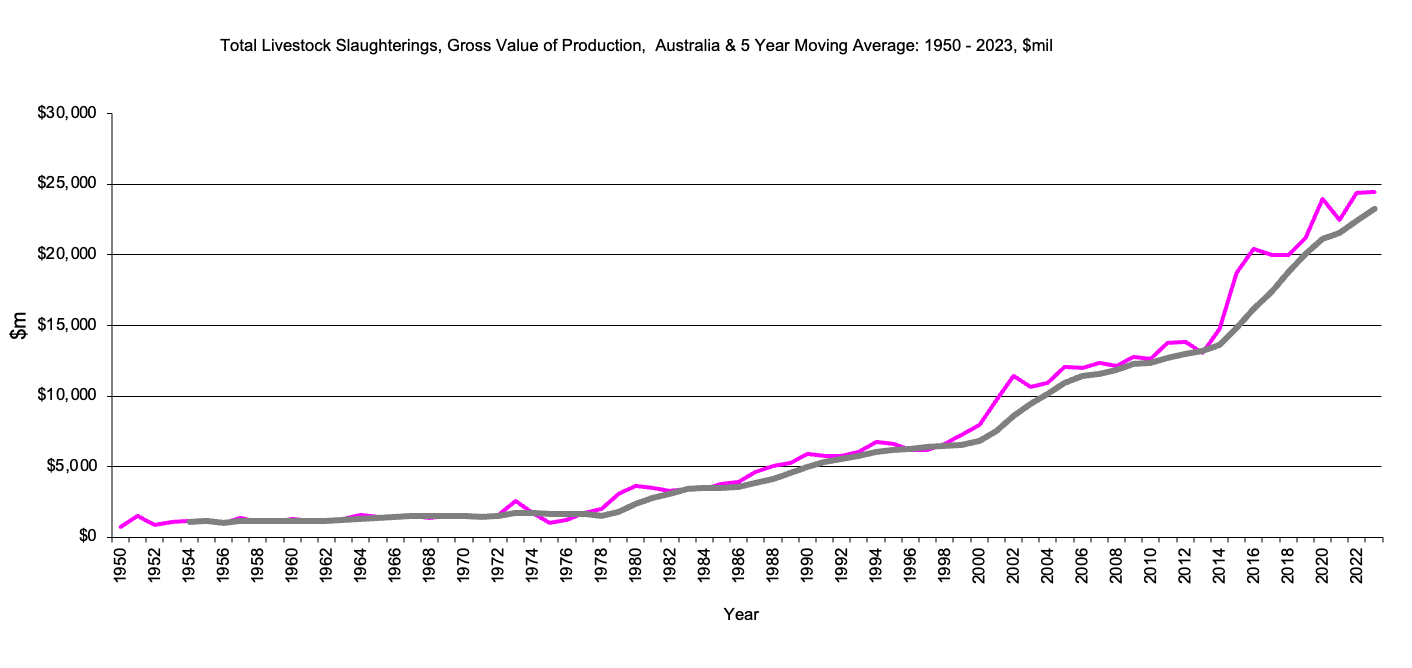
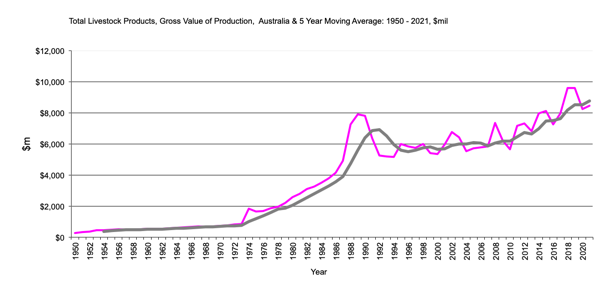
Total Livestock Products - Value of Production
|
Gross value production Total Livestock Products in $m, 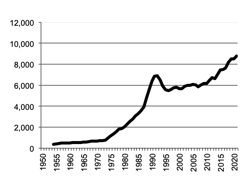
|
Total Livestock Products Gross Value Production graph |
Return to top of page |
|
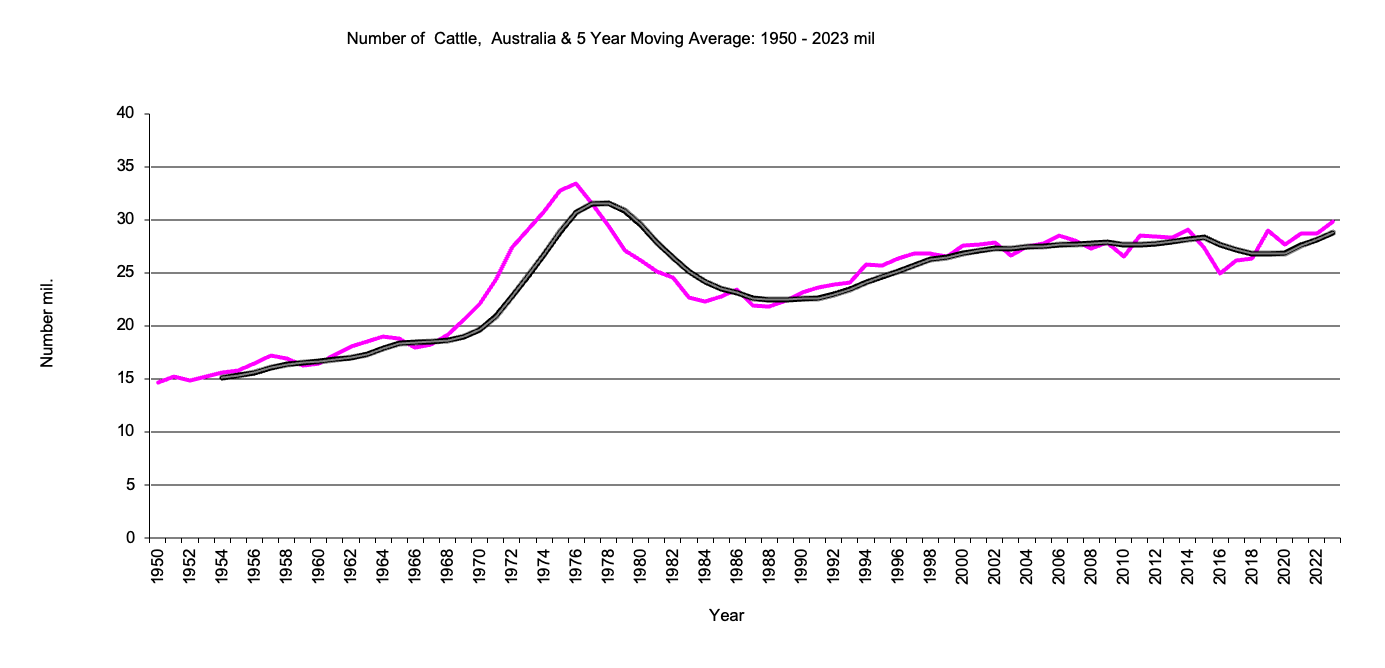
Number of cattle in millions, 5 year moving average. 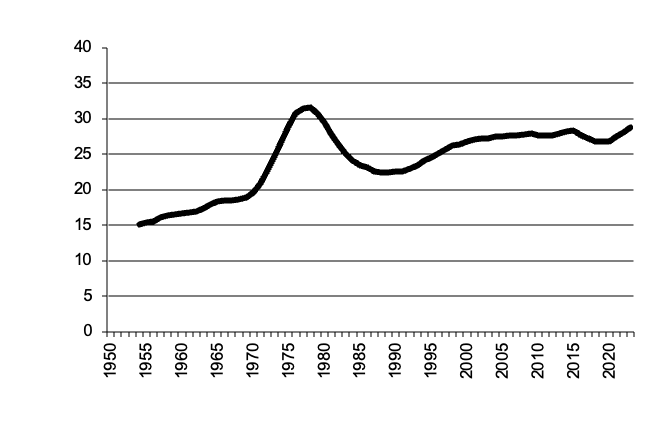
|
Number of Cattle graph |
Return to top of page |
Cattle numbers have risen steadily over 50 years from 15 million to over 25 million although they touched a peak of over 30 million in the mid 1970's. A similar numbers pattern occurred in all states except Queensland and Northern Territory, where the rise in numbers has been more pronounced and the mid 70's peak less pronounced.
|
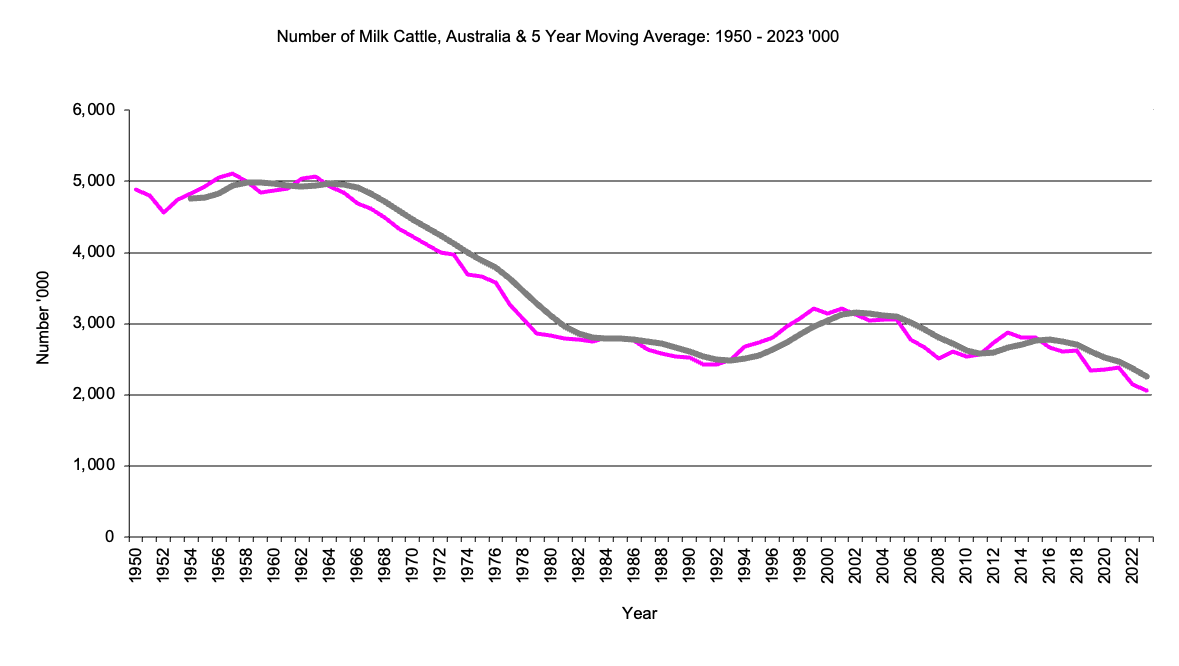
Number of milk cattle '000, 5 year moving average. 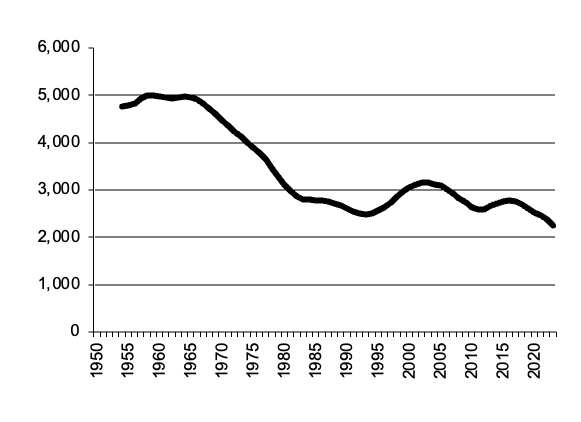
|
Number of milk cattle graph |
Return to top of page |
Numbers declined from around 5 million in the early 1960's (when the Government realised it had too many low income dairy farmers) to around 2.5 million. Numbers recovered to over 3 million from 1997 to 2005 and are now back to 2.5 million.
|
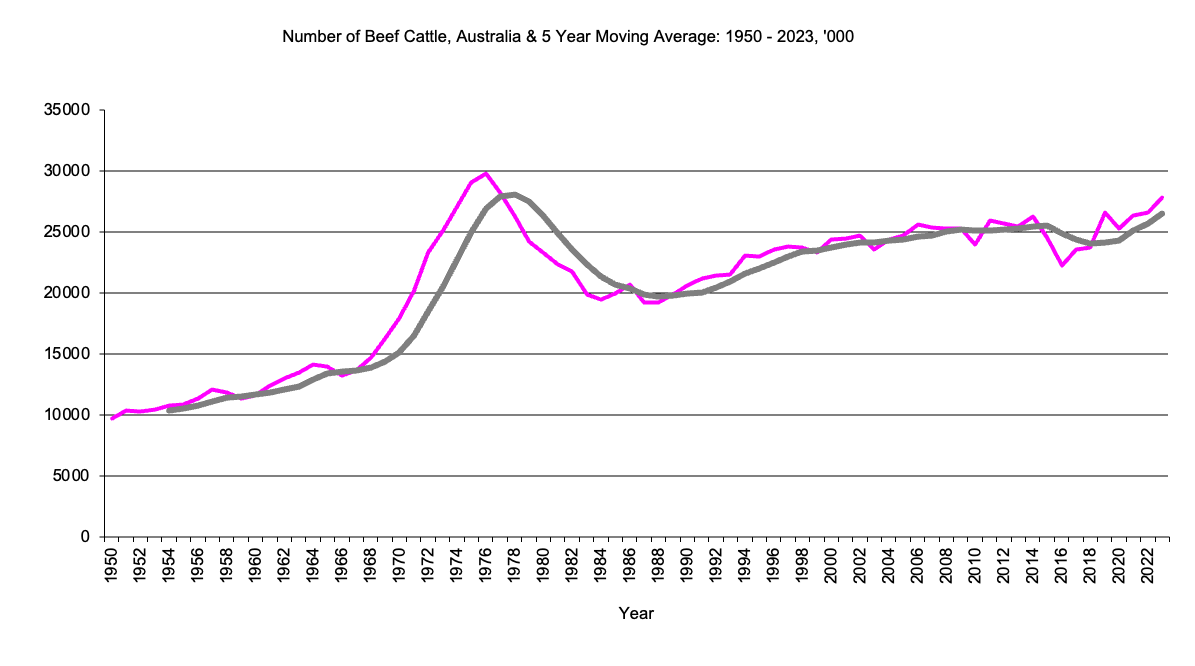
Number of beef cattle '000, 5 year moving average. 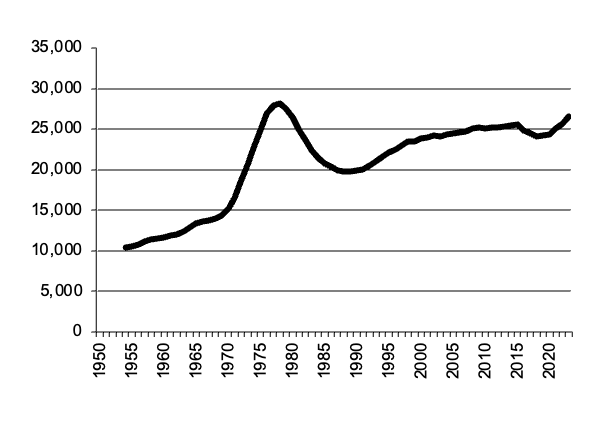
|
Number of beef cattle graph |
Return to top of page |
Beef cattle numbers have risen steadily over 50 years from round 10 million to around 25 million although they touched a peak of just under 30 million in the mid 1970's. A similar numbers pattern has occurred in all states.
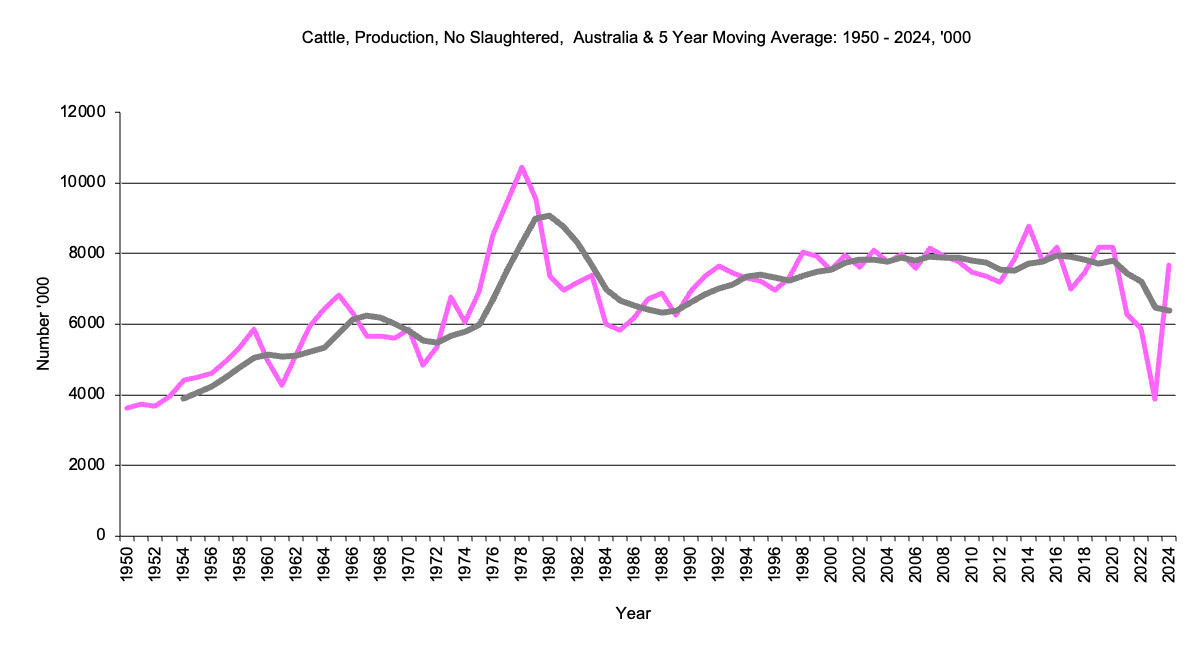
Cattle - Number Slaughtered
Prior to 1971 cattle slaughtered included calves slaughtered
|
Number of cattle slaughtered, thousands, 5 year moving average. 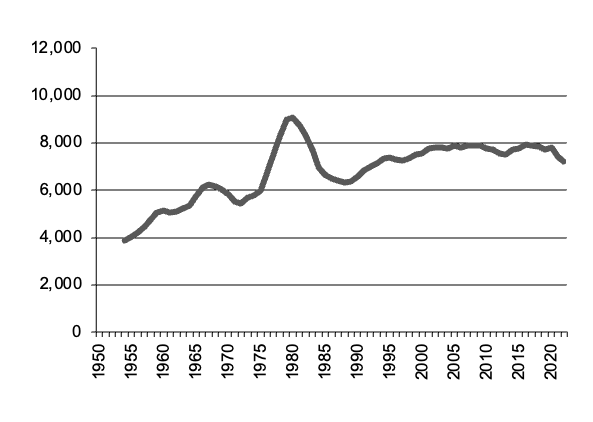
|
Number cattle slaughtered graph |
Return to top of page |
Calves - Number Slaughtered
Prior to 1971 calves slaughtered included in cattle slaughtered
|
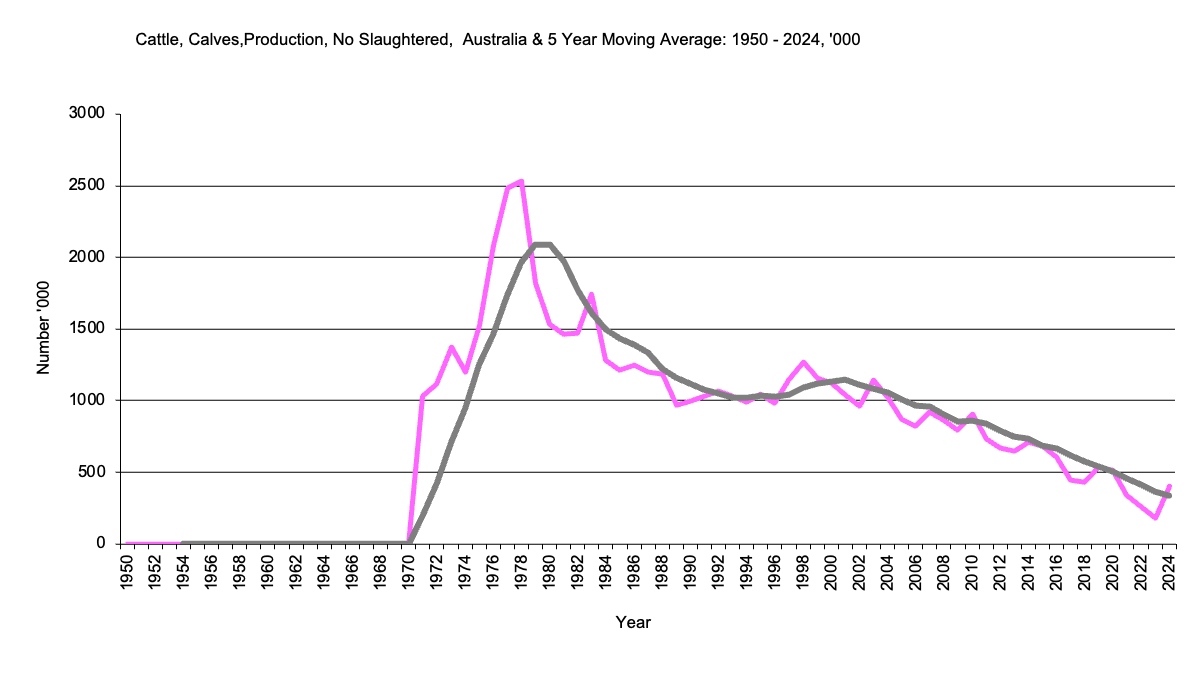
Number of calves slaughtered, thousands, 5 year moving average 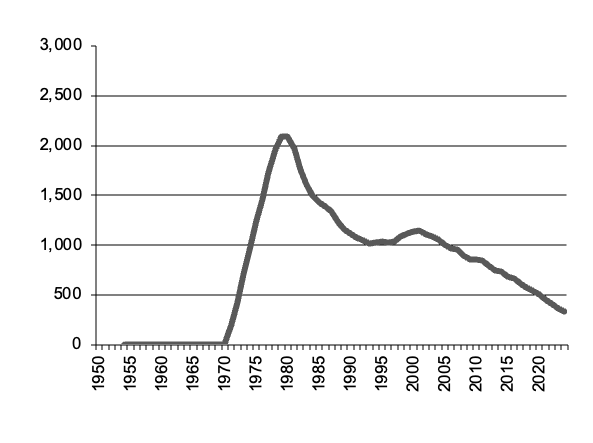
|
Number calves slaughtered graph |
Return to top of page |
Beef Production
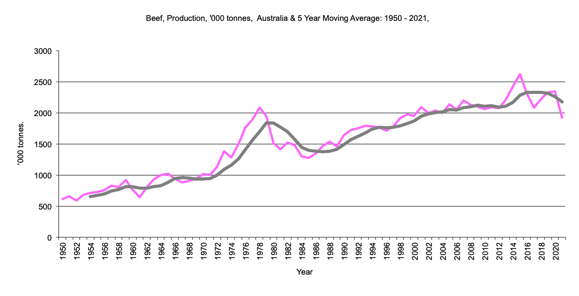
From 1950 to 1970 includes veal production
|
Beef production, '000 tonnes, 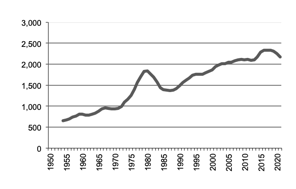
|
Beef production graph |
Return to top of page |
Veal Production
From 1950 to 1970 includes veal production
|
Veal production, thousand tonnes. 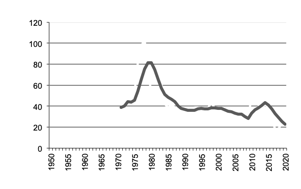
|
Veal production graph |
Return to top of page |
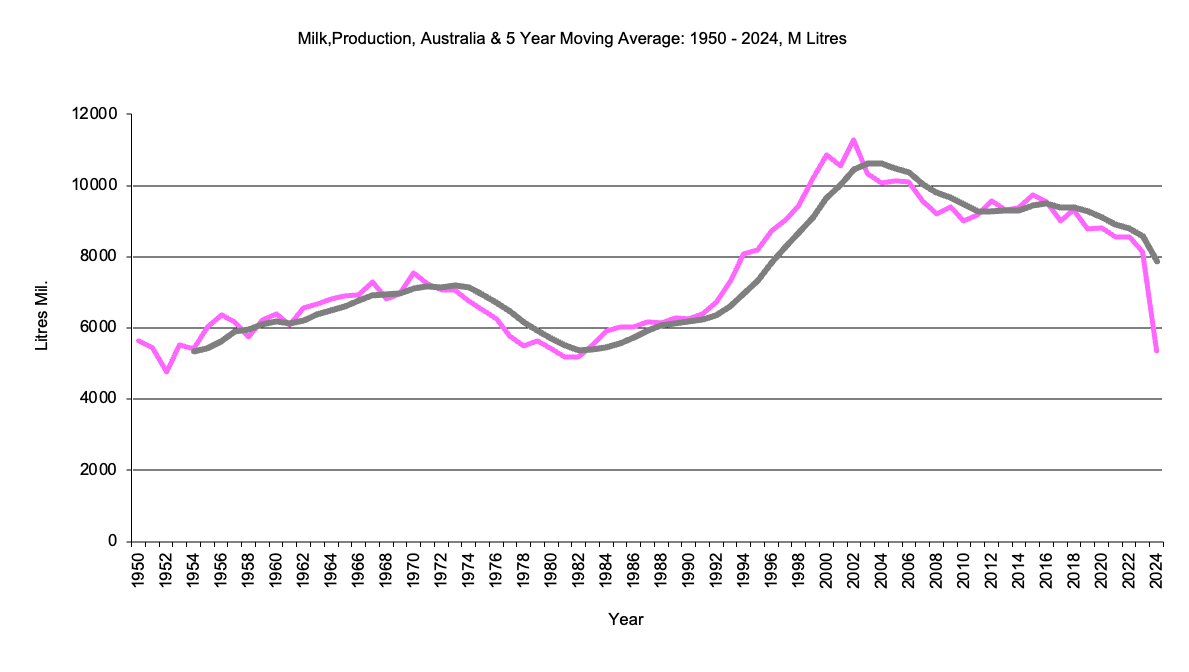
|
Milk production, million litres, 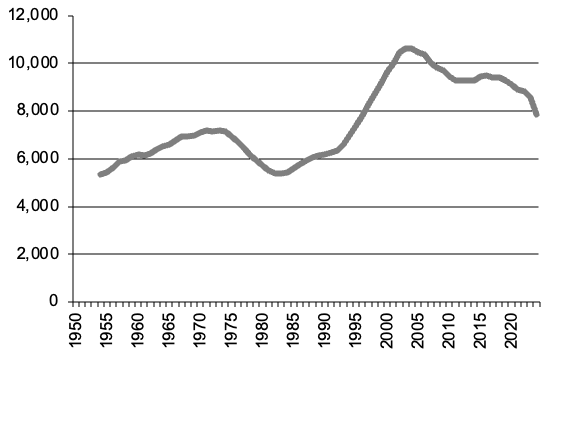
|
Milk production graph |
Return to top of page |
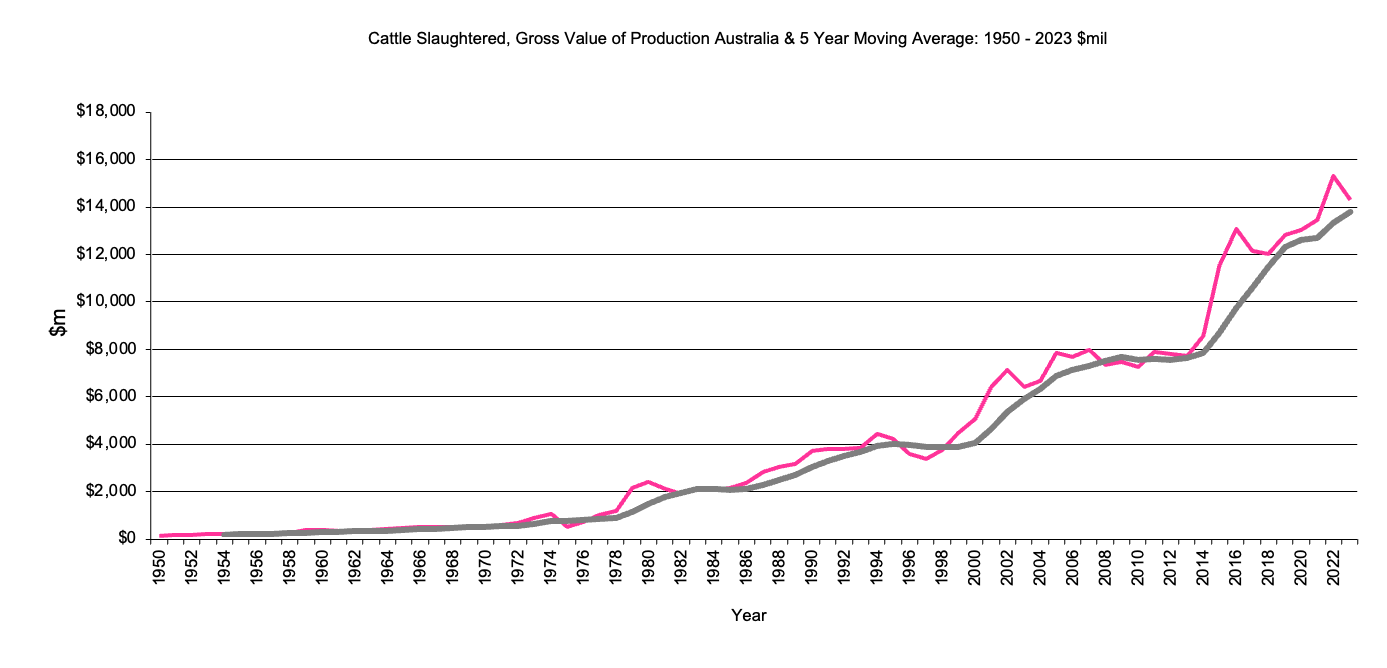
Cattle, slaughtered - Gross Value of Production
|
Gross value production Cattle, slaughtered - $m, 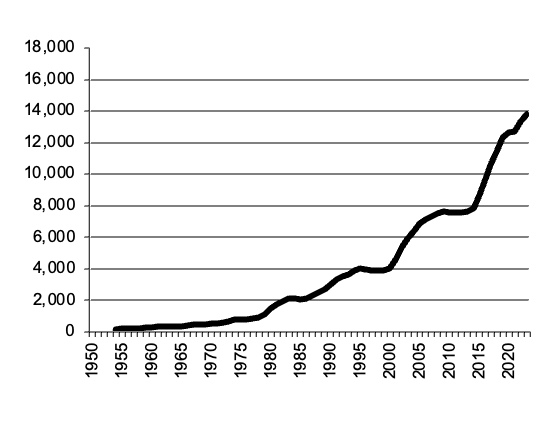
|
Cattle, slaughtered Gross Value Production graph |
Return to top of page |
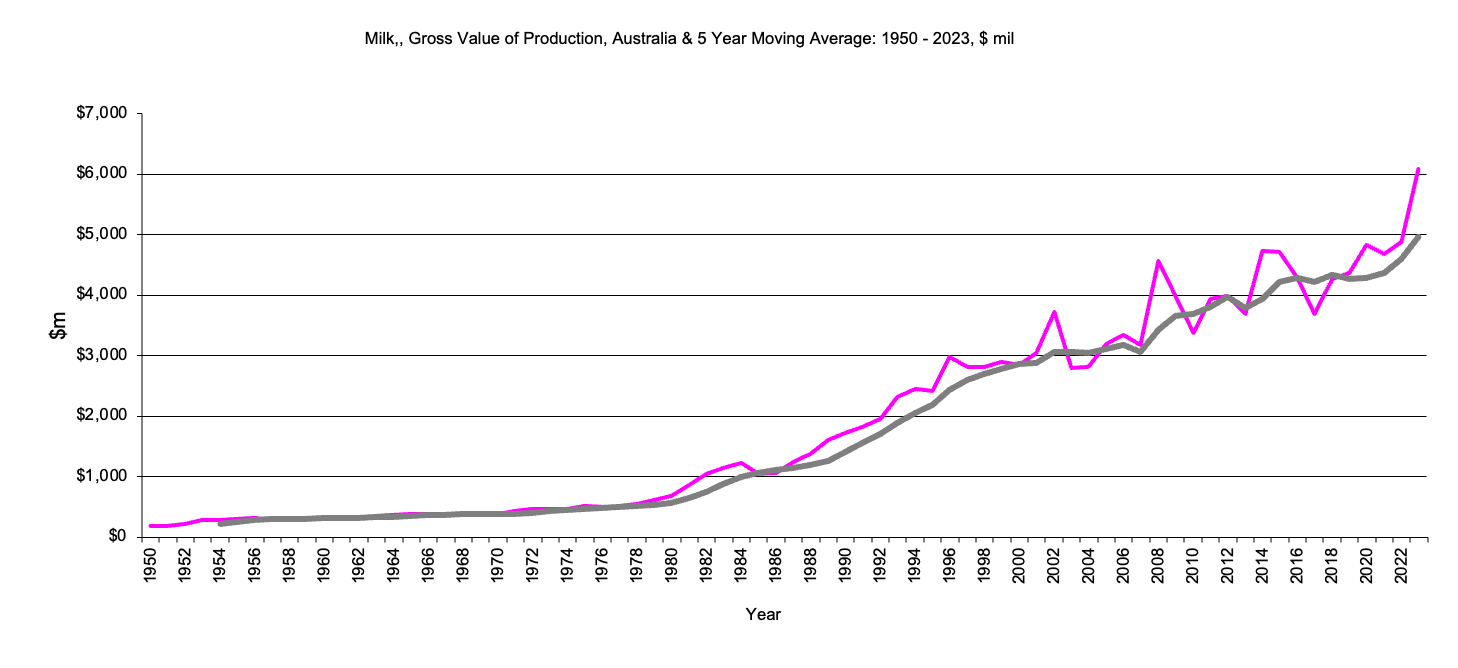
Cattle, Milk - Gross Value of Production
|
Gross value production Milk - $m, 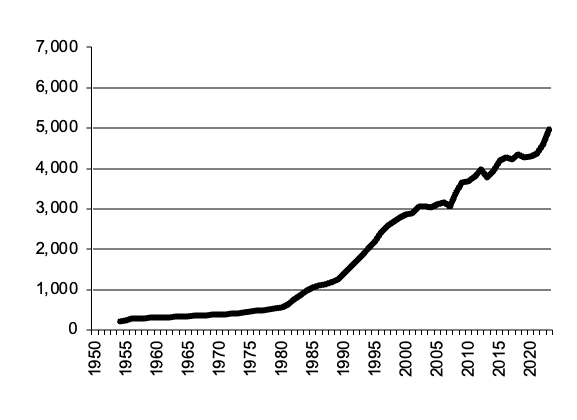
|
Milk Gross Value Production graph |
Return to top of page |
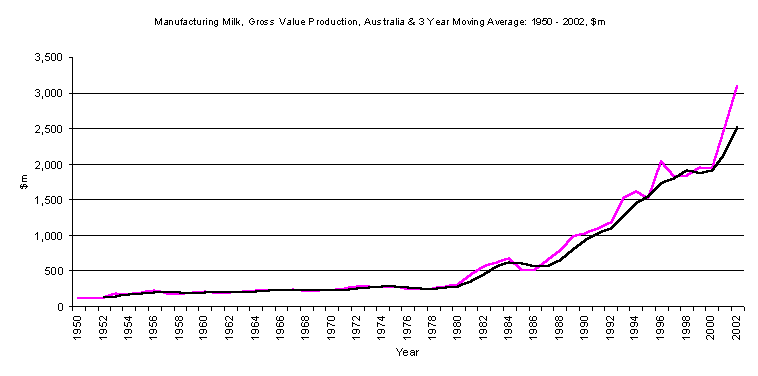
Cattle, Manufacturing Milk - Gross Value of Production
This data series ceased in 2003, when milk factories paid the same price for manufacturing and human consumption milk.
|
Gross value production Manufacturing Milk - $m, 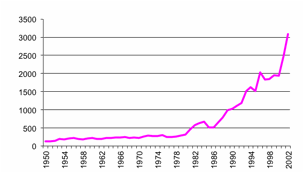
|
Manufacturing Milk Gross Value Production graph |
Return to top of page |
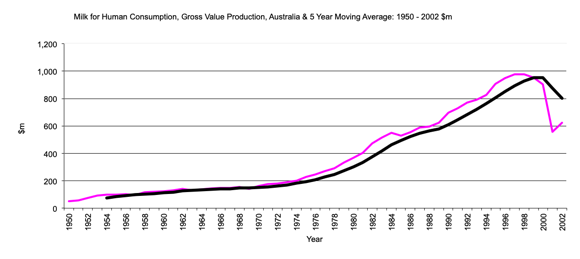
Cattle, Milk for Human Consumption - Value of Production
This data series ceased in 2003, when milk factories paid the same price for manufacturing and human consumption milk.
|
Gross value production Milk for Human Consumption - $m, 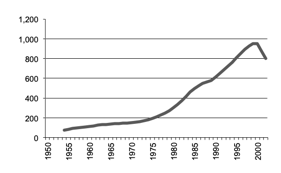
|
Milk for Human Consumption Gross Value Production graph |
Return to top of page |
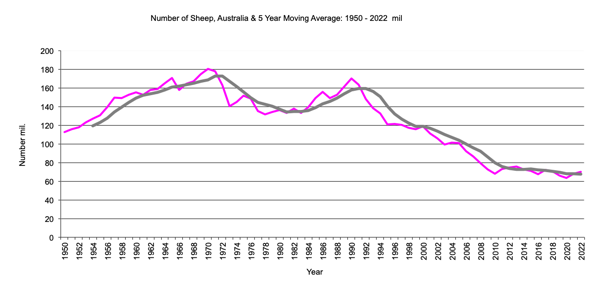
|
Number of sheep in millions, 5 year moving average. 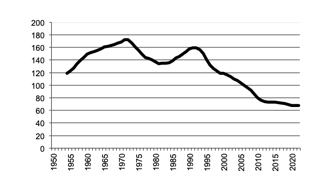
|
Number of Sheep graph |
Return to top of page |
After reaching peaks of 180 million (1970) and 170 million (1990) sheep numbers have fallen to around 70 million; less than 50 years ago (112 million).
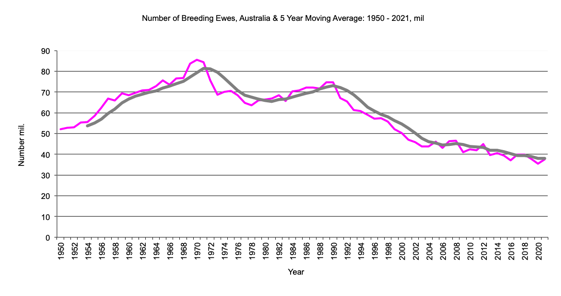
|
Number of sheep, breeding ewes,in millions, 5 year moving average. 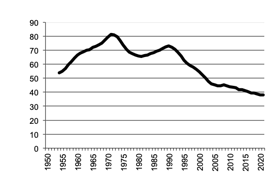
|
Number of Sheep - Breeding Ewes graph |
Return to top of page |
From 1995,some data for ewes are ewes mated. Number of ewes mated are less than breeding ewes.
|
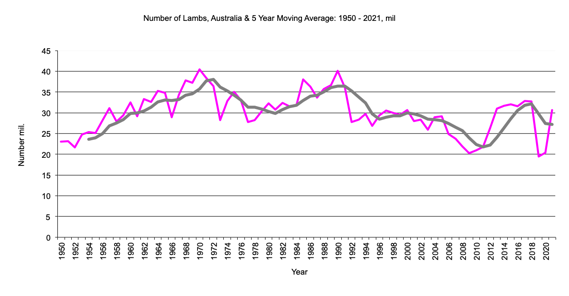
Number of sheep, lambs,in millions, 5 year moving average. 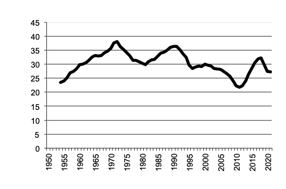
|
Number of Sheep - Lambs graph |
Return to top of page |
|
Number of sheep - other - in millions. 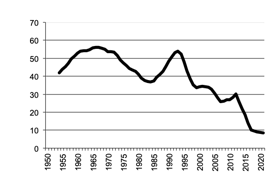
|
Number of Sheep - Other graph |
Return to top of page |
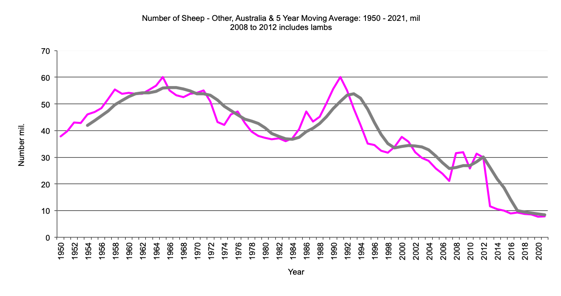
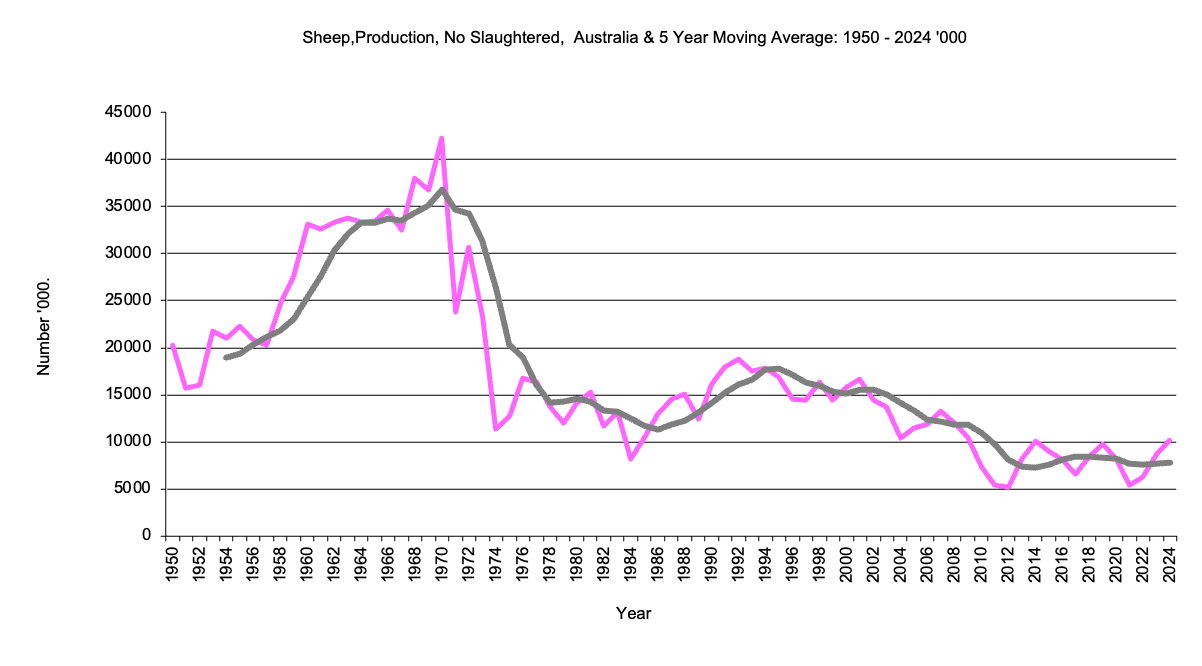
Sheep - Number Slaughtered
Prior to 1971 sheep slaughtered included lambs slaughtered
|
Number of sheep slaughtered, 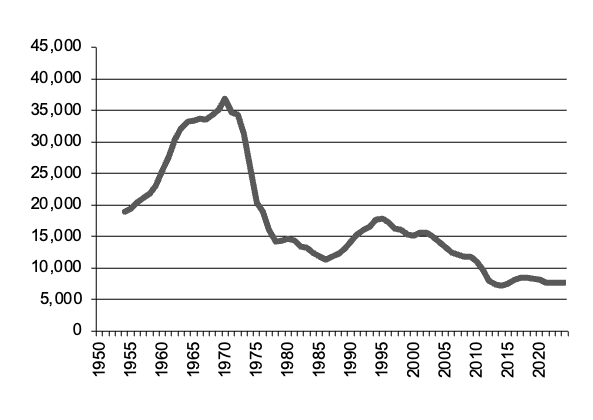
|
Number sheep slaughtered graph |
Return to top of page |
Lambs - Number Slaughtered
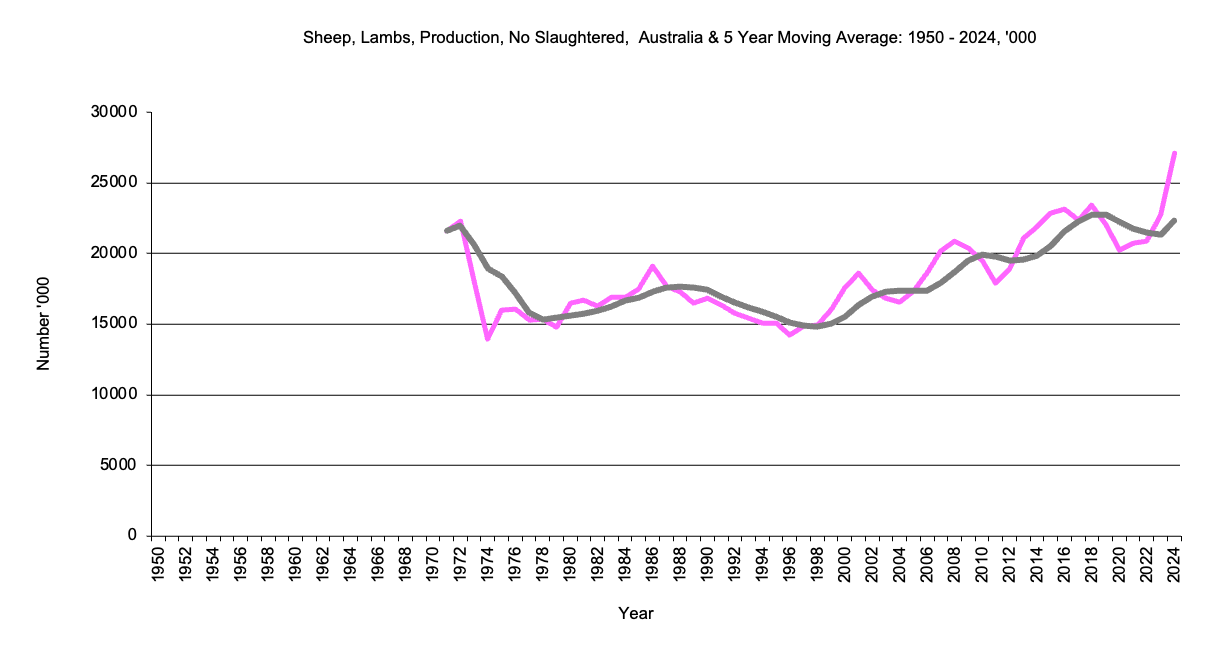
Prior to 1971 lambs slaughtered included in sheep slaughtered
|
Number of lambs slaughtered 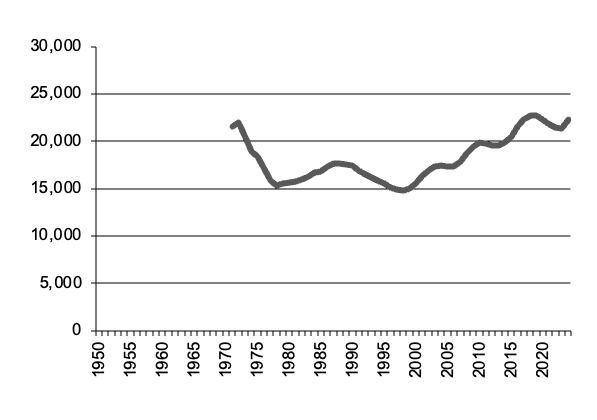
|
Number lambs slaughtered graph |
Return to top of page |
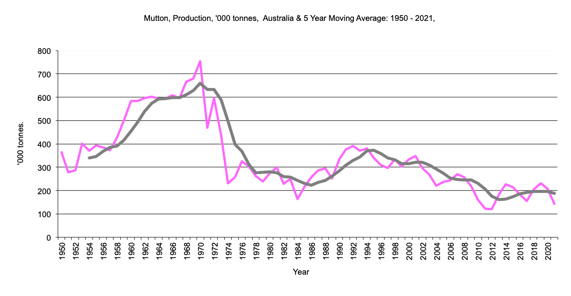
|
Mutton production, '000 tonnes.5 year moving average 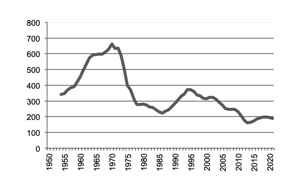
|
Mutton production graph |
Return to top of page |
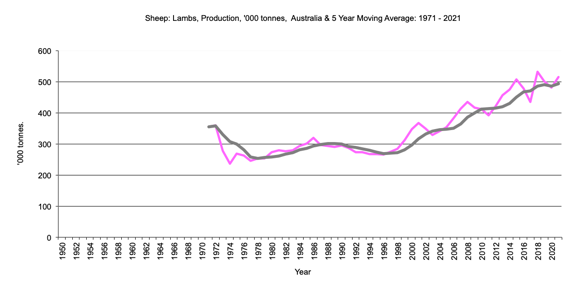
|
Lamb production, '000 tonnes.5 year moving average 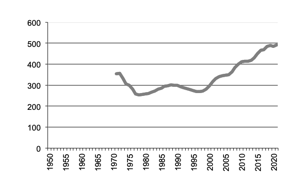
|
Lamb production graph |
Return to top of page |
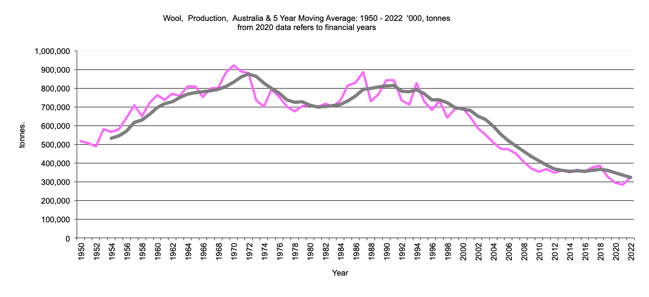
|
Wool Production in tonnes. 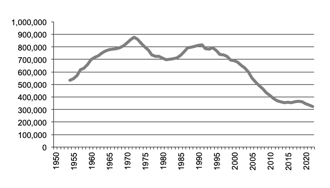
|
Wool Production graph |
Return to top of page |
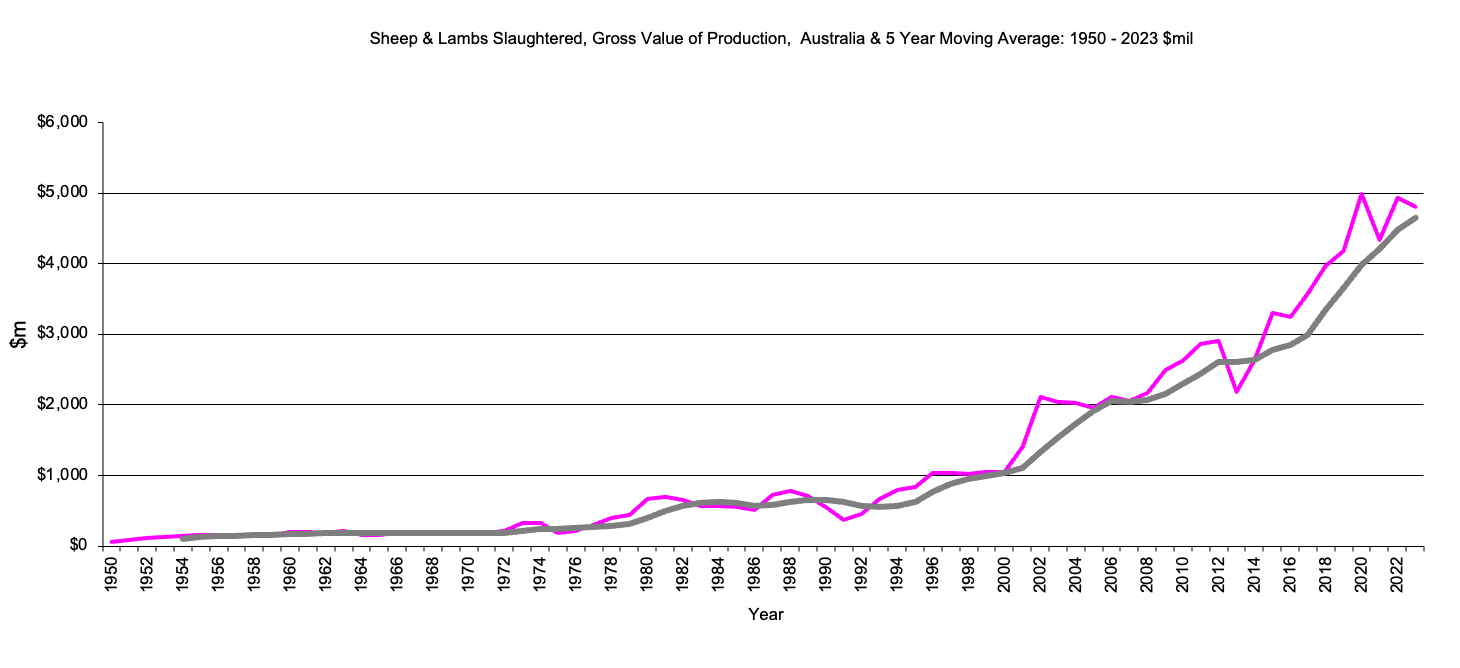
Sheep Slaughtered - Value of Production
|
Gross value production Sheep slaughtered - $m, 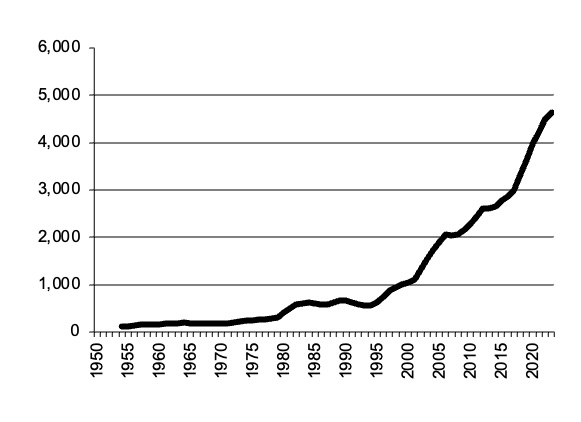
|
Sheep slaughtered Gross Value Production graph |
Return to top of page |
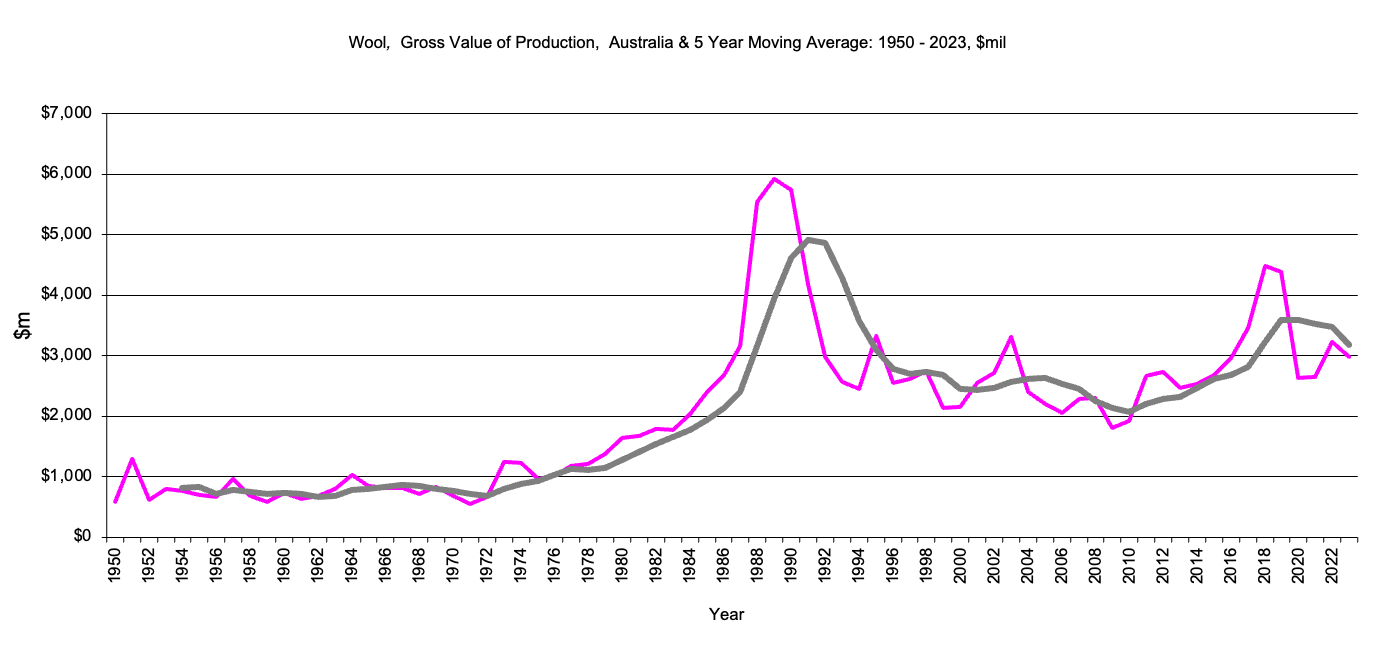
|
Gross value production wool in $m 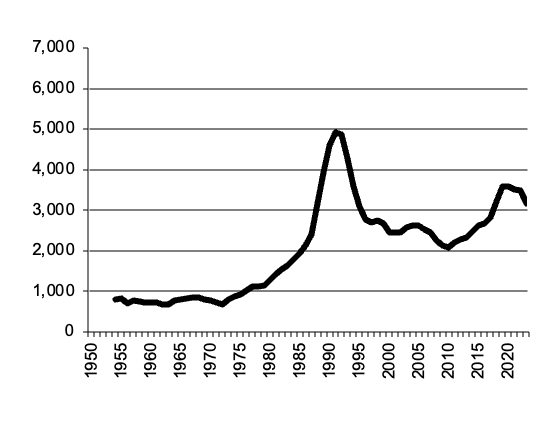
|
Wool Gross Value Production graph |
Return to top of page |
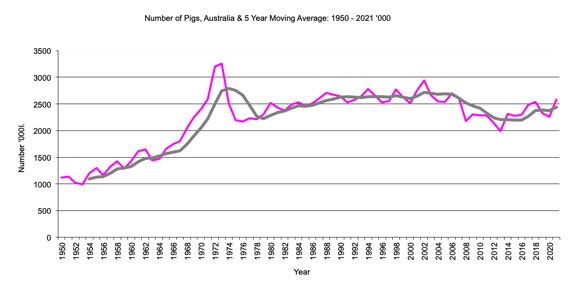
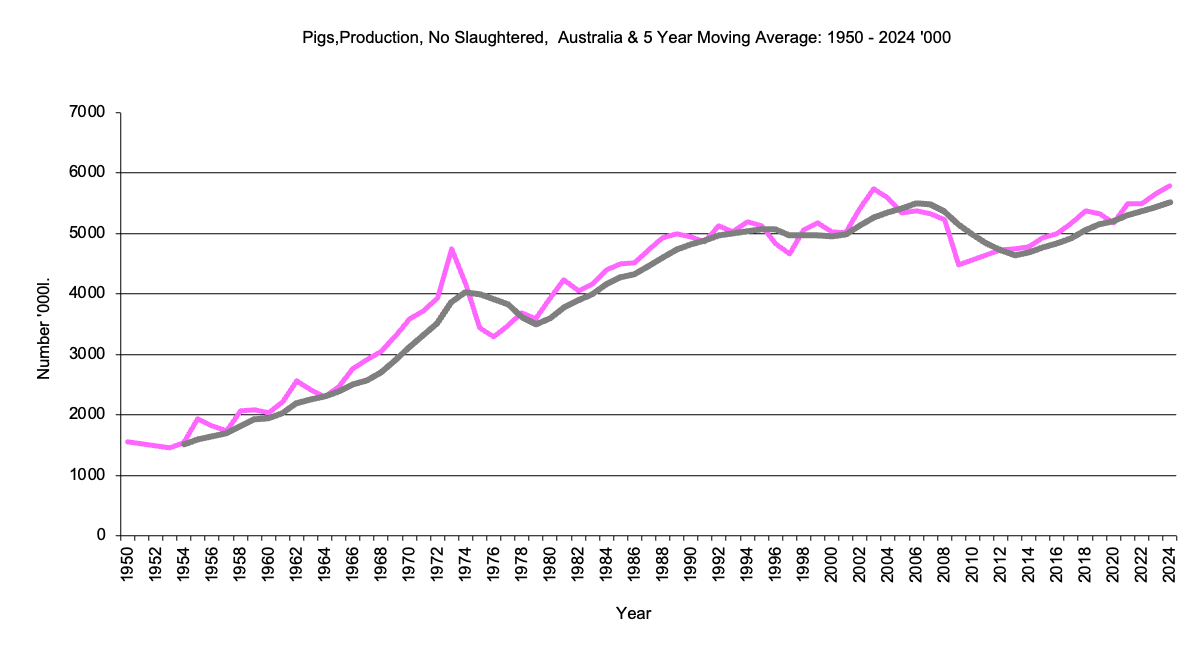
|
Number of pigs in '000, 5 year moving average. 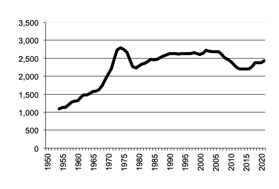
|
Number of Pigs graph |
Return to top of page |
Pig numbers have risen steadily from around 1 million to around 2.5 million although they touched a peak of over 3 million in the early 1970's. A similar numbers pattern occurred in NSW, Victoria, South and Western Australia.
Pigs - Number Slaughtered|
Number of pigs slaughtered, 5 year moving average 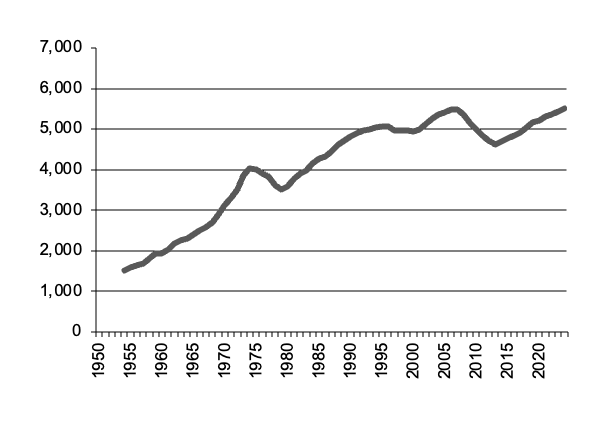
|
Number pigs slaughtered graph |
Return to top of page |
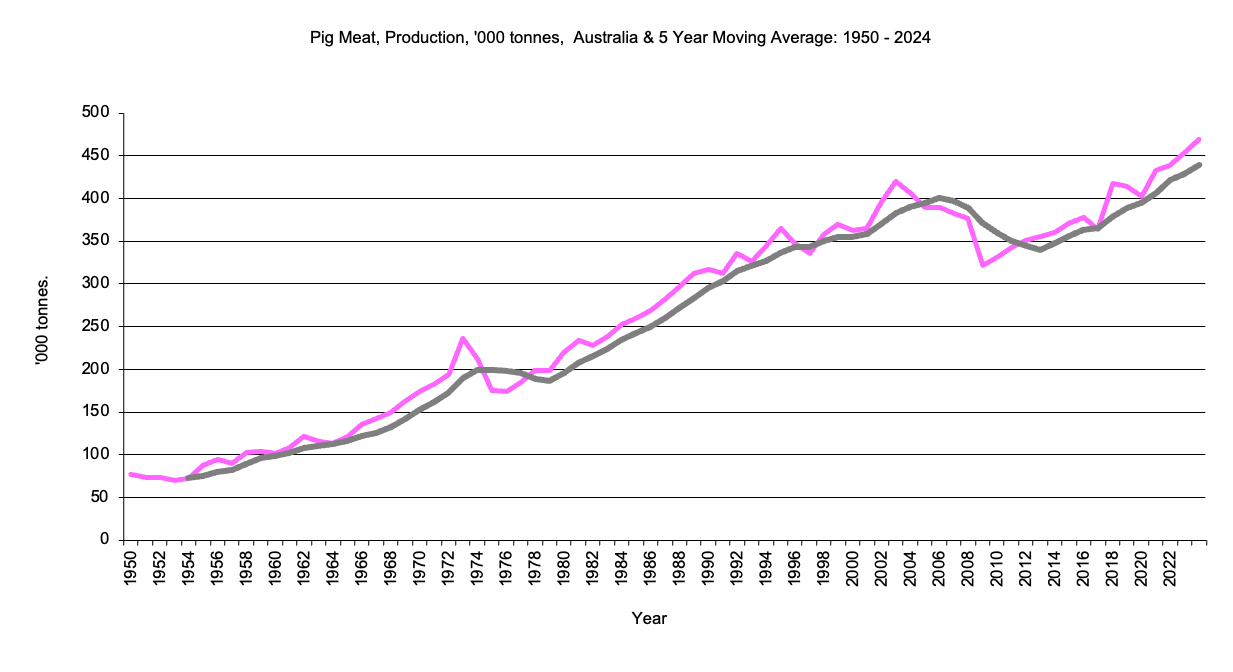
|
Pig Meat Production, '000 tonnes, 5 year moving average 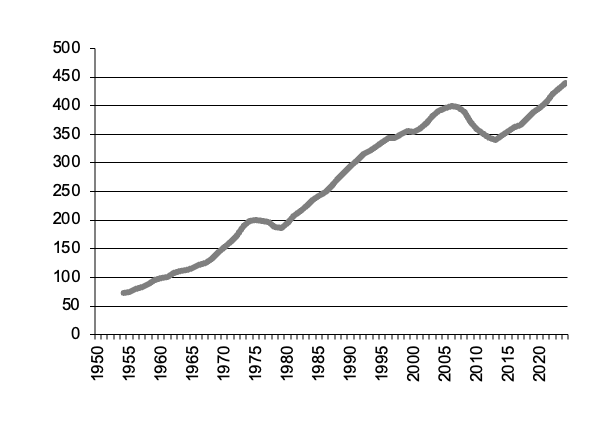
|
Pig Meat Production graph |
Return to top of page |
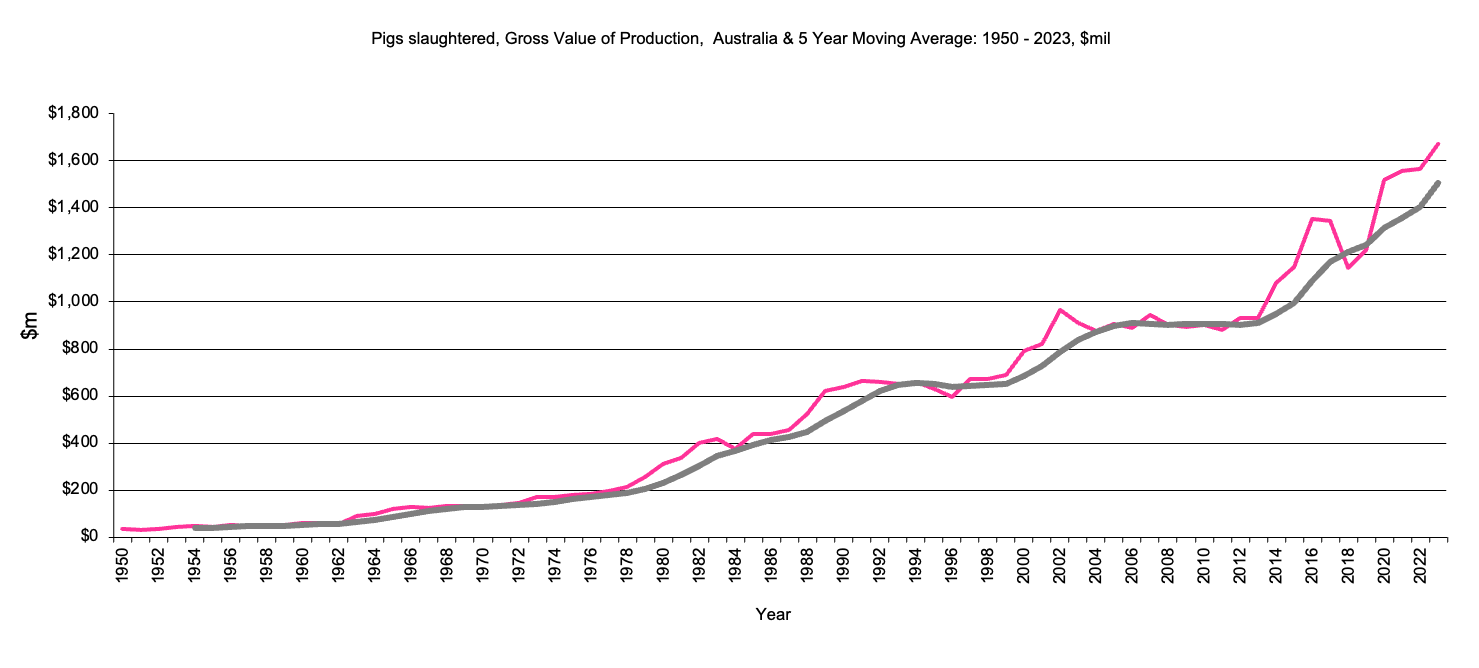
|
Gross value production pigs slaughtered - $m, 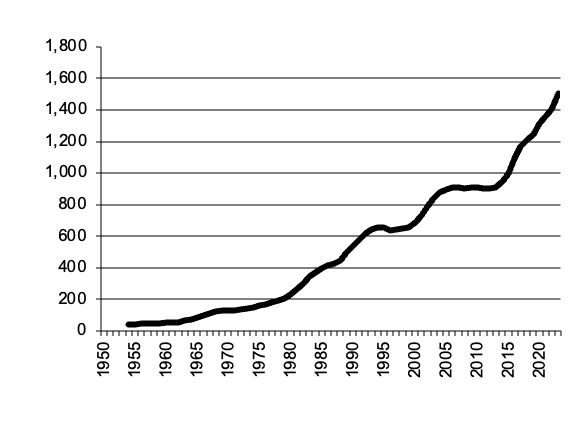
|
Pigs slaughtered Gross Value Production graph |
Return to top of page |
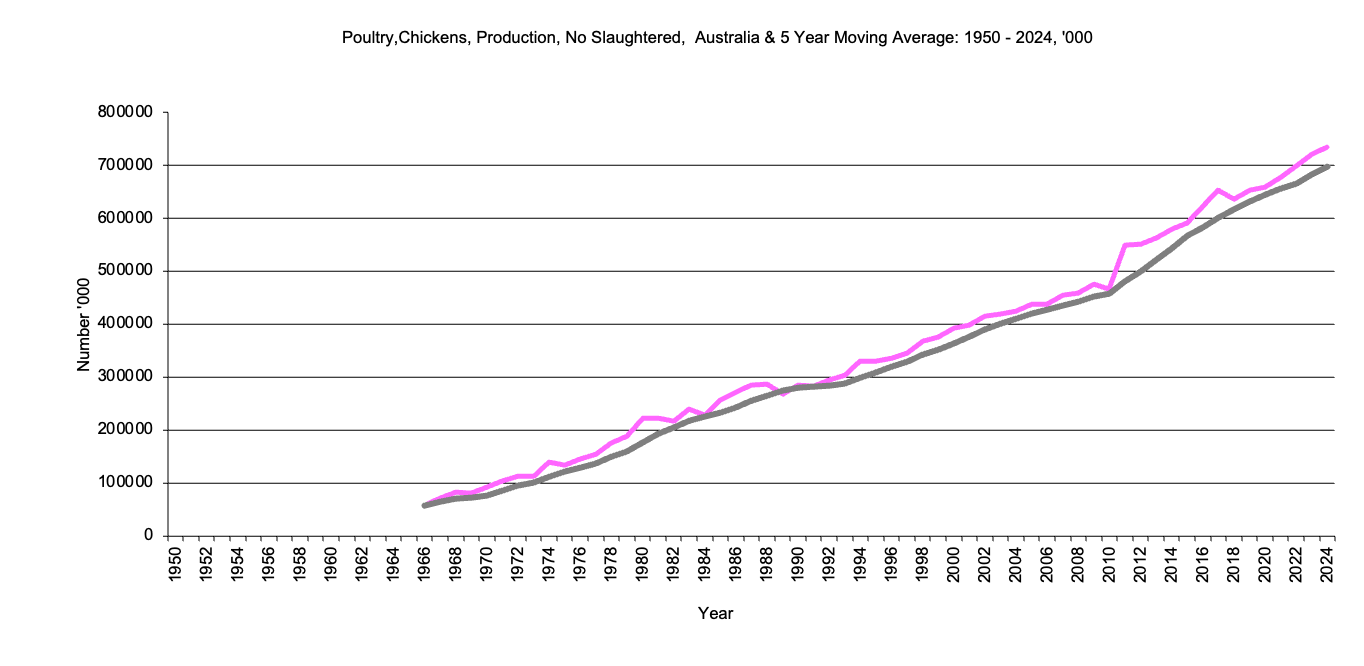
|
Number of poultry for meat '000, 5 year moving average. 
|
Number of poultry for meat graph |
Return to top of page |
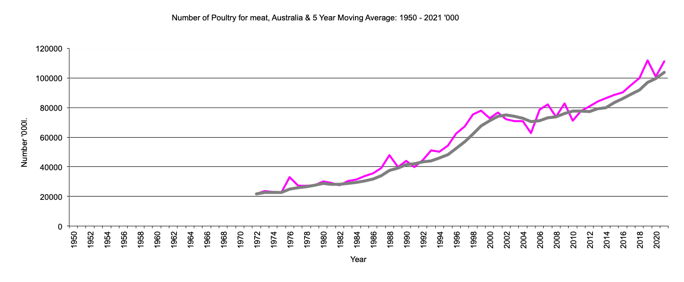
Data not available prior to 1972
|
Number of poultry for eggs '000, 5 year moving average. 
|
Number of poultry for eggs graph |
Return to top of page |
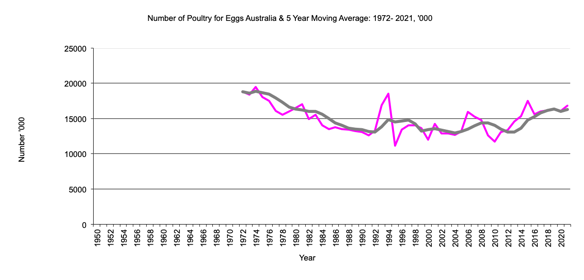
Data not available prior to 1972
Chickens Slaughtered
Data from 1950 to 1969 not published.
|
Chickens slaughtered, thousands, 5 year moving average 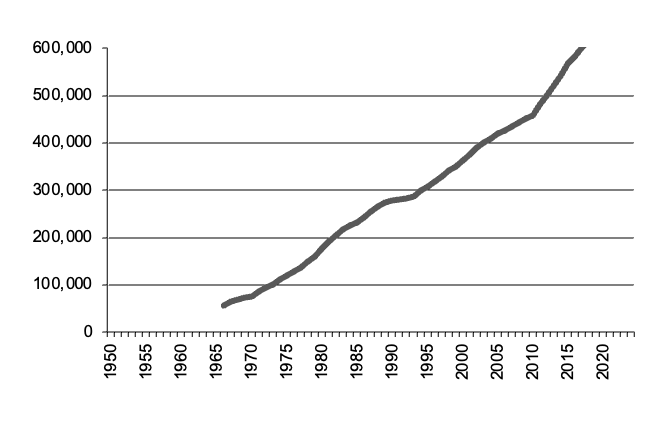
|
Number chickens slaughtere graph |
Return to top of page |
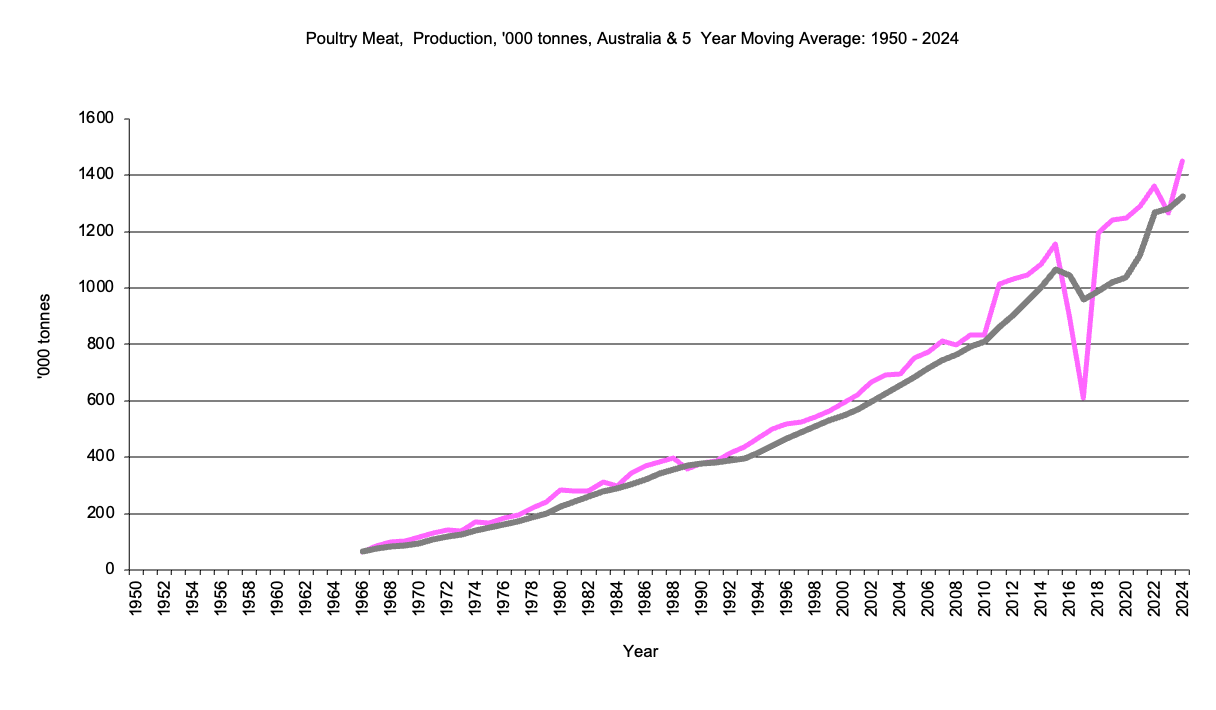
Poultry Meat Production
Data from 1950 to 1969 not published.
|
Poultry Meat Production, thousand tonnes. 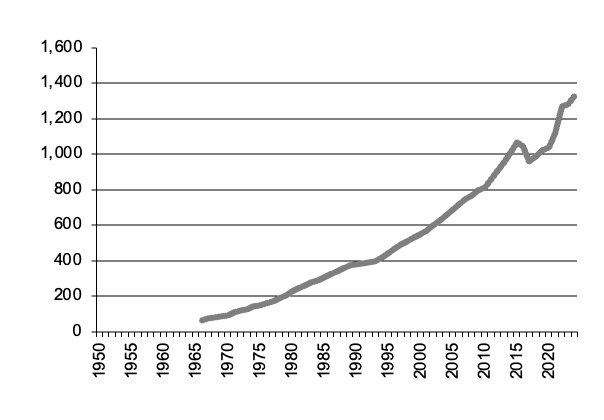
|
Poultry Meat Production graph |
Return to top of page |
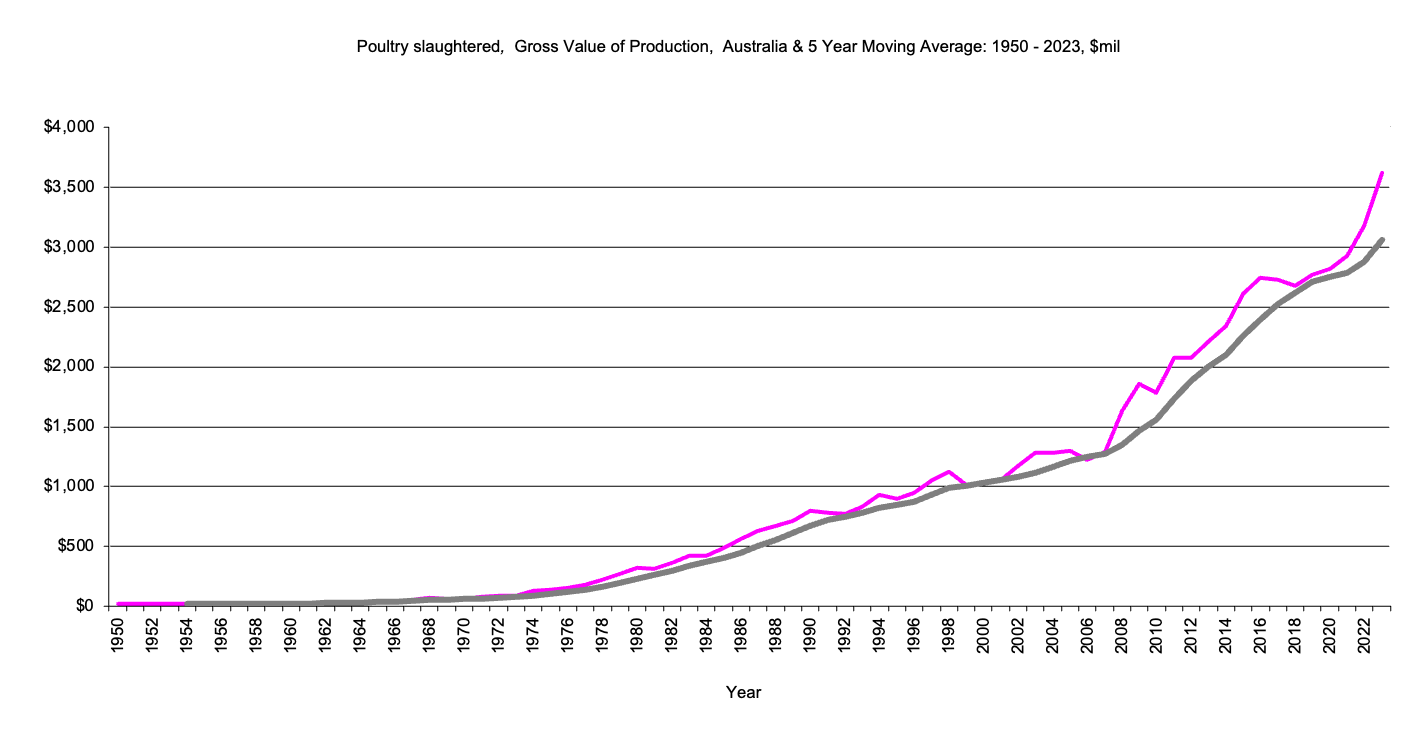
Poultry Slaughtered - Value of Production
|
Gross value production poultry slaughtered - $m, 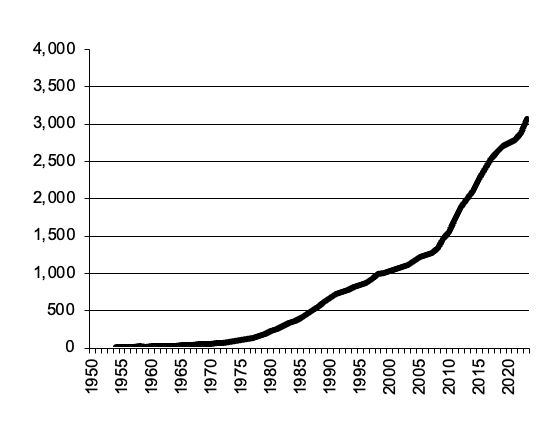
|
Poultry slaughtered Gross Value Production graph |
Return to top of page |
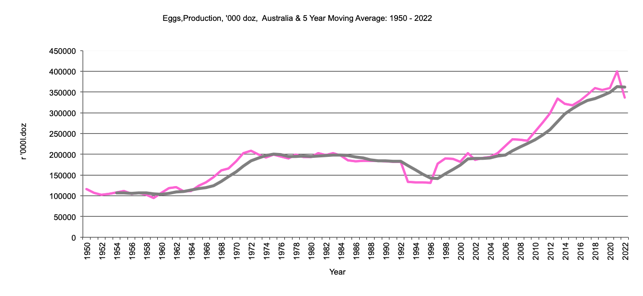
|
Poultry Egg Production in '000 doz. 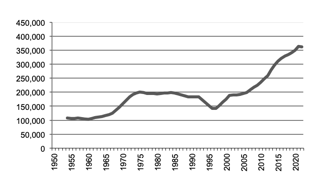
|
Egg Production graph |
Return to top of page |
|
Gross value production Eggs - $m, 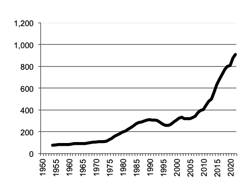
|
Eggs Gross Value Production graph |
Return to top of page |
AgEc Data
Last Updated 7 November 2024
Site prepared by Bob Cason (rgcason@webone.com.au)Email for more information