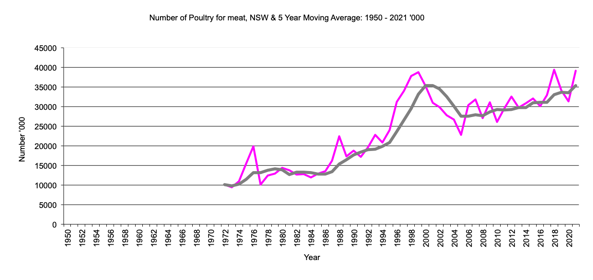
Number of poultry for meat in '000, 5 year moving average.
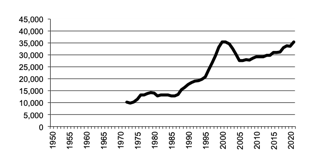
NSW Number of Poultry for Meat graph
NSW Number of Poultry for Meat data
Return to top of page
Back to Livestock
Back to front page
Data not available prior to 1972
|
|
NSW Poultry for Meat, Number
|
Number of poultry for meat in '000, 5 year moving average.
|
NSW Number of Poultry for Meat graph |
Return to top of page |
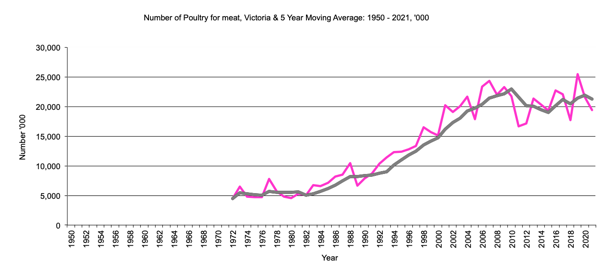
Victoria Poultry for Meat, Number
|
Number of poultry for meat in '000 , 5 year moving average. 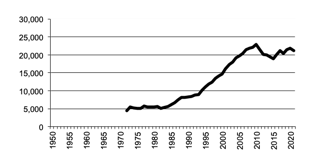
|
Victoria Number of Poultry for Meat graph |
Return to top of page |
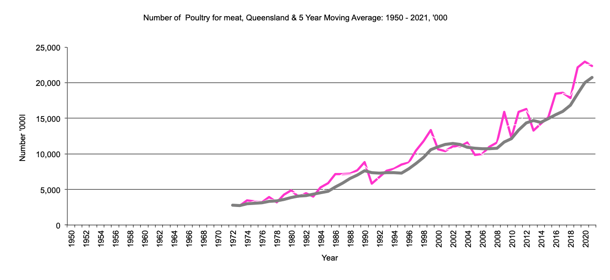
Queensland Poultry for Meat, Number
|
Number of poultry for meat in '000 , 5 year moving average. 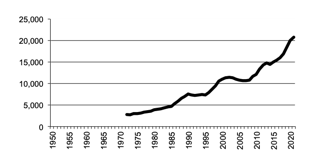
|
Queensland Number of Poultry for Meat graph |
Return to top of page |
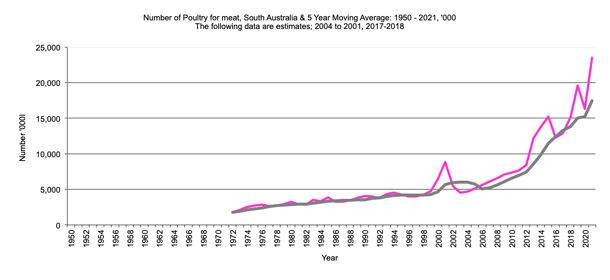
South Australia Poultry for Meat, Number
|
Number of poultry for meat in '000, 5 year moving average. 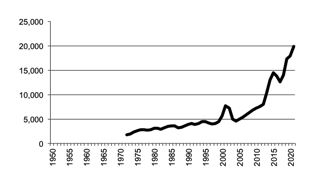
|
South Australia Number of Poultry for Meat graph |
Return to top of page |
Data from 2004 to 2020 not available for publication. These data are estimates.
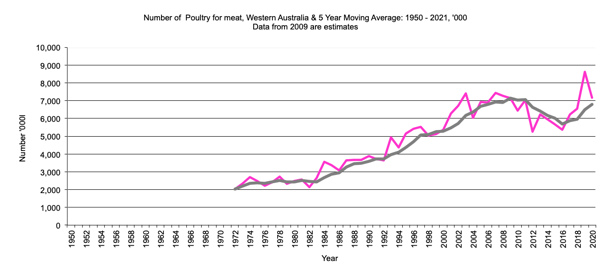
Western Australia Poultry for Meat, Number
|
Number of poultry for meat in '000 , 5 year moving average. 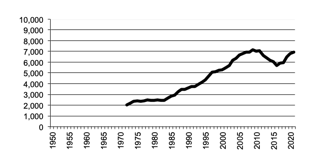
|
Western Australia Number of Poultry for Meat graph |
Return to top of page |
Data from 2010 to 2020 not available for publication. These data are estimates.
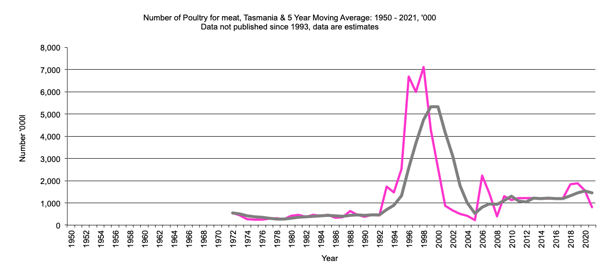
Tasmania Poultry for Meat, Number
|
Number of poultry for meat in '000 , 5 year moving average. 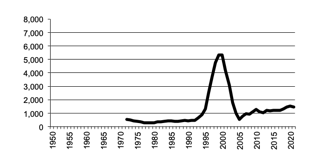
|
Tasmania Number of Poultry for Meat graph |
Return to top of page |
Data from 1993 to 2020 not available for publication. These data are estimates.
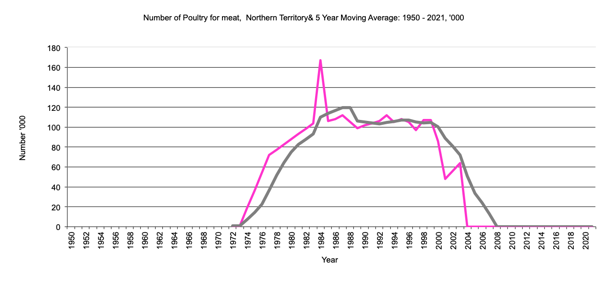
/font>Northern Territory Poultry for Meat, Number
|
Number of poultry for meat in '000 , 5 year moving average. 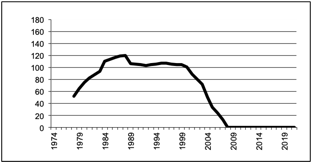
|
Northern Territory Number of Poultry for Meat graph |
Return to top of page |
Data from 1978 to 1982 and from 2004 not available for publication. These data are estimates.