"Wool production in tonnes.5 year moving average"
NSW Wool production graph
NSW Wool production data
Return to top of page
Back to Livestock
Back to front page
|
|
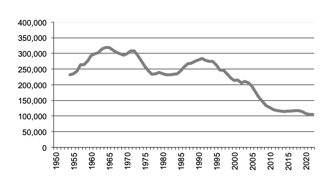
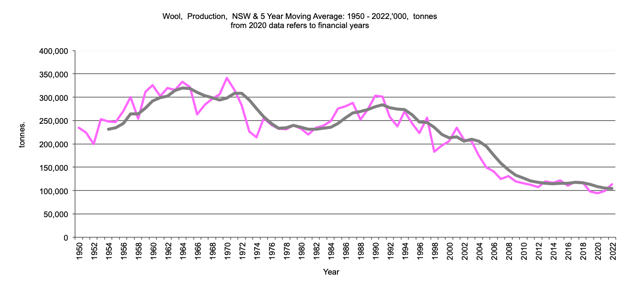
NSW, Wool Production
|
"Wool production in tonnes.5 year moving average"
|
NSW Wool production graph |
Return to top of page |
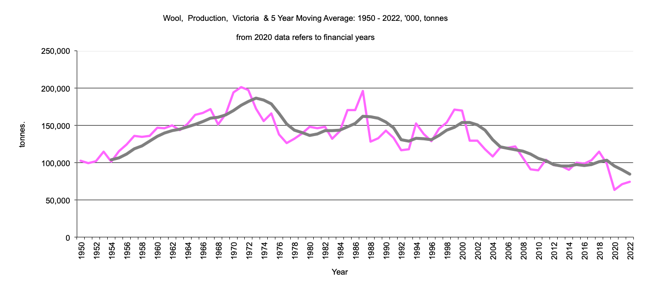
Victoria Wool Production
|
"Wool production in tonnes.5 year moving average" 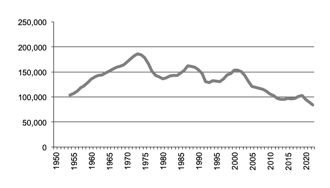
|
Victoria Wool production graph |
Return to top of page |
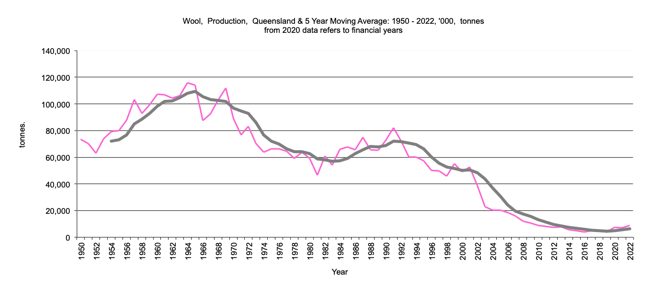
Queensland Wool Production
|
"Wool production in tonnes.5 year moving average" 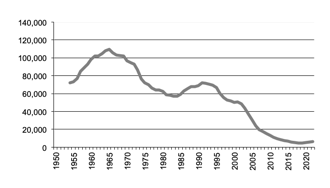
|
Queensland Wool production graph |
Return to top of page |
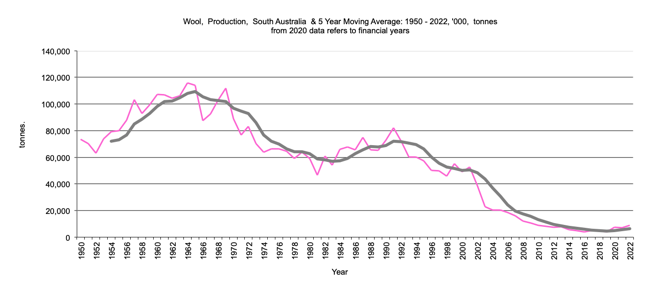
South Australia Wool Production
|
"Wool production in tonnes.5 year moving average" 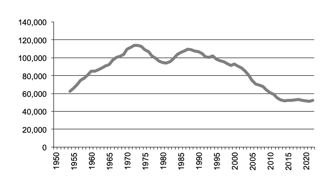
|
South Australia Wool production graph |
Return to top of page |
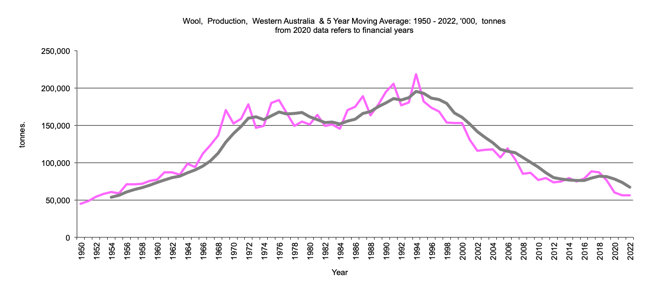
Western Australia Wool Production
|
"Wool production in tonnes.5 year moving average" 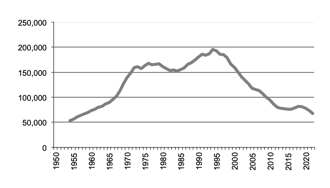
|
Western Australia Wool production graph |
Return to top of page |
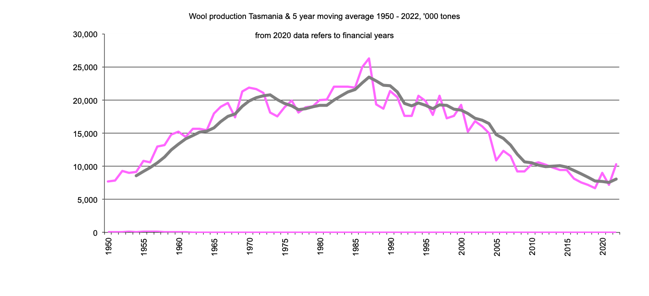
Tasmania Wool Production
|
"Wool production in tonnes.5 year moving average" 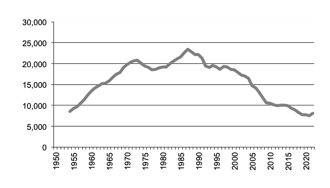
|
Tasmania Wool production graph |
Return to top of page |
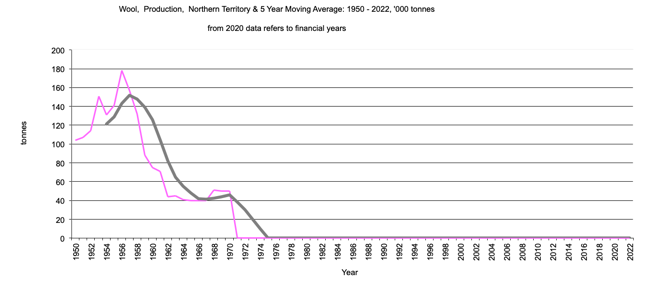
Northern Territory Wool Production
|
"Wool production in tonnes.5 year moving average" 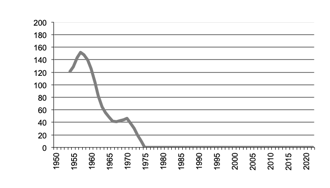
|
Northern Territory Wool production graph |
Return to top of page |