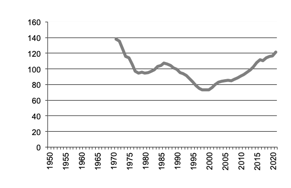
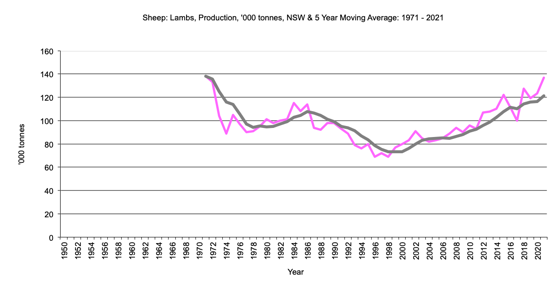
"Lamb production in '000 tonnes, 5 year moving average"
NSW Lamb P production graph
NSW Lamb P production data
Return to top of page
Back to Livestock
Back to front page
Agricultural Data for Australia, Lamb Production by State.
From 1950 to 1970, lamb production included in mutton production.
|
|
NSW, Lamb Production
|
"Lamb production in '000 tonnes, 5 year moving average"
|
NSW Lamb P production graph |
Return to top of page |
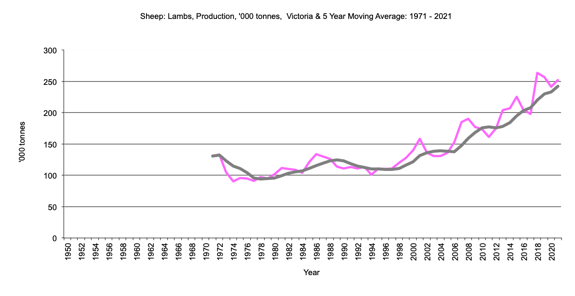
Victoria Lamb Production
|
"Lamb production in '000 tonnes, 5 year moving average" 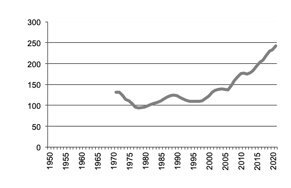
|
Victoria Lamb P production graph |
Return to top of page |
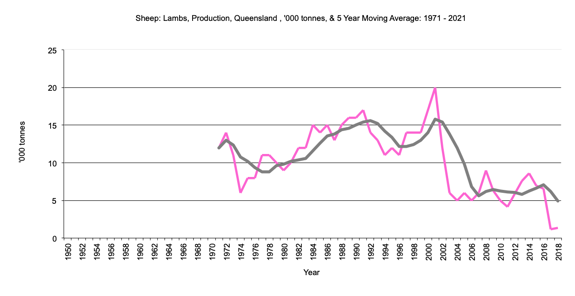
Queensland Lamb Production
|
"Lamb production in '000 tonnes, 5 year moving average." 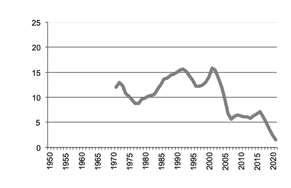
|
Queensland Lamb P production graph |
Return to top of page |
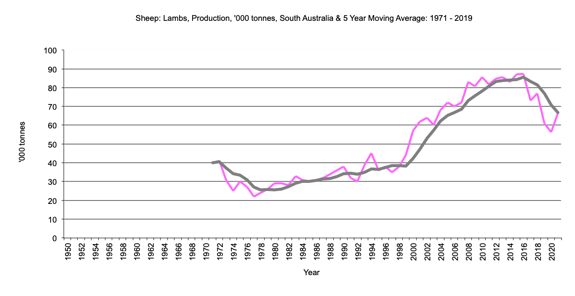
South Australia Lamb Production
|
"Lamb production in '000 tonnes, 5 year moving average" 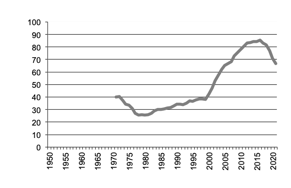
|
South Australia Lamb P production graph |
Return to top of page |
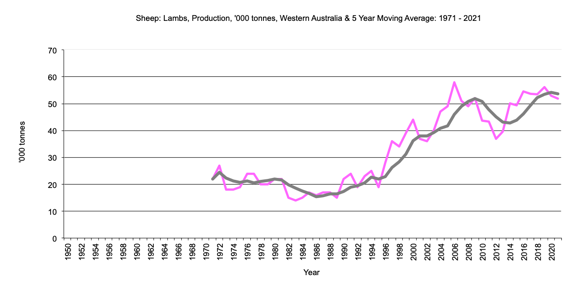
Western Australia Lamb Production
|
"Lamb production in '000 tonnes, 5 year moving average." 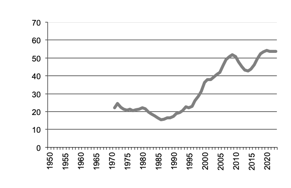
|
Western Australia Lamb P production graph |
Return to top of page |
Tasmania Lamb Production
|
"Lamb production in '000 tonnes, 5 year moving average." 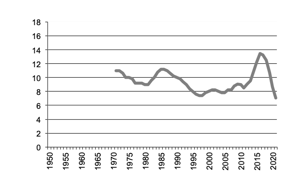
|
Tasmania Lamb P production graph |
Return to top of page |