Number of cattle slaughtered in thousands,
5 year moving average.
NSW Number of cattle slaughtered graph
NSW Number of cattle slaughtered data
Return to top of page
Back to Livestock
Back to front page
Agricultural Data for Australia, Cattle Production, Number Slaughtered by State.
Prior to 1971, cattle slaughtered includes calves slaughtered.
|
|
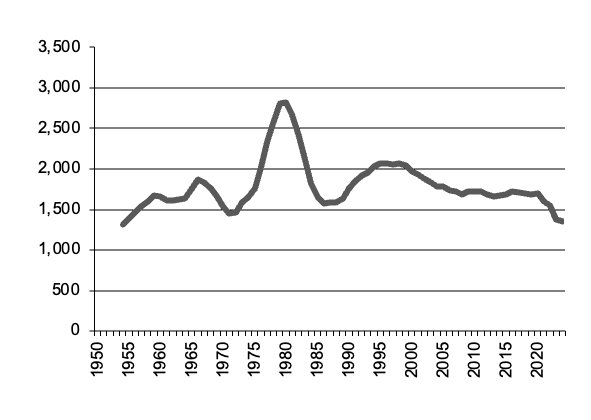
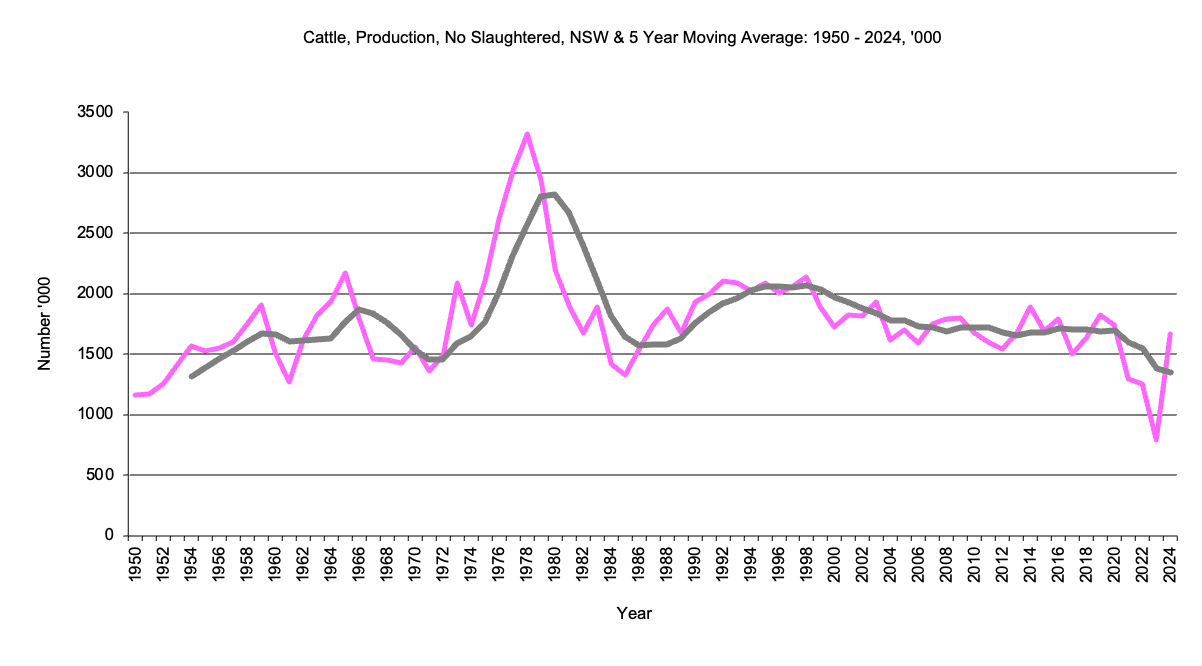
NSW, Cattle Production, Number Slaughtered
Prior to 1971 cattle slaughtered included calves slaughtered
|
Number of cattle slaughtered in thousands,
|
NSW Number of cattle slaughtered graph |
Return to top of page |
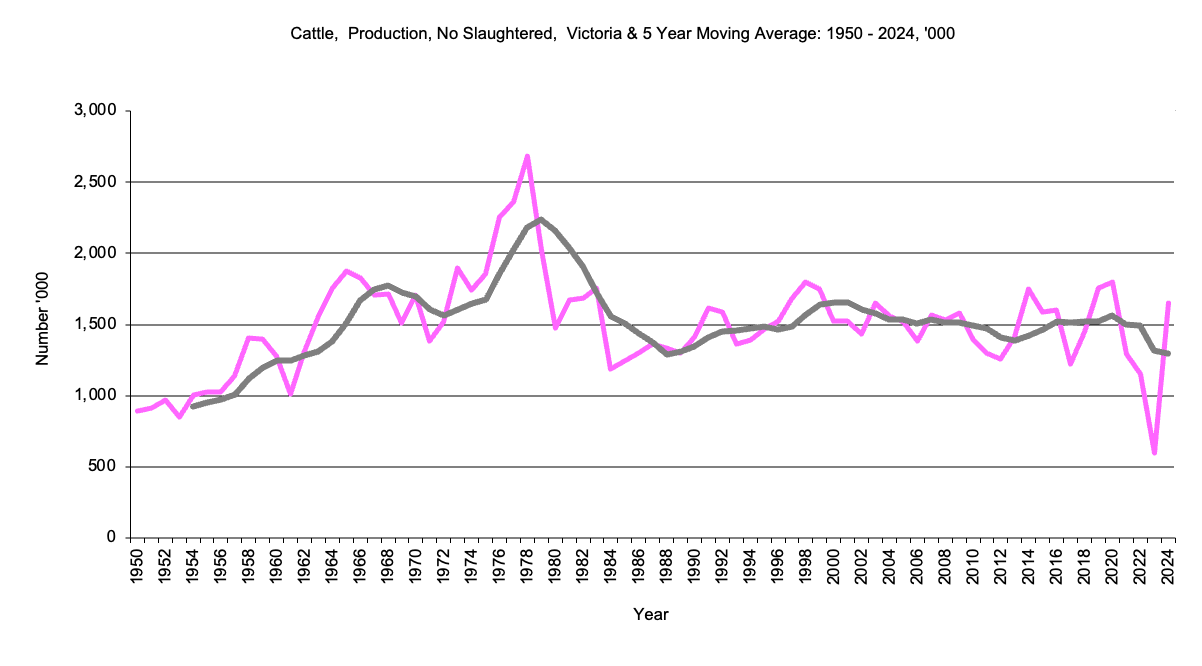
Victoria Cattle Production, Number Slaughtered
Prior to 1971 cattle slaughtered included calves slaughtered
|
Number of cattle slaughtered in thousands, 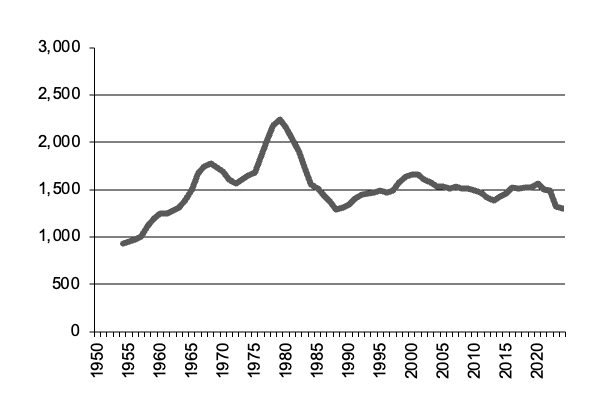
|
Victoria Number of cattle slaughtered graph |
Return to top of page |
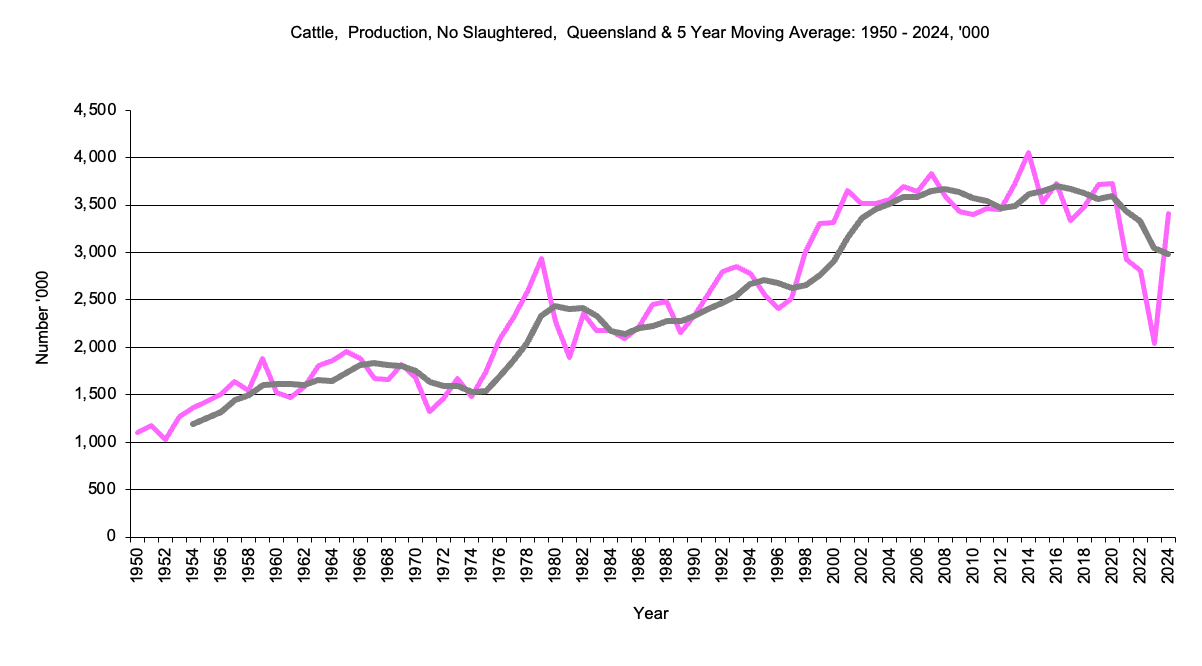
Queensland, Cattle Production, Number Slaughtered
Prior to 1971 cattle slaughtered included calves slaughtered
|
Number of cattle slaughtered in thousands, 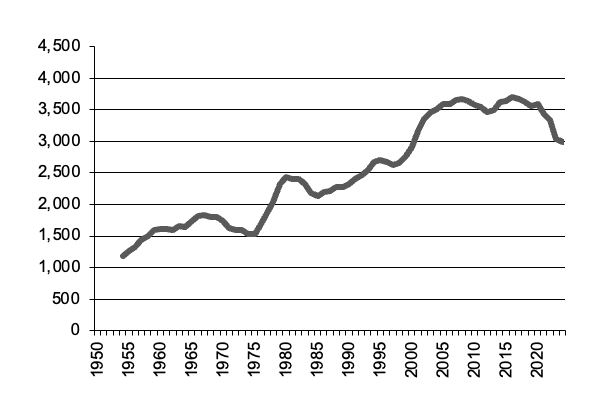
|
Queensland Number of cattle slaughtered graph |
Return to top of page |
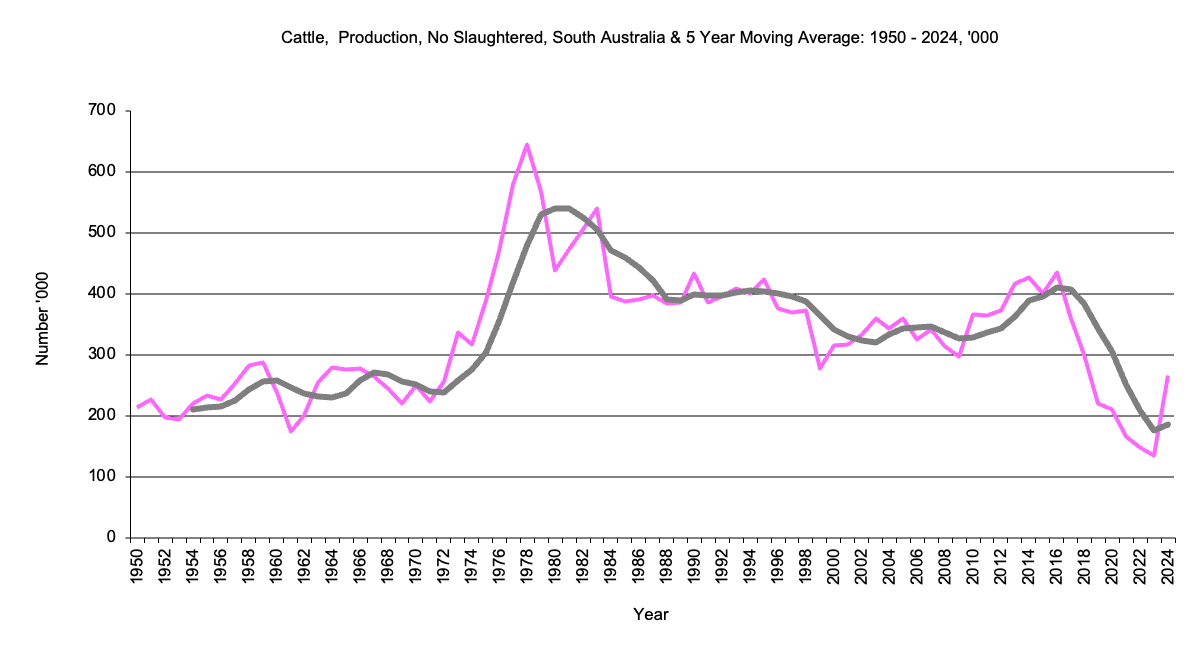
South Australia, Cattle Production, Number Slaughtered
Prior to 1971 cattle slaughtered included calves slaughtered
|
Number of cattle slaughtered in thousands, 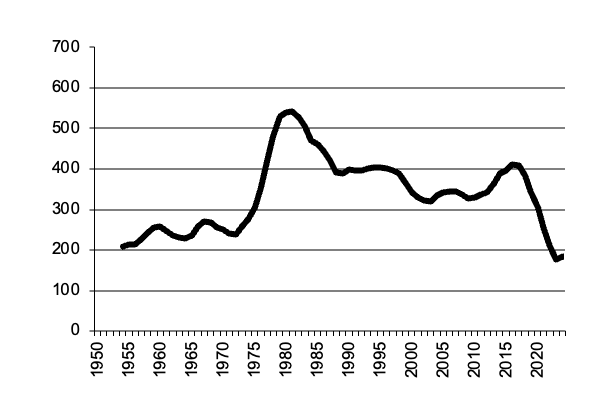
|
South Australia Number of cattle slaughtered graph |
Return to top of page |
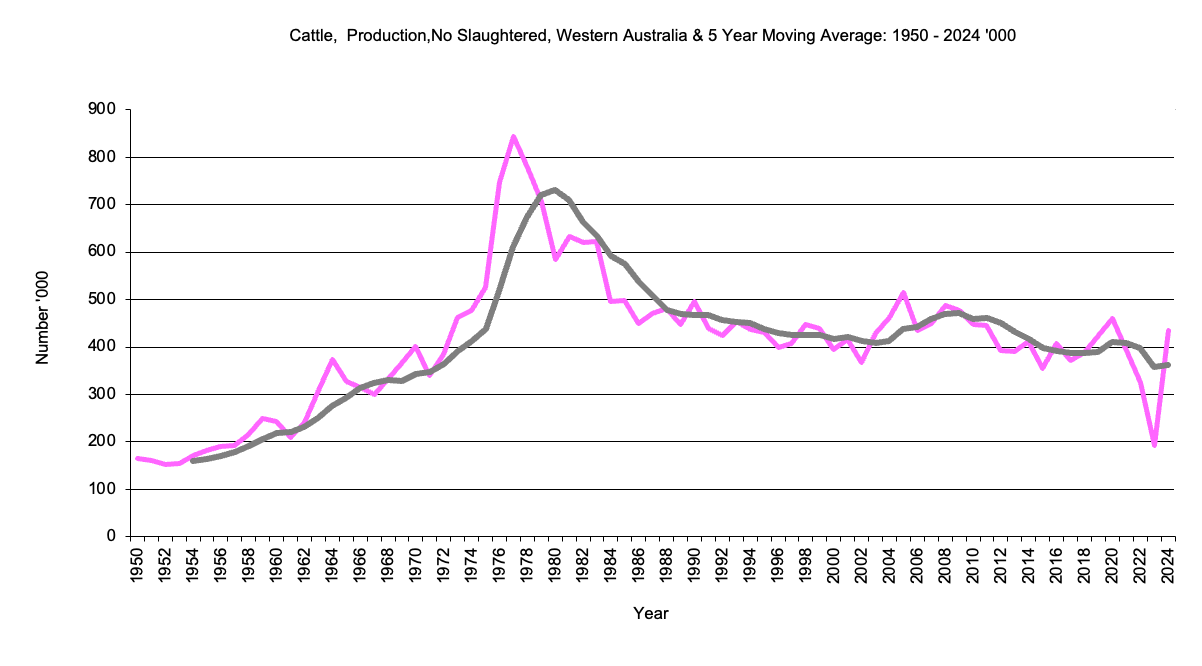
Western Australia Cattle Production, Number Slaughtered
Prior to 1971 cattle slaughtered included calves slaughtered
|
Number of cattle slaughtered in thousands, 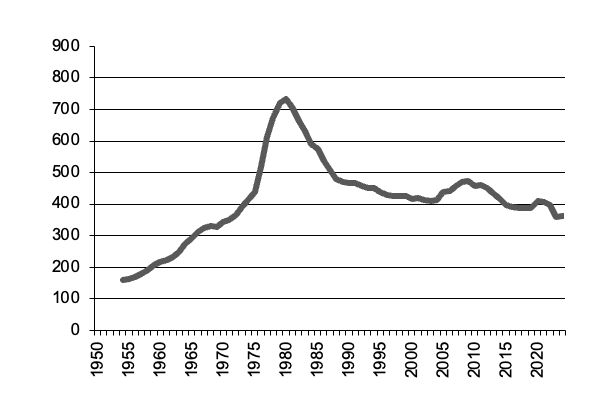
|
Western Australia Number of cattle slaughtered graph |
Return to top of page |
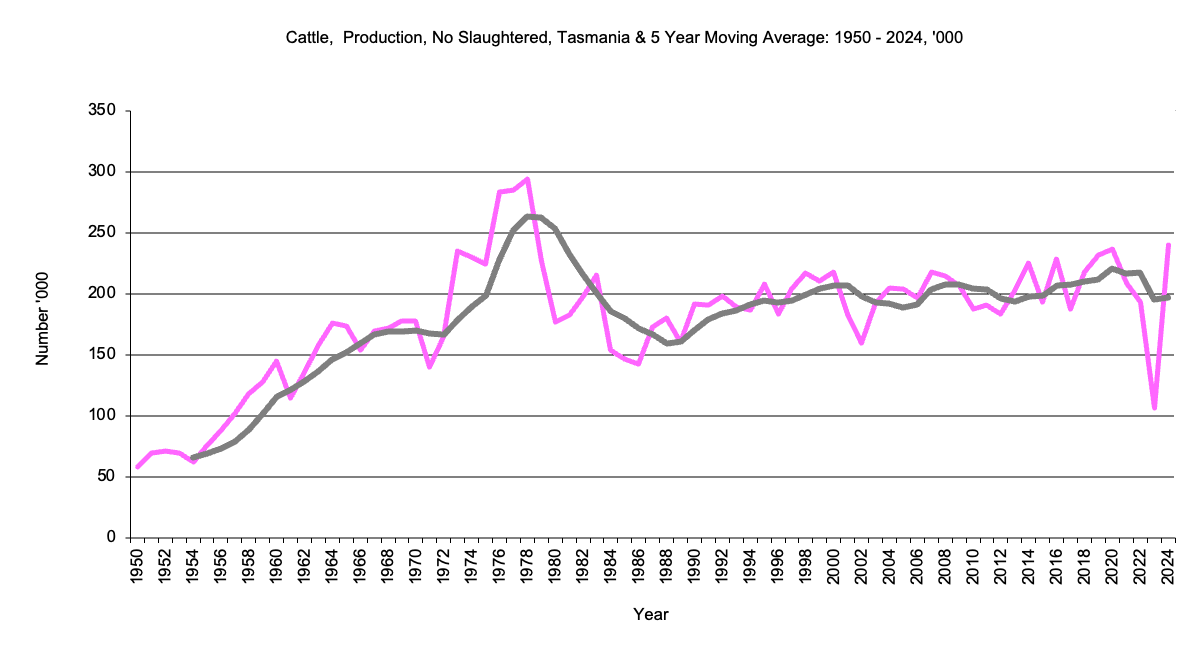
Tasmania, Cattle Production, Number Slaughtered
Prior to 1971 cattle slaughtered included calves slaughtered
|
Number of cattle slaughtered in thousands, 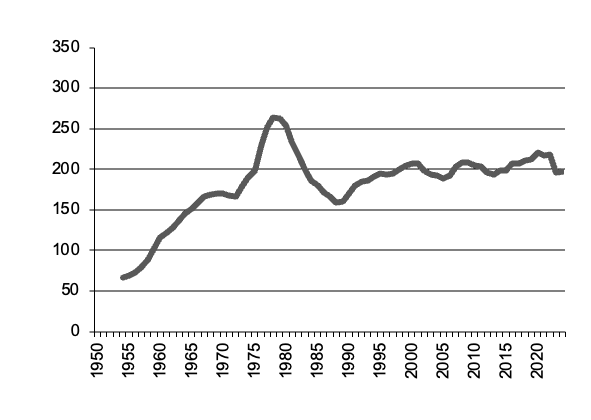
|
Tasmania Number of cattle slaughtered graph |
Return to top of page |
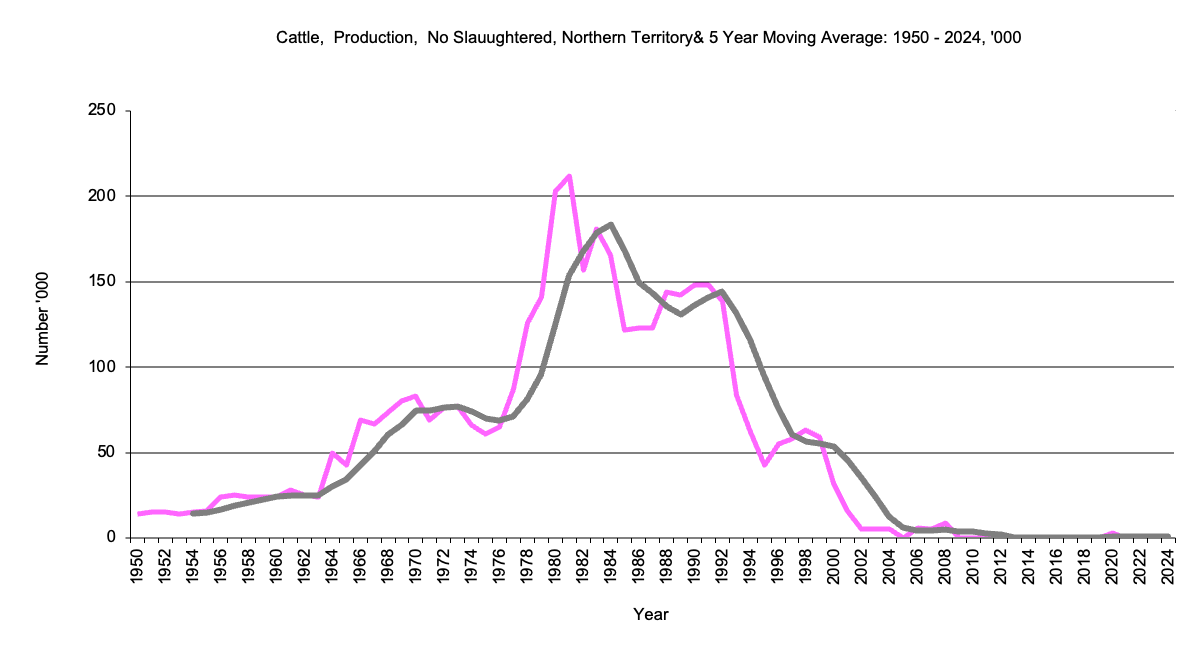
Northern Territory Cattle Production, Number Slaughtered
Prior to 1971 cattle slaughtered included calves slaughtered
|
Number of cattle slaughtered in thousands, 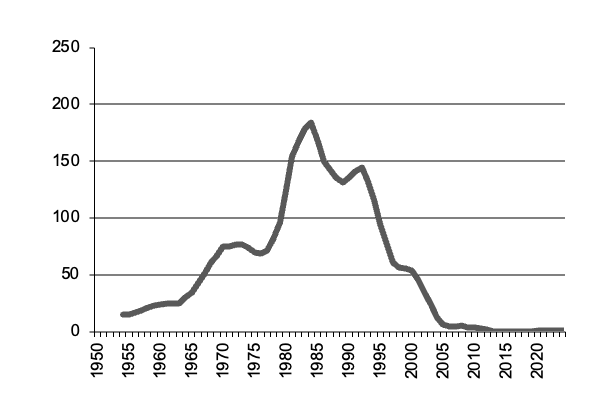
|
Northern Territory Number of cattle slaughtered graph |
Return to top of page |
Presumeably the decline in numbers slaughtered is due to live exports either overseas or interstate.