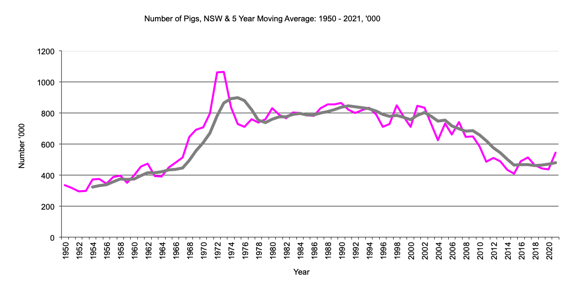
Number of pigs in '000, 5 year moving average.
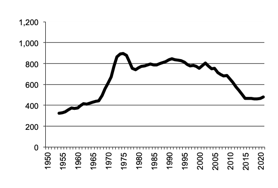
NSW Number of Pigs graph
NSW Number of Pigs data
Return to top of page
Back to Livestock
Back to front page
|
|
|
Number of pigs in '000, 5 year moving average.
|
NSW Number of Pigs graph |
Return to top of page |
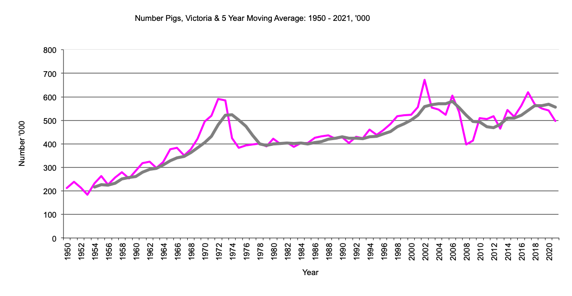
Victoria Pigs, Number
|
Number of pigs in '000,5 year moving average. 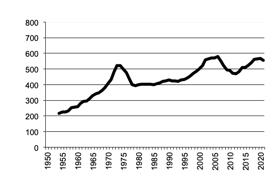
|
Victoria Number of Pigs graph |
Return to top of page |
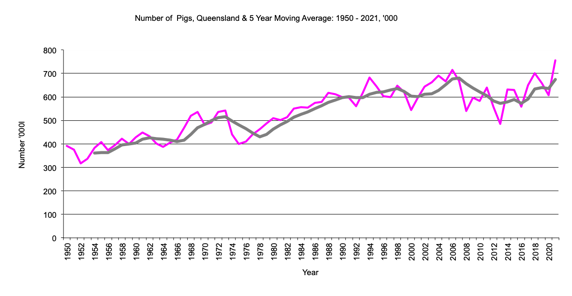
Queensland Pigs, Number
|
Number of pigs in '000,5 year moving average. 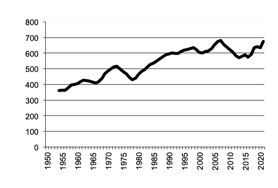
|
Queensland Number of Pigs graph |
Return to top of page |
Numbers have remained stable around 600,000 .Queensland has the highest number of pigs of all states and did not experience the spectacular peak in the early 1970's like the other states.
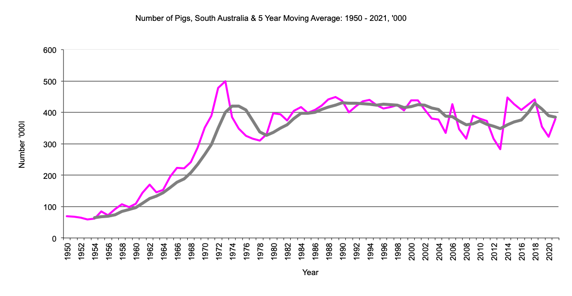
South Australia Pigs, Number
|
Number of pigs in '000, 5 year moving average. 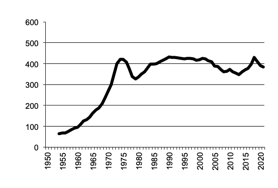
|
South Australia Number of Pigs graph |
Return to top of page |
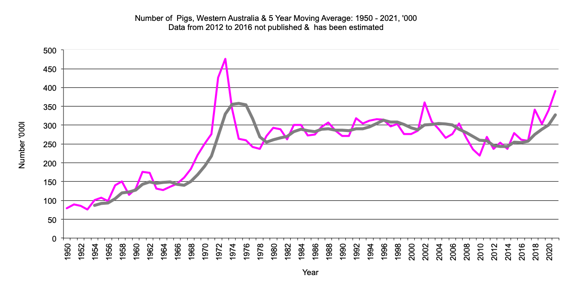
Western Australia Pigs, Number
|
Number of pigs in '000, 5 year moving average. 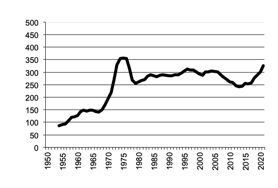
|
Western Australia Number of Pigs graph |
Return to top of page |
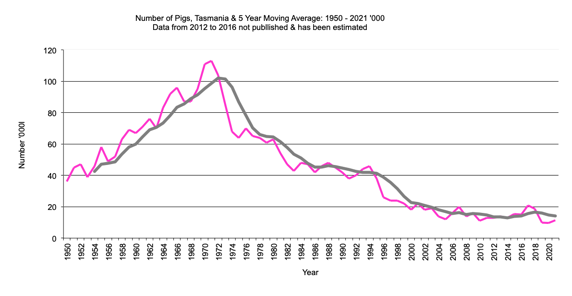
Tasmania Pigs, Number
|
Number of pigs in '000, 5 year moving average. 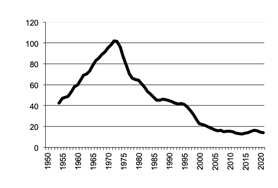
|
Tasmania Number of Pigs graph |
Return to top of page |
Unlike the other states numbers declined from the peak of the early 1970's.
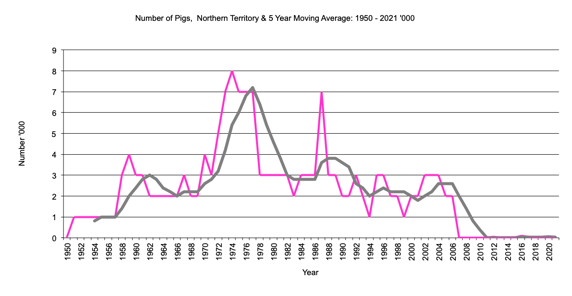
Northern Territory Pigs, Number
|
Number of pigs in '000, 5 year moving average. 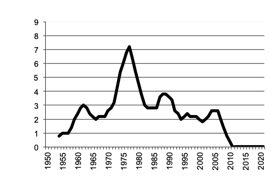
|
Northern Territory Number of Pigs graph |
Return to top of page |