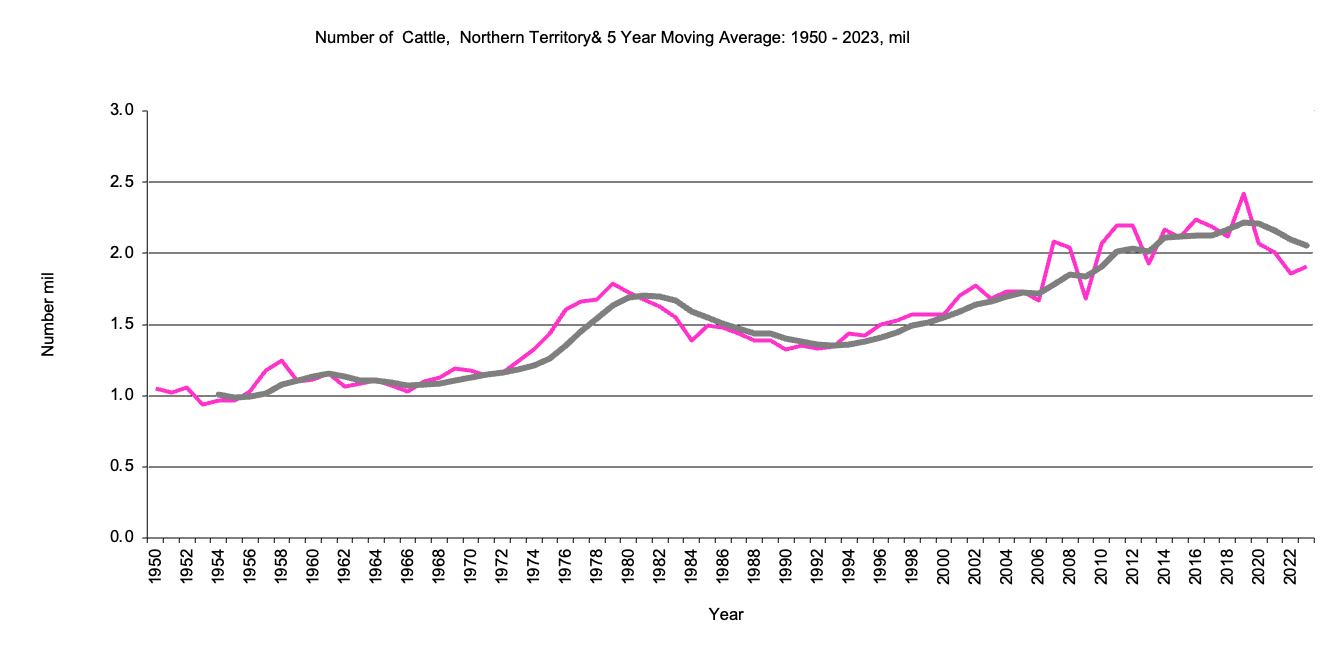
Number of cattle in millions
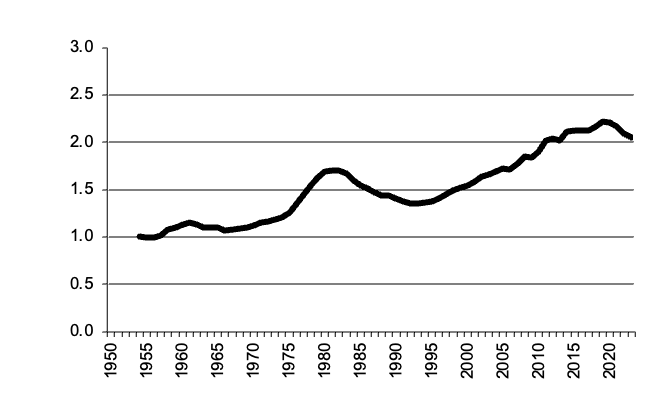
Cattle numbers graph
Cattle numbers data
Return to top of page
Back to data for States
Back to front page
This page has data for Northern Territory livestock numbers from 1950 to the present and the 5 year moving average. There is data for cattle, and pigs, & poultry
|
LIVESTOCK DATA FOR NORTHERN TERRITORY |
||
|
|
|
|
|
LIVESTOCK PRODUCTION FOR NORTHERN TERRITORY (number Slaughtered: production of meat, wool, eggs) |
|
|
|
|
|
|
|
|
|
|
Number of cattle in millions
|
Cattle numbers graph |
Return to top of page |
Northern Territory Milk Cattle
|
Number of milk cattle in thousandss 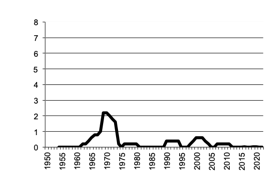
|
Milk Cattle numbers graph |
Return to top of page |
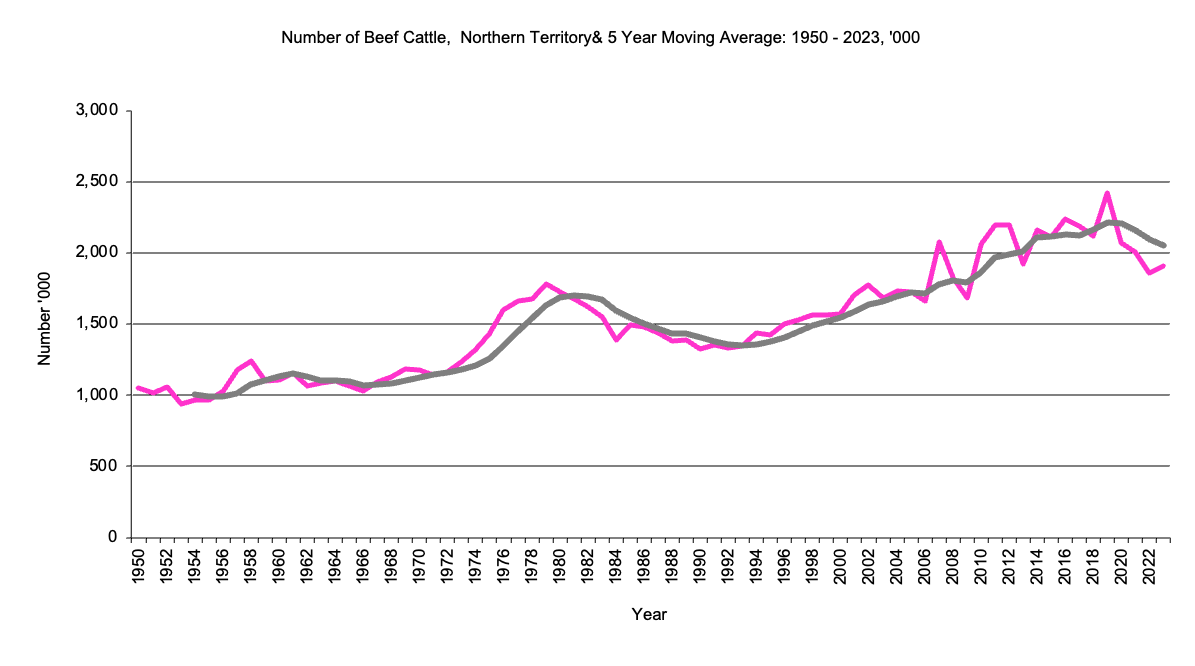
Northern Territory Beef Cattle
|
Number of beef cattle in millions 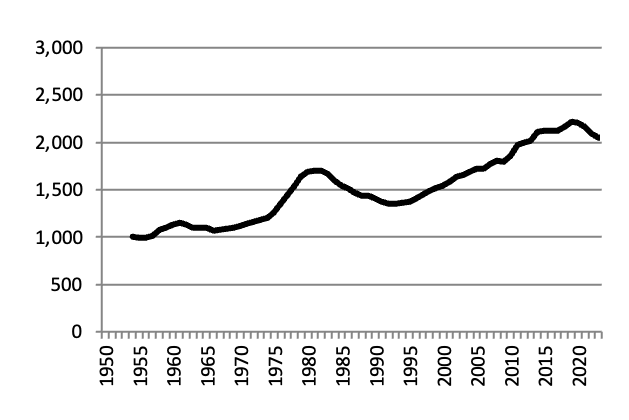
|
Number of beef cattle graph |
Return to top of page |
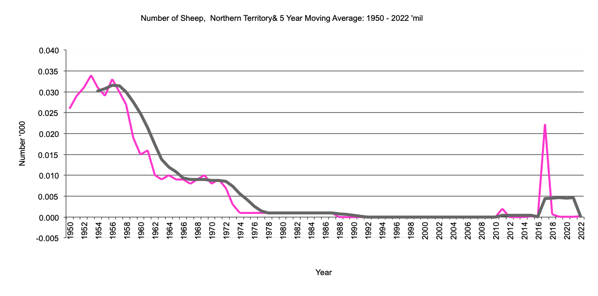
Northern Territory Sheep Numbers
|
Number of sheep in millions 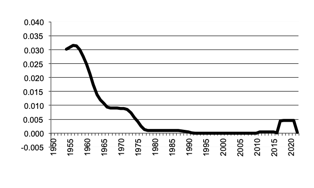
|
Number of beef cattle graph |
Return to top of page |
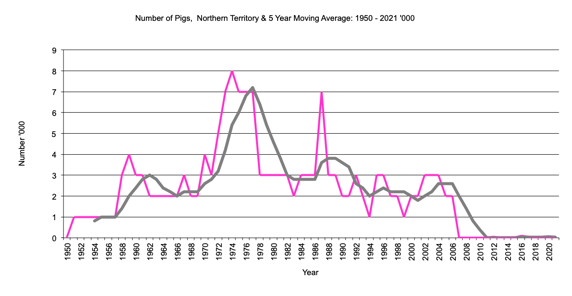
Northern Territory Pig Numbers
|
Number of pigs in thousands 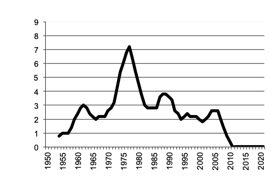
|
Number of pigs graph |
Return to top of page |
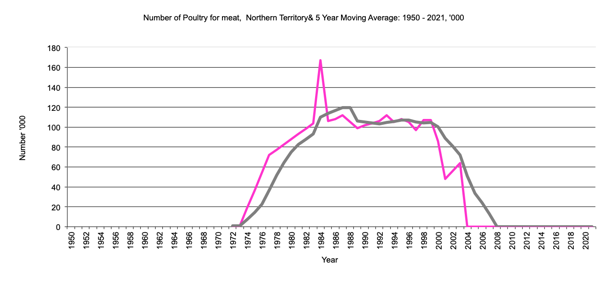
Northern Territory Poultry for Meat
|
Number of poultry for meat in thousands 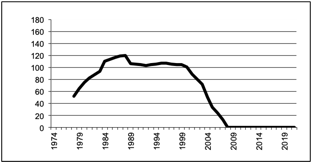
|
Number of poultry for meat graph |
Return to top of page |
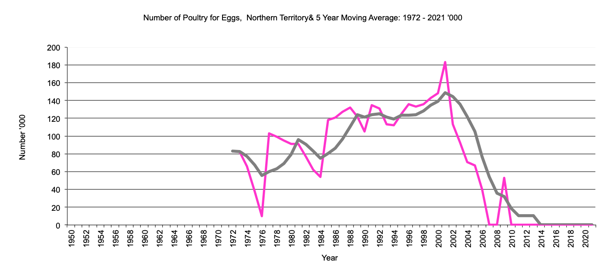
Northern Territory, Poultry for Eggs
|
Number of poultry for eggs in thousands 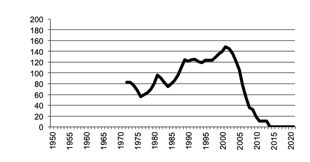
|
Number of poultry for eggs graph |
Return to top of page |
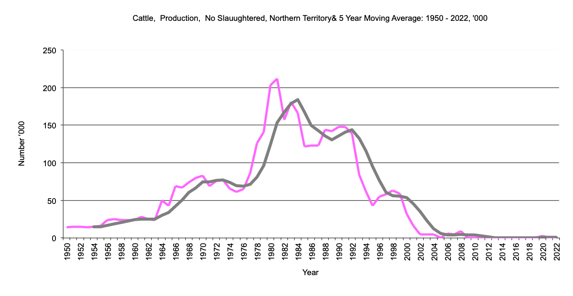
Northern Territory, Cattle, Number Slaughtered
|
Number of cattle slaughtered in thousands. 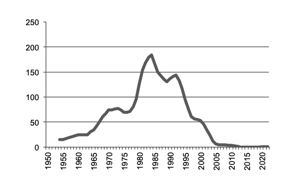
|
Northern Territory Number of cattle slaughtered graph |
Return to top of page |
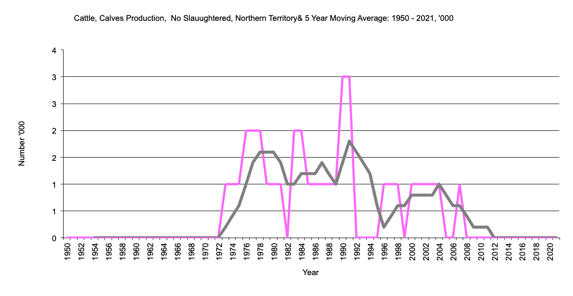
Northern Territory, Calves, Number Slaughtered
|
Number of calves slaughtered in thousands. 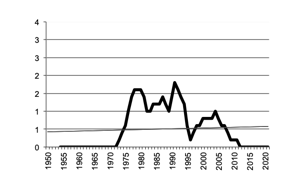
|
Northern Territory Number of calves slaughtered graph |
Return to top of page |
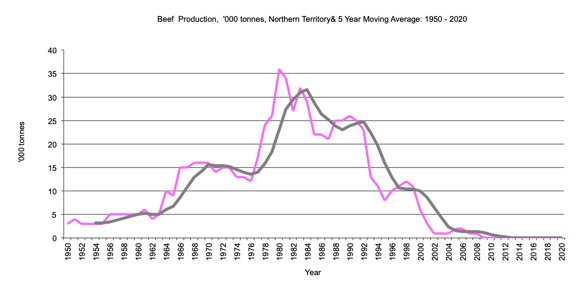
Northern Territory Beef Production
|
Beef production in thousand tonnes. 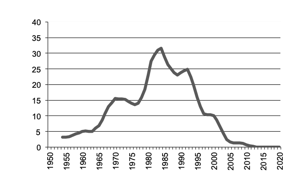
|
Northern Territory beef production graph |
Return to top of page |
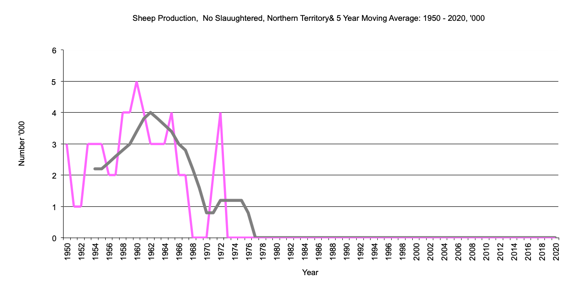
Northern Territory, Sheep, Number Slaughtered
|
Number sheep Slaughtered in thousands 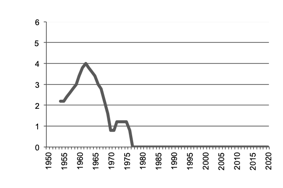
|
Northern Territory Number of sheep slaughtered graph |
Return to top of page |
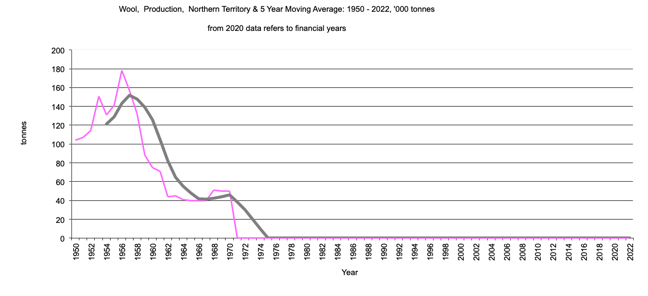
Northern Territory Wool Production
|
Wool production in tonnes 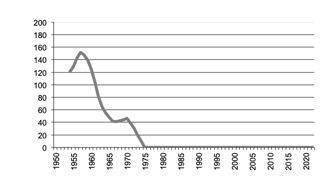
|
Northern Territory wool production graph |
Return to top of page |
Northern Territory Pigs, Number Slaughtered
|
Pigs, Number Slaughtered in thousands 
|
Northern Territory Number of pigs slaughtered graph |
Return to top of page |
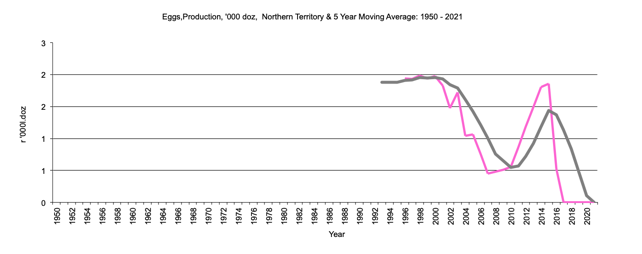
Northern Territory Egg Production
|
Egg Production in thousand dozen 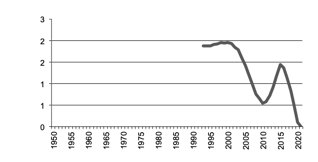
|
Northern Territory egg production graph |
Return to top of page |
Northern Territory Total Livestock Slaughtered Gross Value of Production
|
Total Livestock Slaughtered Gross Value of production, $m 
|
Total Livestock Slaughtered,Gross Value Production graph |
Return to top of page |
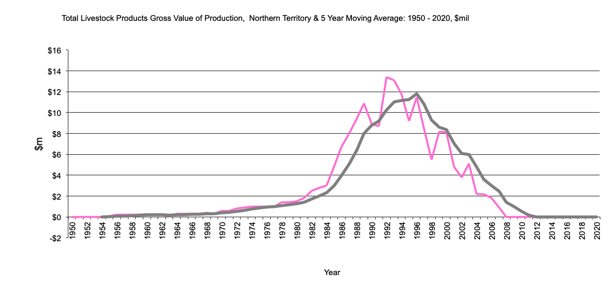
Northern Territory Total Livestock Products - Gross Value of Production
|
Total Livestock Products - Gross Value of production, $m 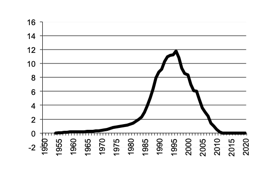
|
Northern Territory Total Livestock Products Gross Value Production graph |
Return to top of page |
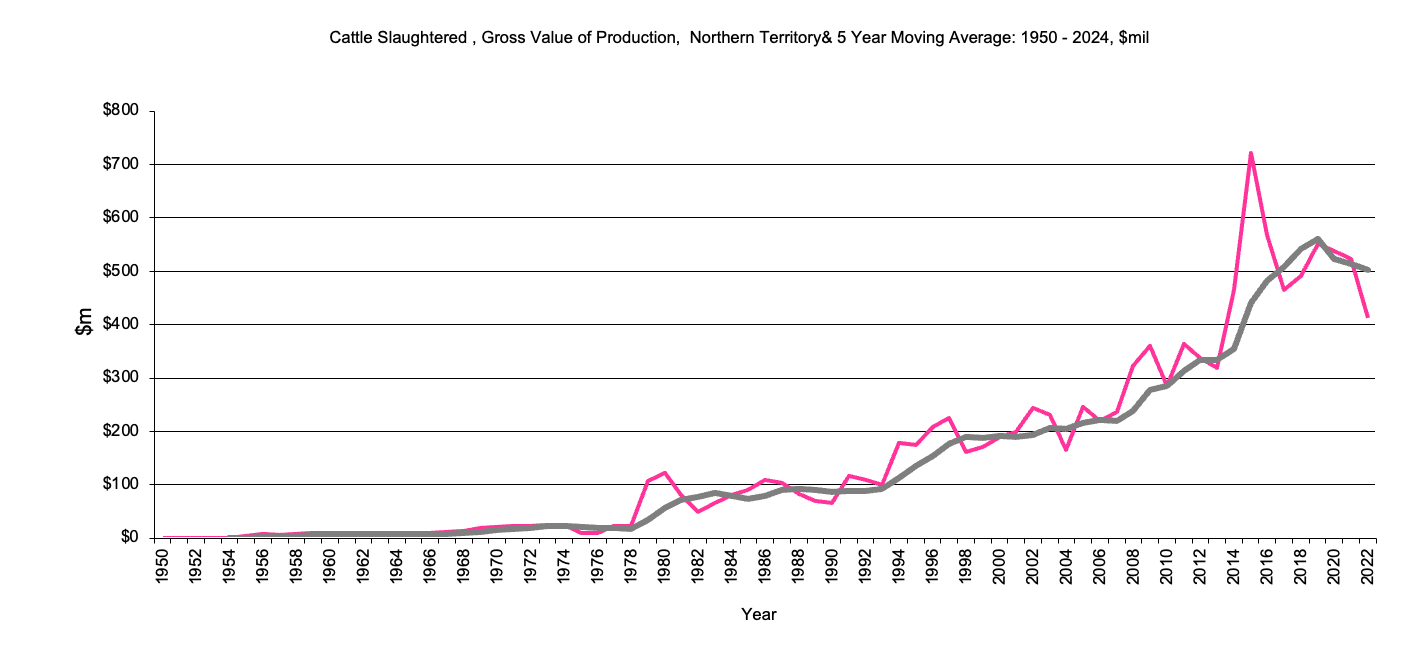
Northern Territory Cattle - Gross Value of Production
|
Gross Value of Production in $ millions. 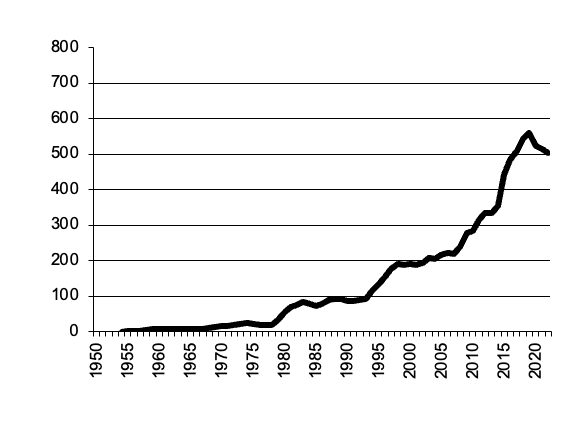
|
Northern Territory Cattle gross value production graph |
Return to top of a page |
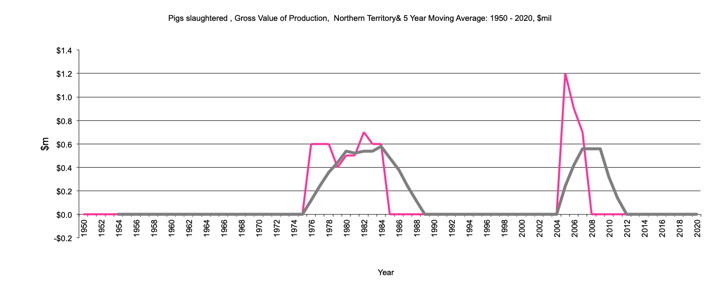
Northern Territory, Pigs, Gross Value Production
|
Gross Value of Production in $ millions. 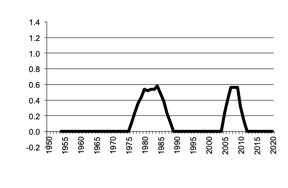
|
Pigs gross value production graph Pigs gross value production data |
Return to top of a page |