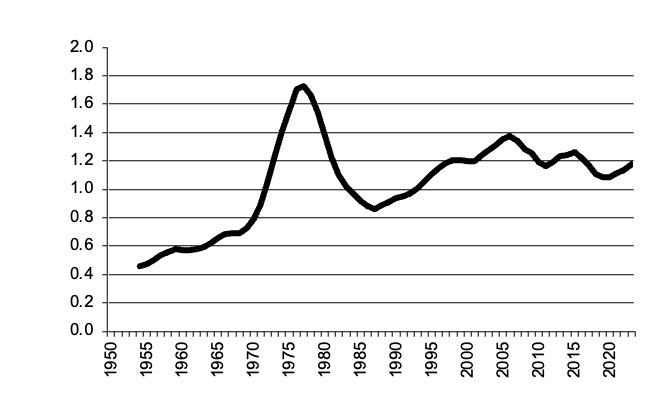
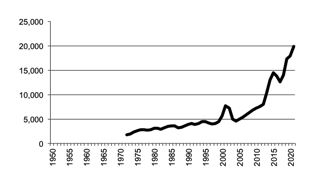
Number of cattle in millions
Cattle numbers graph
Cattle numbers data
Return to top of page
Back to data for States
Back to front page
This page has data for South Australian livestock numbers from 1950 to the present and the 3 year moving average. There is data for cattle, sheep, poultry and pigs. Data for production will be added later.
|
LIVESTOCK DATA FOR SOUTH AUSTRALIA |
||
|
|
|
|
|
|
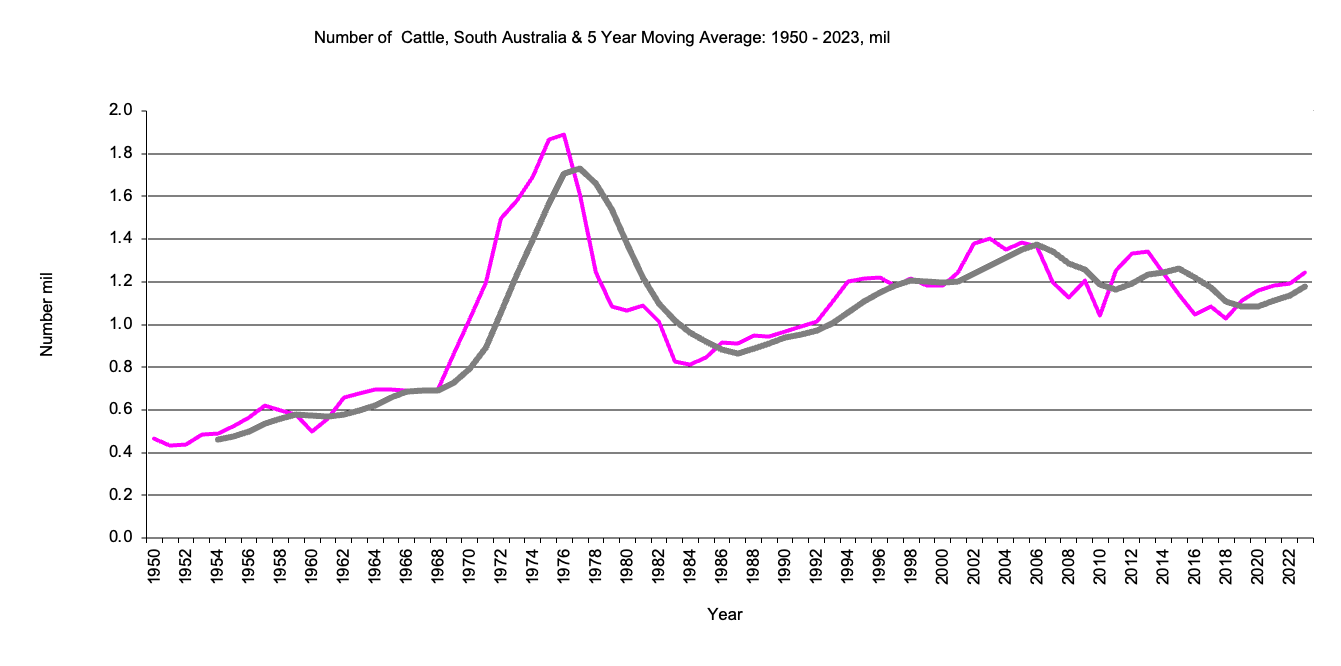
Number of cattle in millions
|
Cattle numbers graph |
Return to top of page |
|
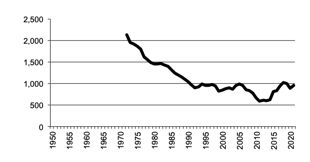
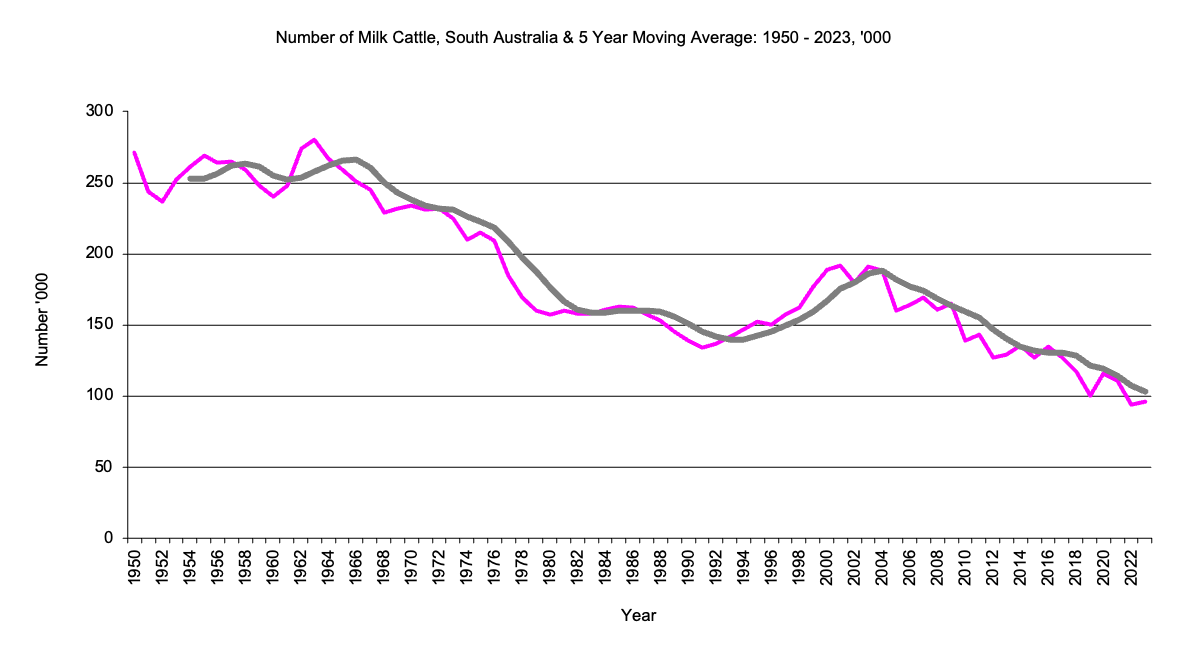
Number of milk cattle in thousands 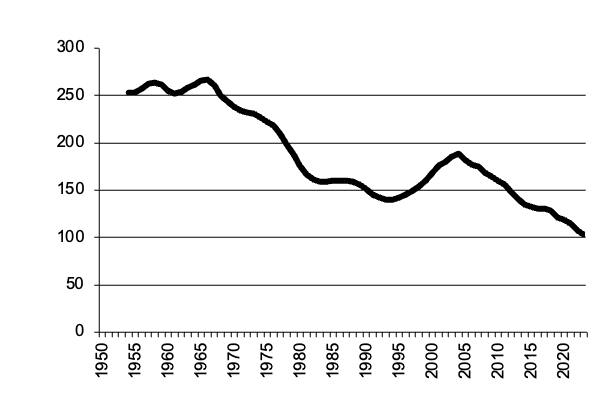
|
Number of milk cattle graph |
Return to top of page |
|
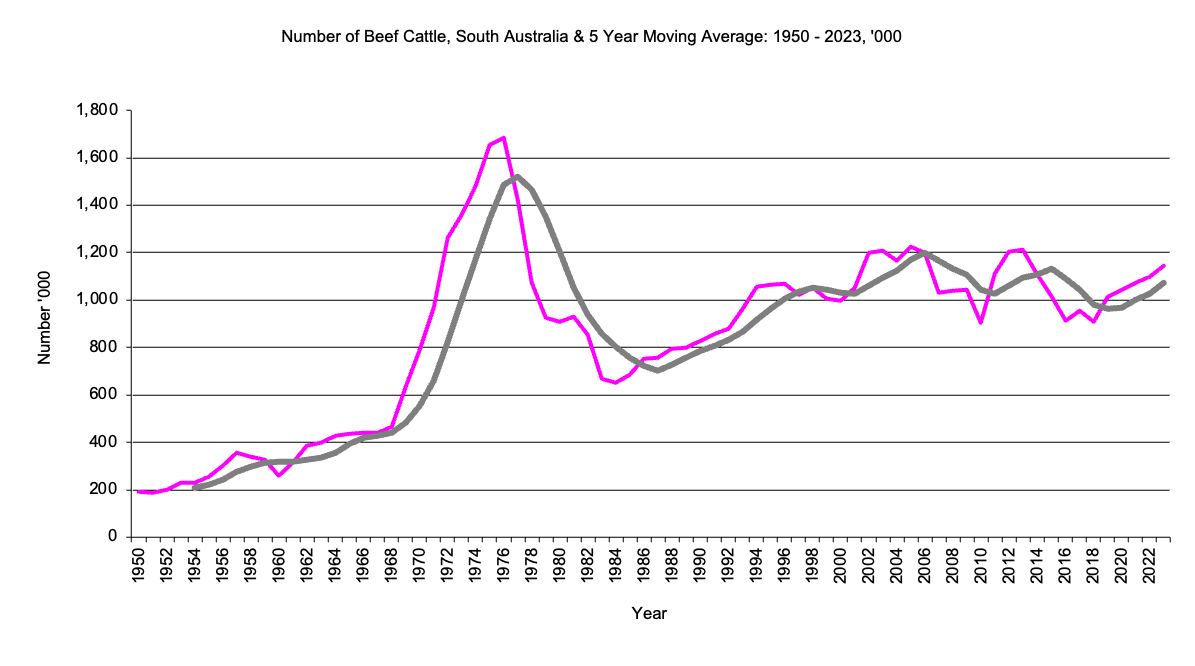
Number of beef cattle in millions 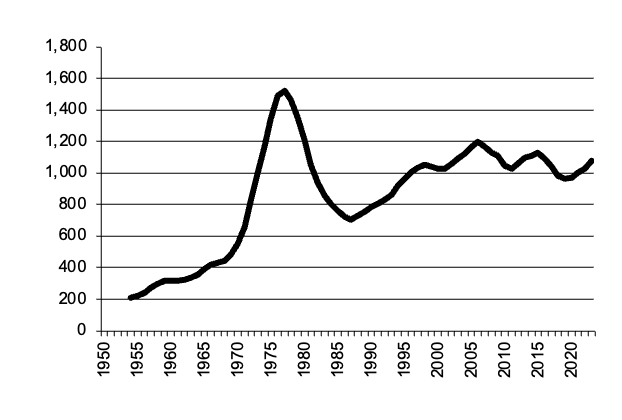
|
Number of beef cattle graph |
Return to top of page |
|
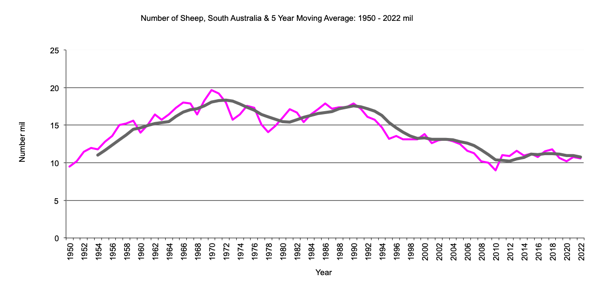
Number of sheep in millions 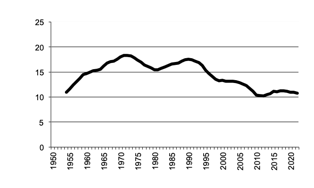
|
Number of sheep graph |
Return to top of page |
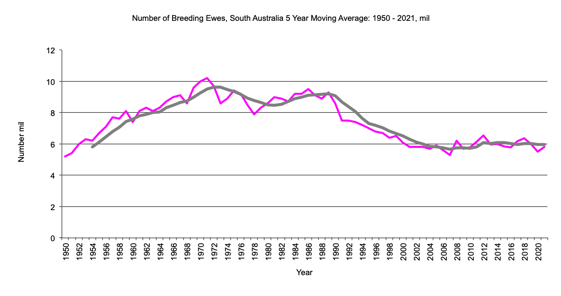
South Australia Sheep - Number - Breeding Ewes
|
Number of sheep - breeding ewes - in millions. 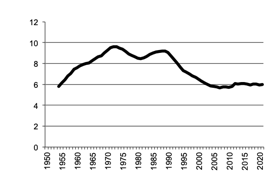
|
Number of Sheep - Breeding Ewes graph |
Return to top of page |
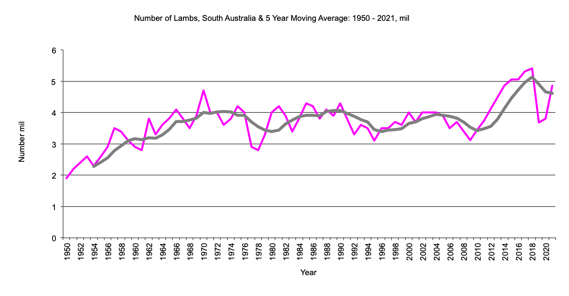
South Australia - Number - Lambs
|
Number of sheep - lambs - in millions. 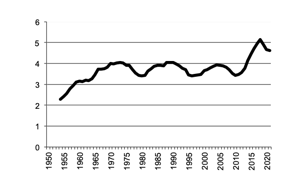
|
Number of Sheep - Lambs graph |
Return to top of page |
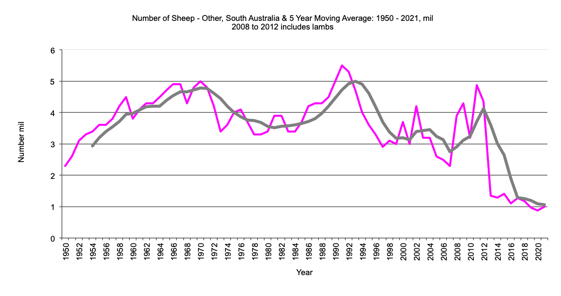
South Australia Sheep - Number - Other
|
Number of sheep - other - in millions. 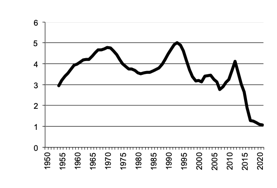
|
Number of Sheep - Other graph |
Return to top of page |
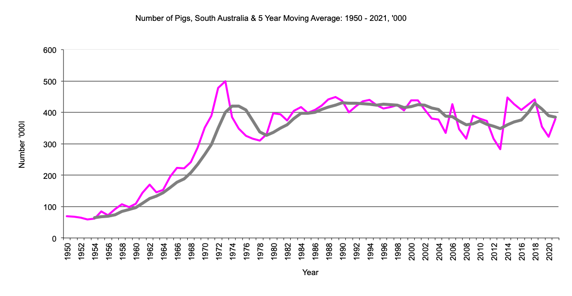
|
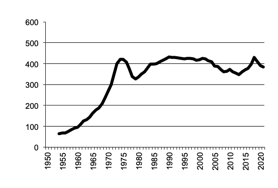
Number of pigs in thousands
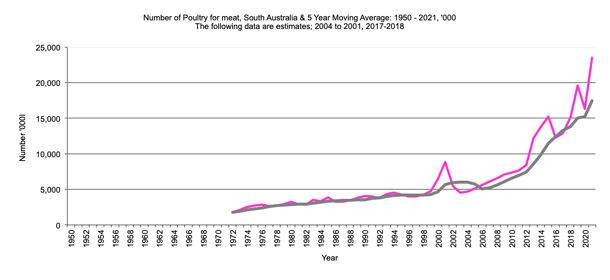
South Australia, Poultry for Meat
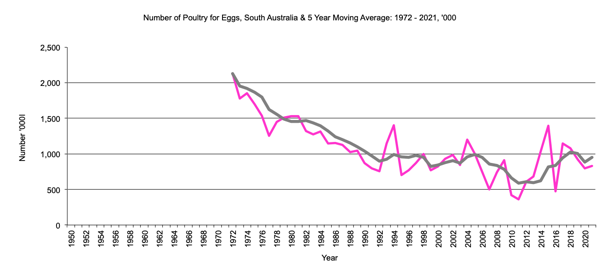
South Australia, Poultry for Eggs
Ag Data Last Updated 25 October 2023 Site prepared by Bob Cason (rgcason@webone.com.au)Email for more information |