Number of cattle in thousands
Cattle numbers graph
Cattle numbers data
Return to top of page
Back to data for States
Back to front page
This page has data for Tasmanian livestock numbers from 1950 to the present and the 5 year moving average. There is data for cattle, sheep, poultry and pigs.
|
LIVESTOCK DATA FOR TASMANIA |
||
|
|
|
|
|
|
LIVESTOCK PRODUCTION FOR TASMANIA (number Slaughtered: production of meat, wool, eggs) |
|
|
|
|
|
|
|
|
|
|
|
|
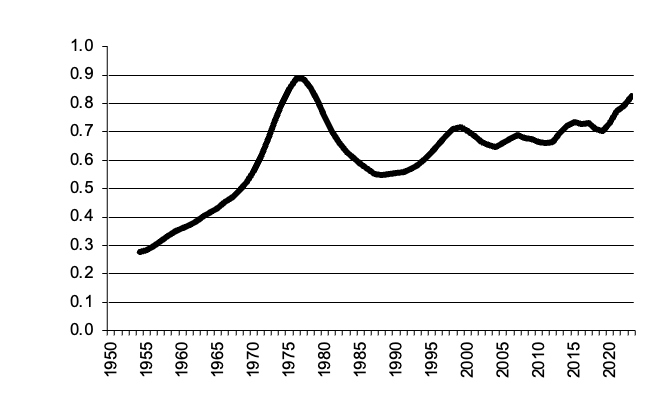
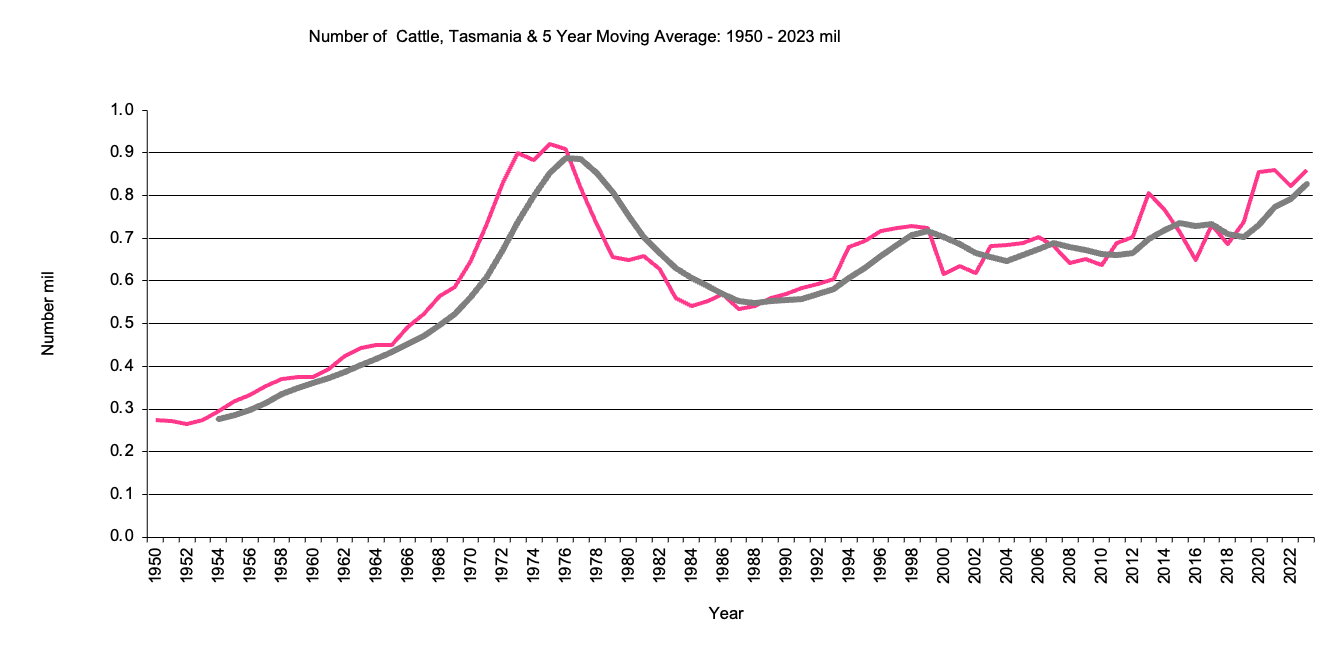
Number of cattle in thousands
|
Cattle numbers graph |
Return to top of page |
|
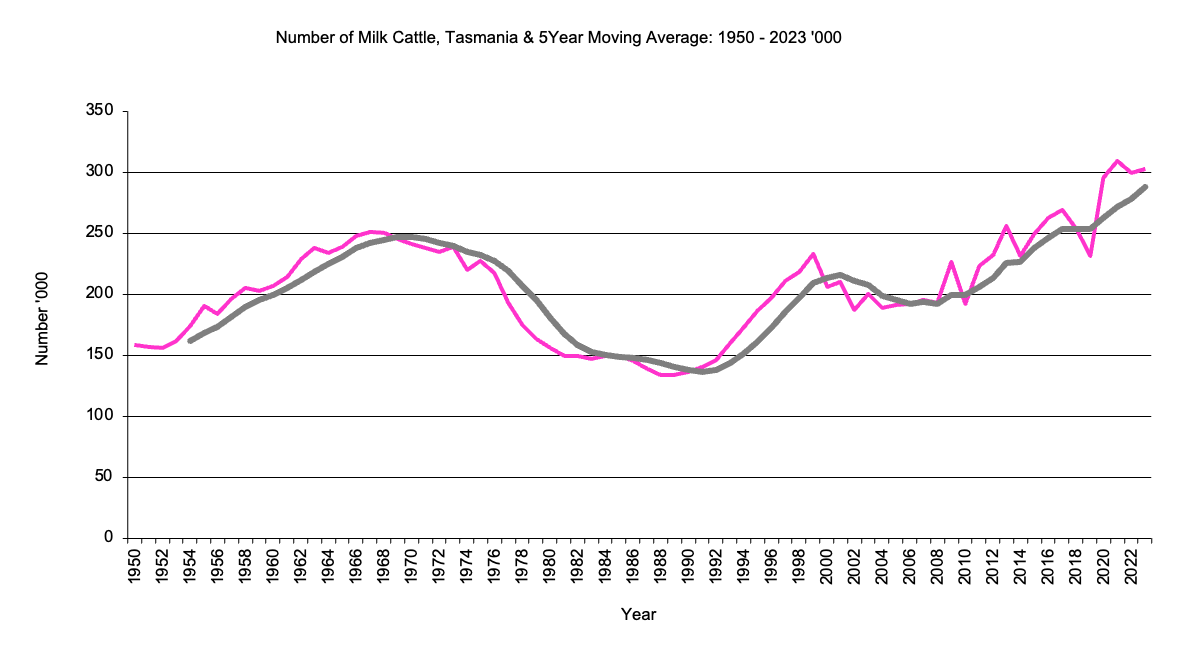
Number of milk cattle in thousands 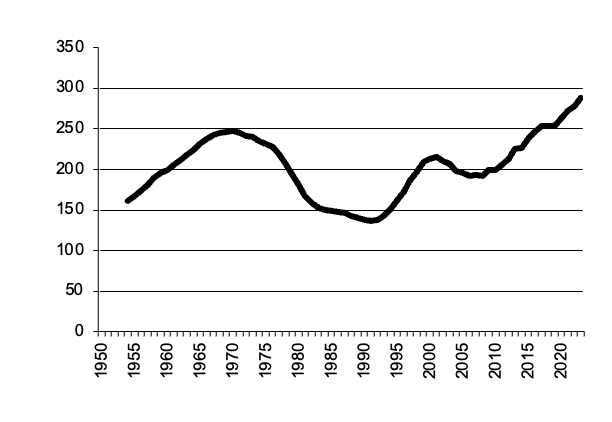
|
Number of milk cattle graph |
Return to top of page |
|
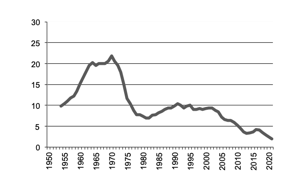
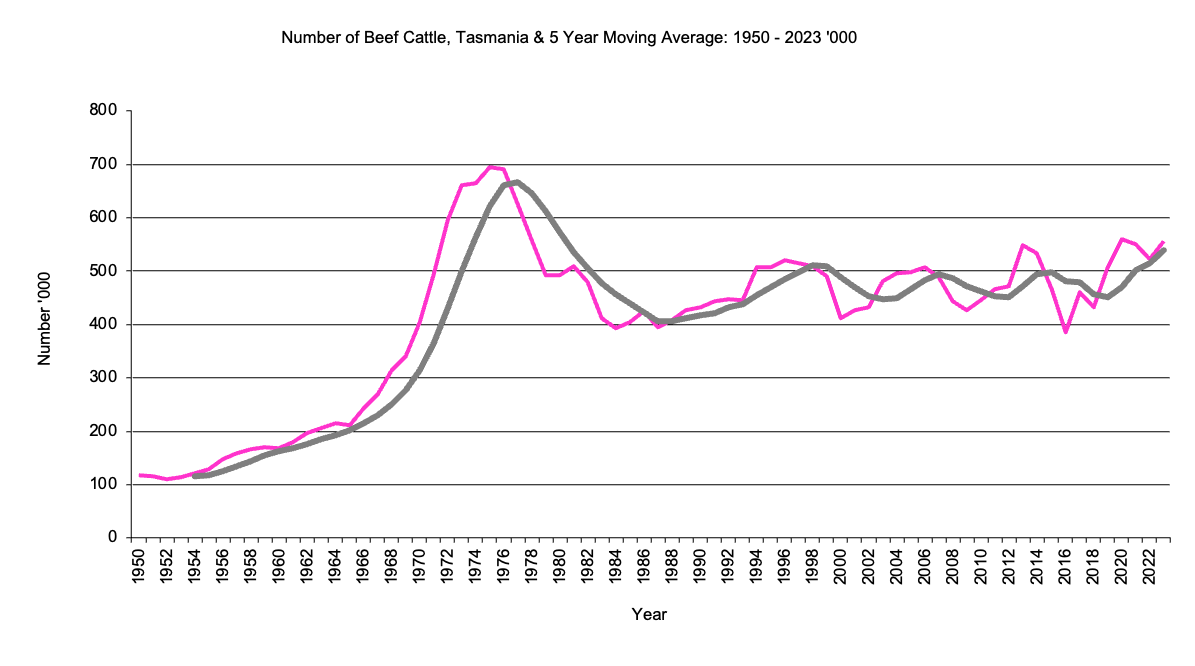
Number of beef cattle in thousands 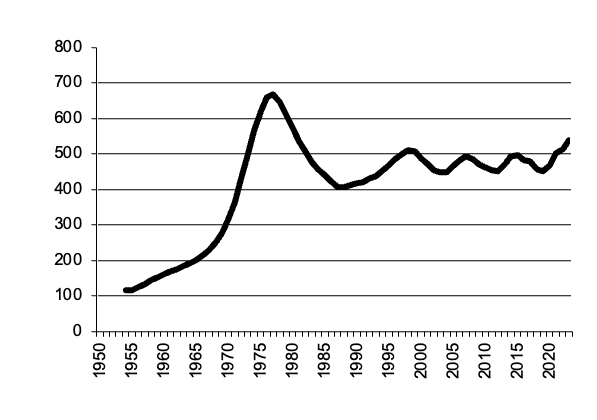
|
Number of beef cattle graph |
Return to top of page |
|
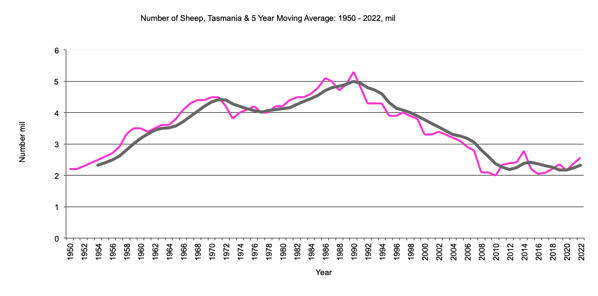
Number of sheep in millions 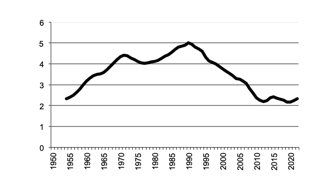
|
Number of sheep graph |
Return to top of page |
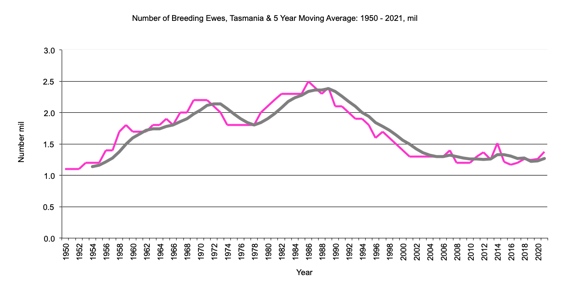
Tasmania Sheep - Number - Breeding Ewes
|
Number of sheep - breeding ewes - in millions. 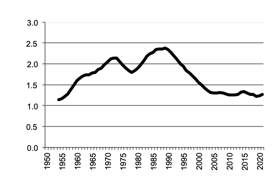
|
Number of Sheep - Breeding Ewes graph |
Return to top of page |
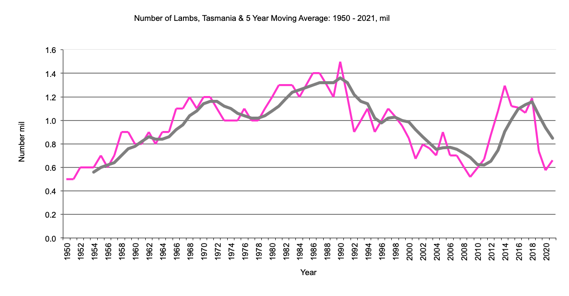
Tasmania Sheep - Number - Lambs
|
Number of sheep - lambs - in millions. 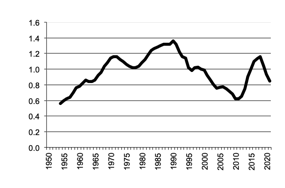
|
Number of Sheep - Lambs graph |
Return to top of page |
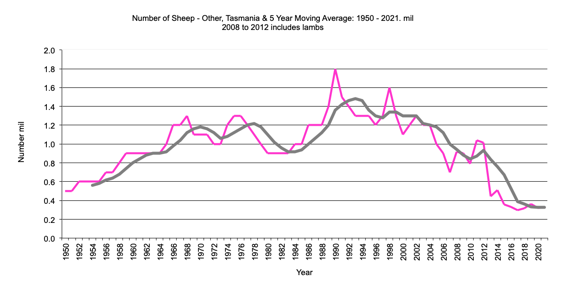
Tasmania Sheep - Number - Other
|
Number of sheep - other - in millions. 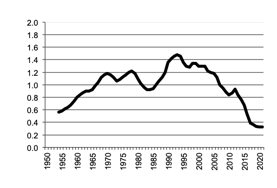
|
Number of Sheep - Other graph |
Return to top of page |
|
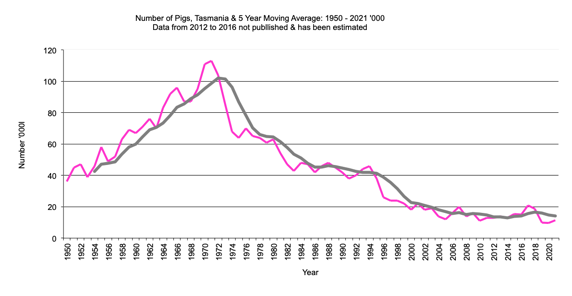
Number of pigs in thousands 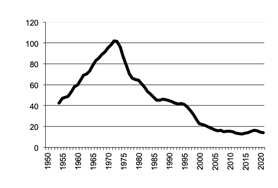
|
Number of pigs graph |
Return to top of page |
|
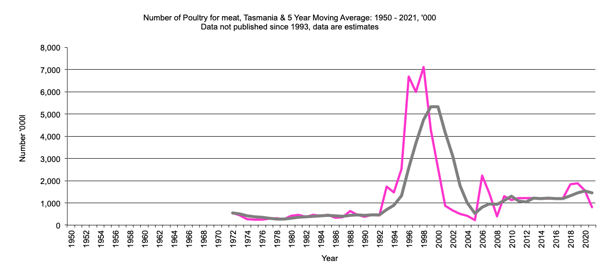
Number of poultry for meat in thousands 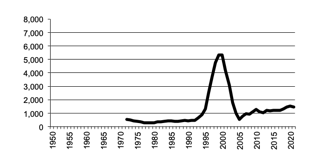
|
Number of poultry for meat graph |
Return to top of page |
|
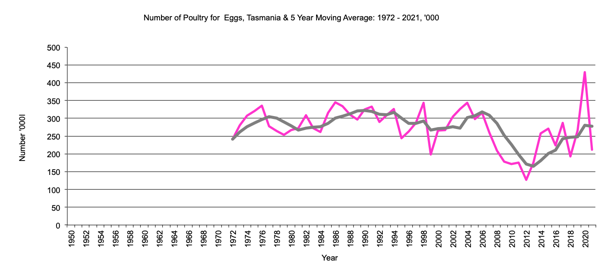
Number of poultry for eggs in thousands 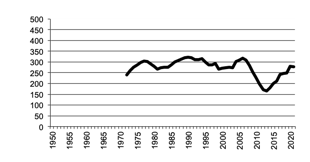
|
Number of poultry for eggs graph |
Return to top of page |
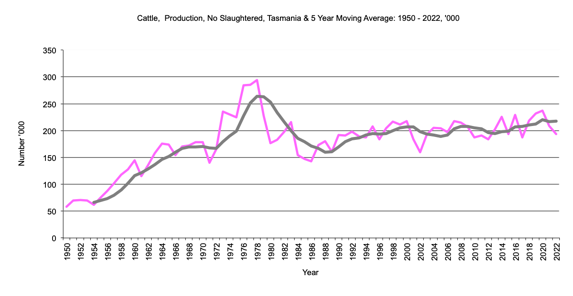
Tasmania, Cattle, Number Slaughtered
Prior to 1971 cattle slaughtered included calves slaughtered
|
Number of cattle slaughtered in thousands. 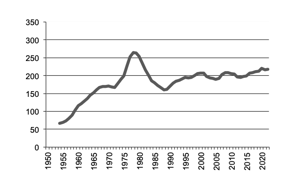
|
Tasmania Number of cattle slaughtered graph |
Return to top of page |
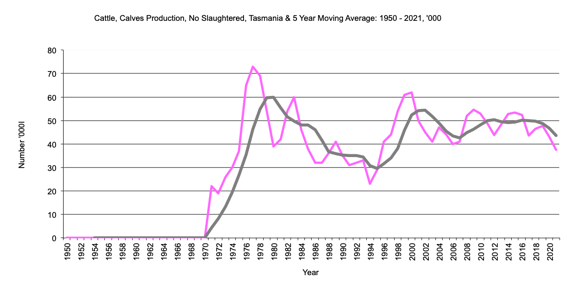
Tasmania, Calves, Number Slaughtered
|
Number of calves slaughtered in thousands. 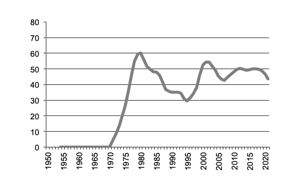
|
Tasmania Number of calves slaughtered graph |
Return to top of page |
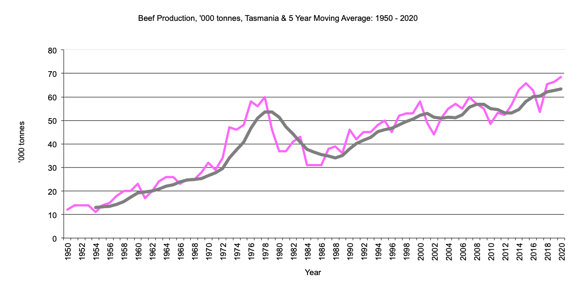
Tasmania, Beef Production
From 1950 to 1970 beef production included veal production
|
Beef production in thousand tonnes. 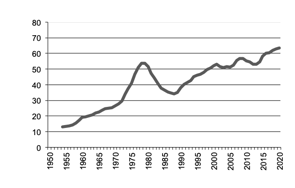
|
Tasmania beef production graph |
Return to top of page |
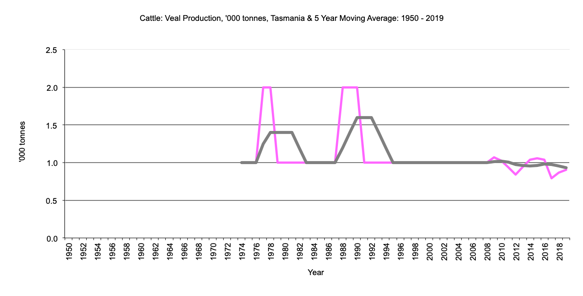
Tasmania, Veal Production
Prior to 1971 veal production included in beef production
|
Veal production in thousand tonnes. 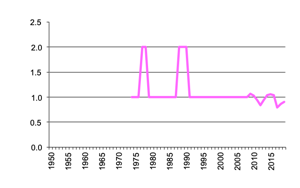
|
Tasmania veal production graph |
Return to top of page |
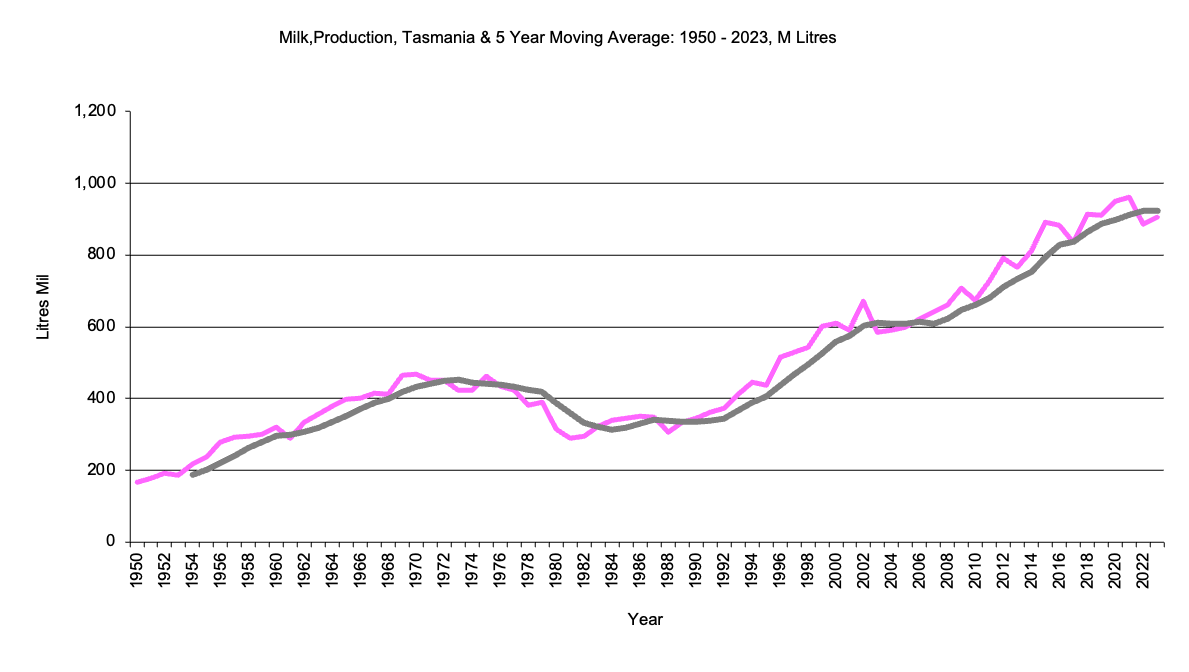
Tasmania, Milk Production
|
Milk production in million lires. 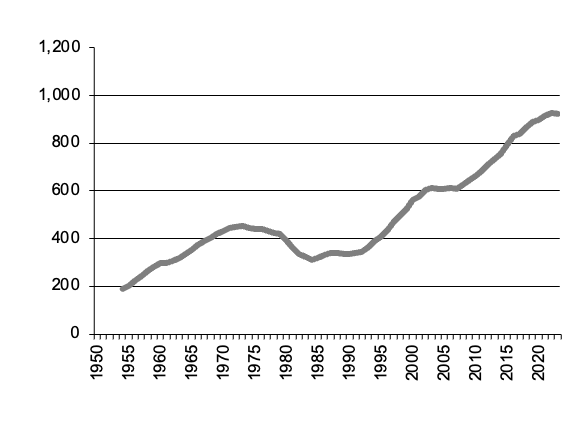
|
Tasmania milk production graph |
Return to top of page |
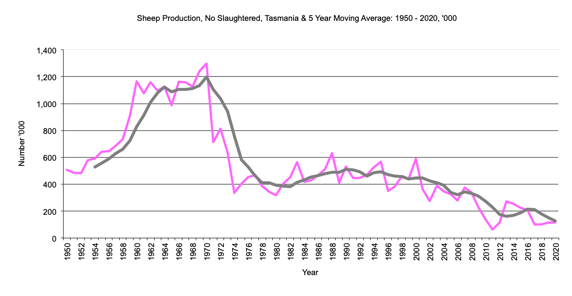
Tasmania, Sheep, Number Slaughtered
From 1950 to 1971 sheep slaughtered included lambs slaughtered
|
Number of sheep slaughtered in thousands. 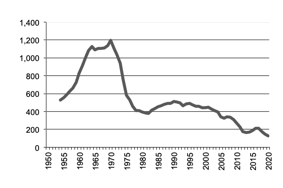
|
Tasmania Number of sheep slaughtered graph |
Return to top of page |
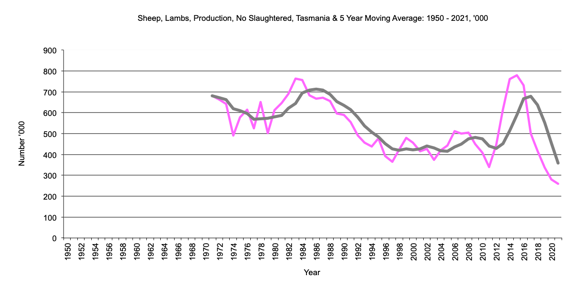
Tasmania, Lambs, Number Slaughtered
|
Number of lambs slaughtered in thousands. 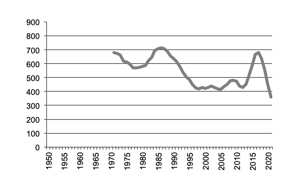
|
Tasmania Number of lambs slaughtered graph |
Return to top of page |
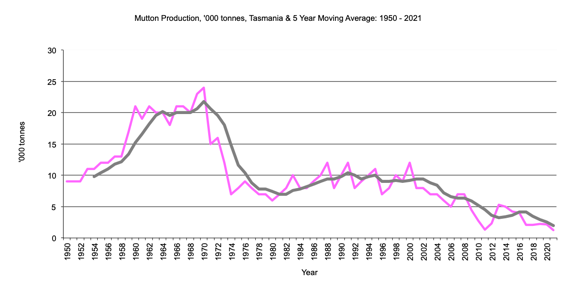
Tasmania, Mutton Production
From 1950 to 1970 includes lamb production
|
Mutton production in thousand tonnes.
|
Tasmania mutton production graph |
Return to top of page |
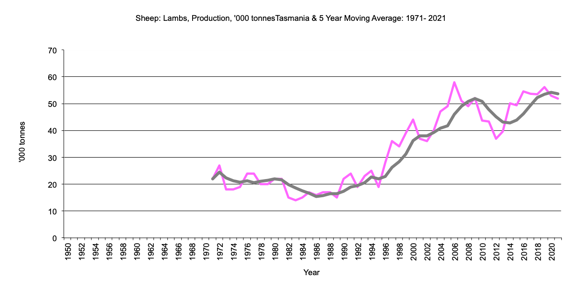
Tasmania, Lamb Production
Prior to 1971 included in mutton production
|
Lamb production in thousand tonnes. 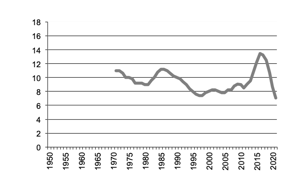
|
Tasmania lamb production graph |
Return to top of page |
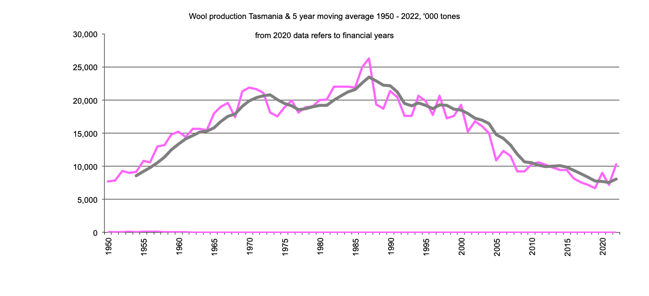
Tasmania, Wool Production
|
Wool production in tonnes. 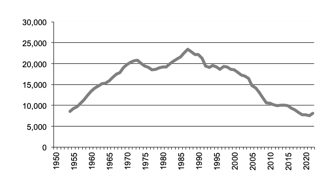
|
Tasmania wool production graph |
Return to top of page |
Tasmania, Pigs, Number Slaughtered
|
Number of pigs slaughtered in thousands. 
|
TasmaniaPigs, Number Slaughtered graph |
Return to top of page |
Tasmania, Pig Meat Production
|
Pig meat production in thousand tonnes. 
|
Tasmania pig meat production graph |
Return to top of page |
Tasmania, Chickens, Number Slaughtered
|
Chickens, Number Slaughtered in thousands 
|
Tasmania Number of chickens slaughtered graph |
Return to top of page |
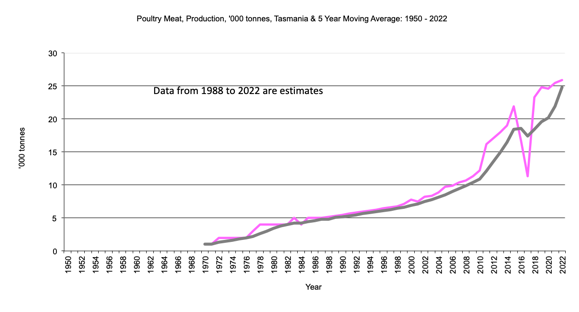
Tasmania, Poultry Meat Production
|
Poultry meat production in thousand dozen. 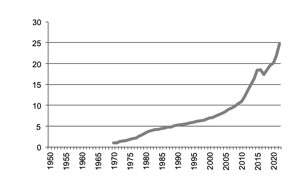
|
Tasmania poultry meat production graph |
Return to top of page |
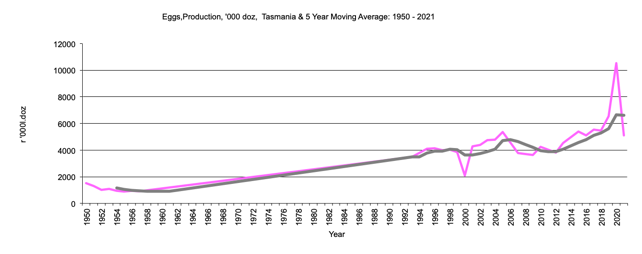
Tasmania, Egg Production
|
Egg production in thousand dozen. 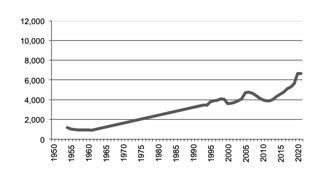
|
Tasmania egg production graph |
p>Return to top of page Back to data for states Back to front page |
Tasmania Total Livestock Products - Gross Value of Production
|
Gross Value of Production in $ millions. 
|
Total Livestock Products,Gross Value Production graph |
Return to top of page |
Tasmania Total Livestock Slaughtered - Gross Value of Production
|
Total Livestock Slaughtered Gross Value of Production in $ millions. 
|
Total Livestock Slaughtered Gross Value Production graph |
Return to top of page |
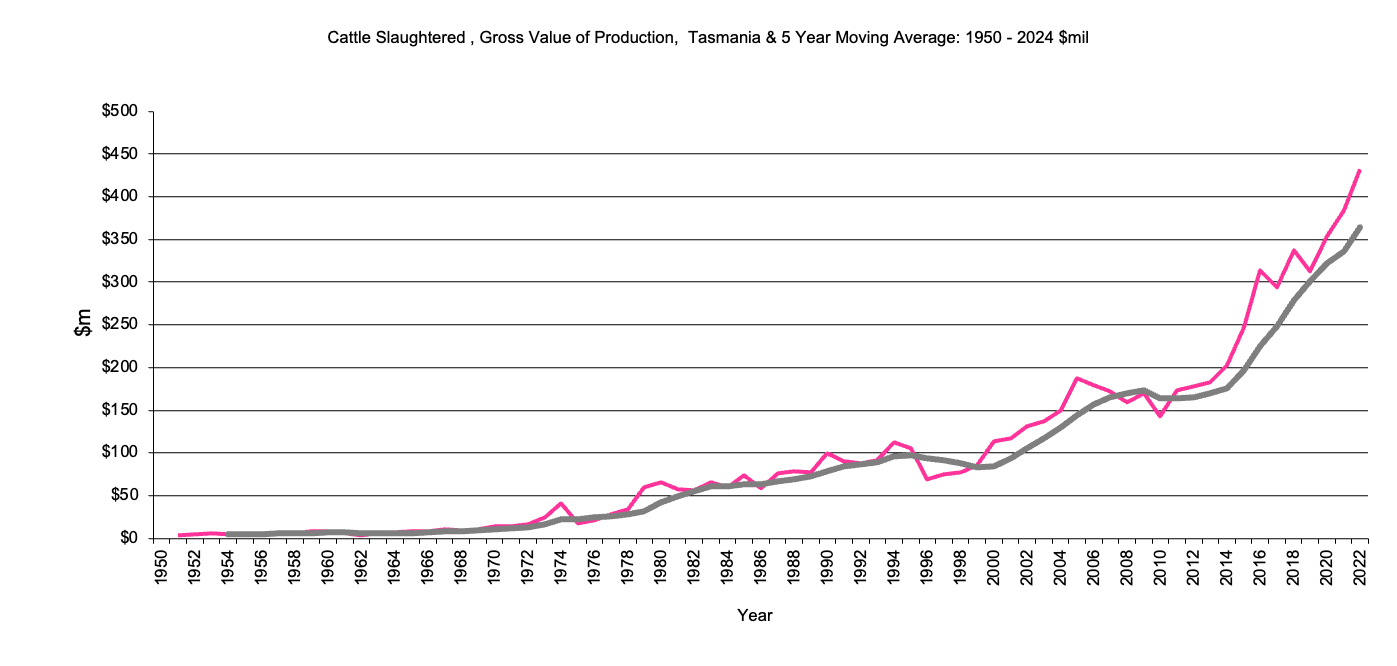
Tasmania, Cattle, Gross Value Production
(Cattle and calves slaughtered)
|
Cattle gross value production in $m 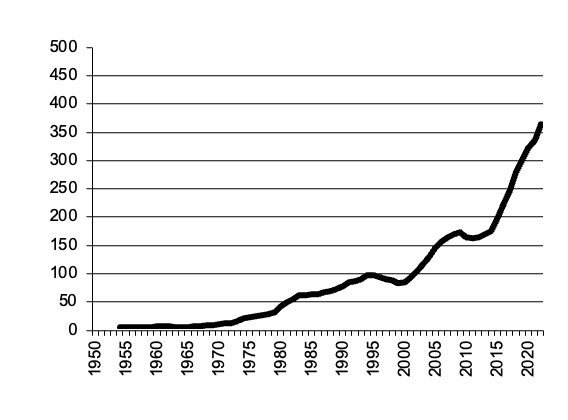
|
Cattle gross value production graph |
Return to top of page |
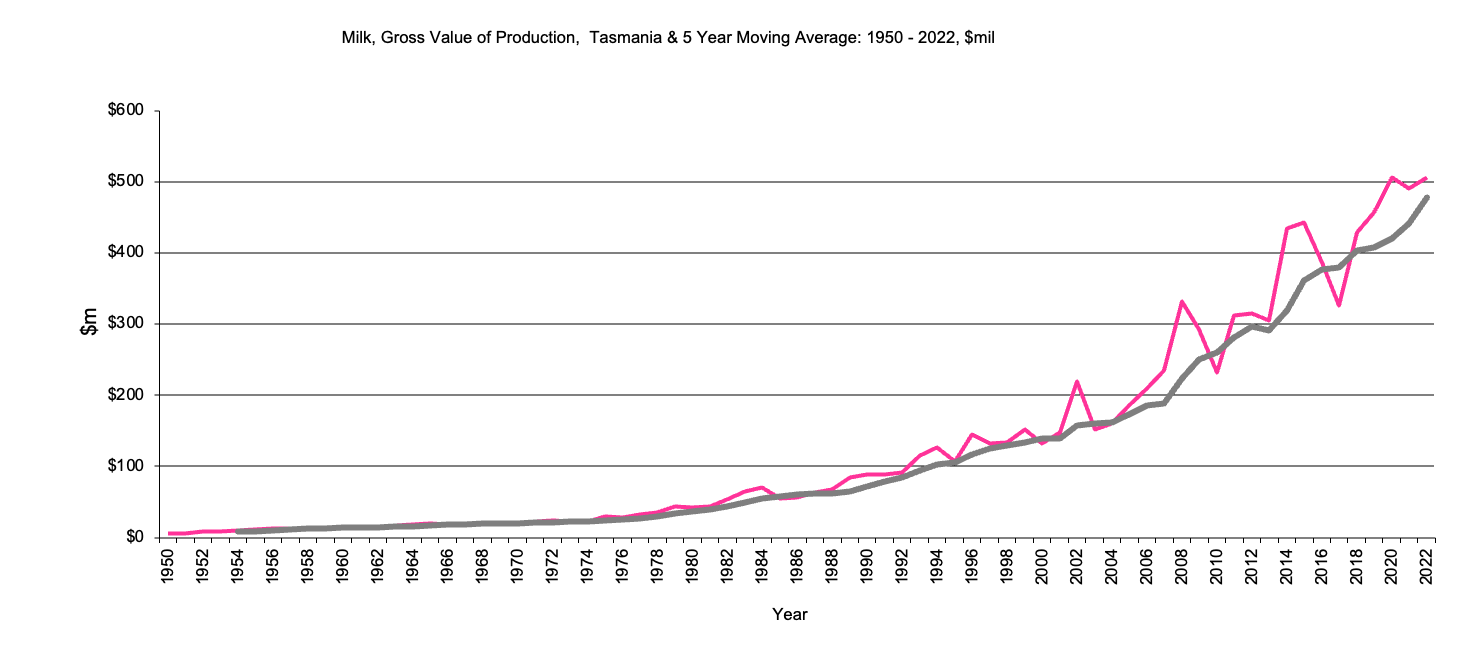
Tasmania, Milk, Gross Value Production
|
Milk gross value production in $m 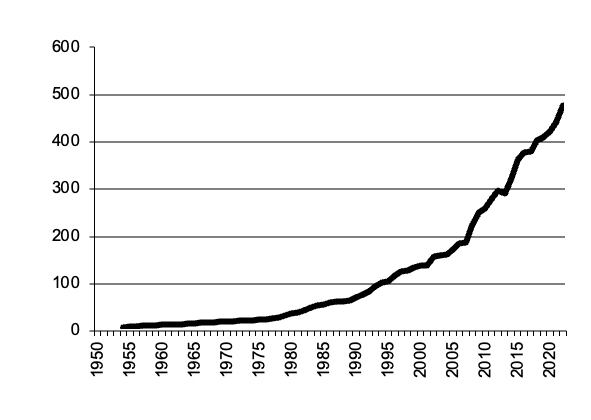
|
Milk Gross value production graph |
Return to top of page |
Tasmania, Manufacturing Milk, Gross Value Production
|
Manufacturing milk gross value production in $m. This data series ceased in 2003, when milk factories paid the same price for manufacturing and human consumption milk. 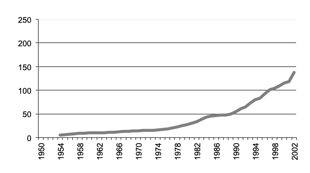
|
Manufacturing milk gross value production graph |
> Return to top of page |
Tasmania, Milk for Human Consumption, Gross Value Production
|
Milk for human consumption gross value production in $m. This data series ceased in 2003, when milk factories paid the same price for manufacturing and human consumption milk. 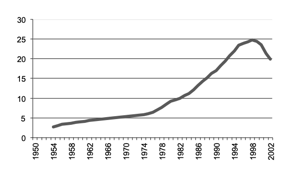
|
Milk for human consumption gross value production graph |
Return to top of page |
Tasmania, Sheep (Sheep and lambs slaughtered) Gross Value Production
|
Sheep (Sheep and lambs slaughtered)gross value production in $m 
|
Sheep (Sheep and lambs slaughtered) gross value production graph |
Return to top of page |
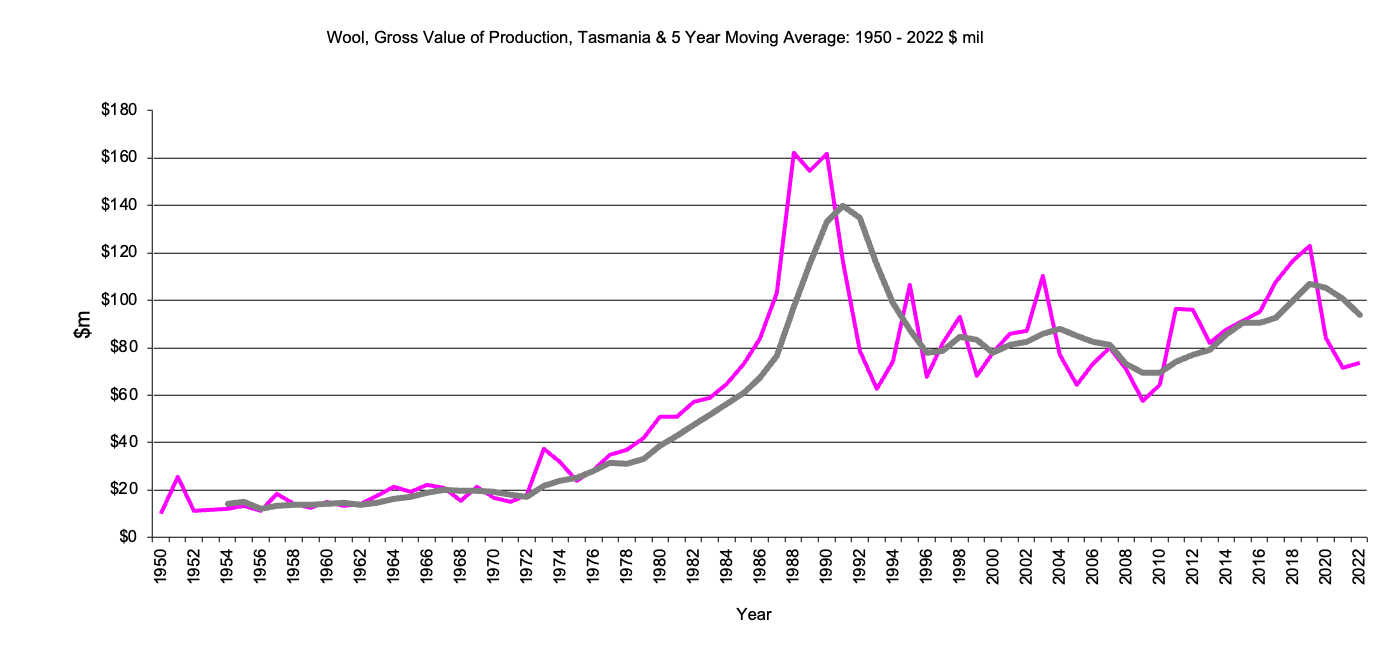
Tasmania, Wool, Gross Value Production
|
Wool gross value production in $m 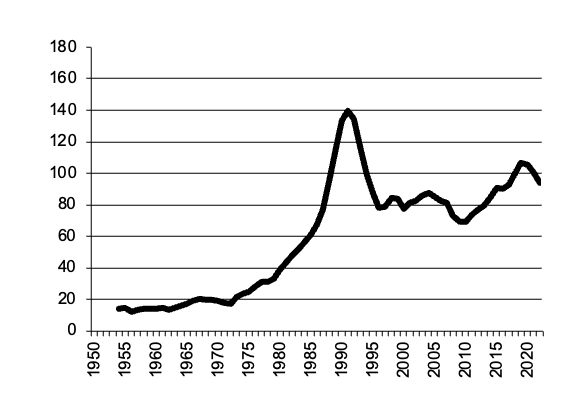
|
Wool gross value production graph |
Return to top of page |
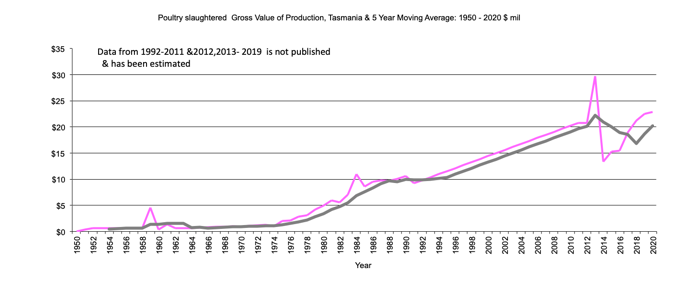
Tasmania, Poultry, (Poultry slaughtered) Gross Value Production
|
Poultry (Poultry slaughtered) gross value production in $m 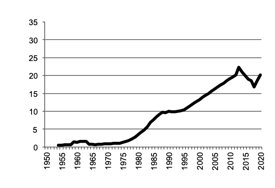
|
Poultry (Poultry slaughtered) gross value production graph Poultry (Poultry slaughtered) gross value production data |
Return to top of page |
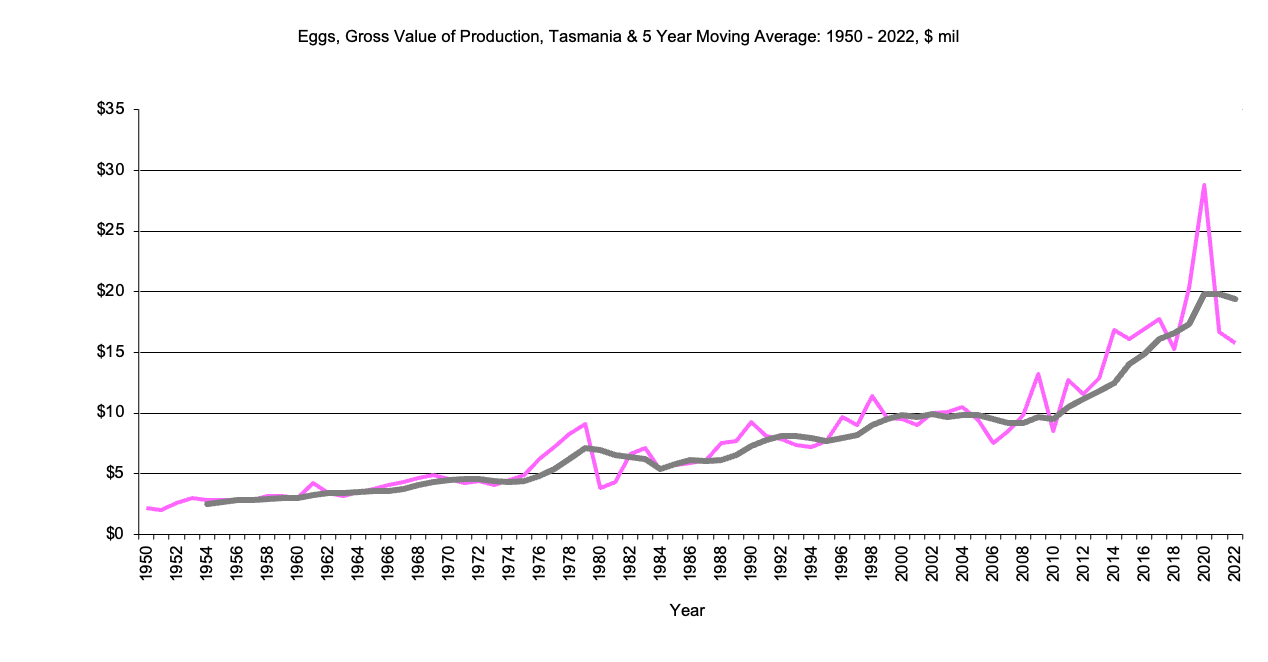
Tasmania, Eggs Gross Value Production
|
Eggs gross value production in $m 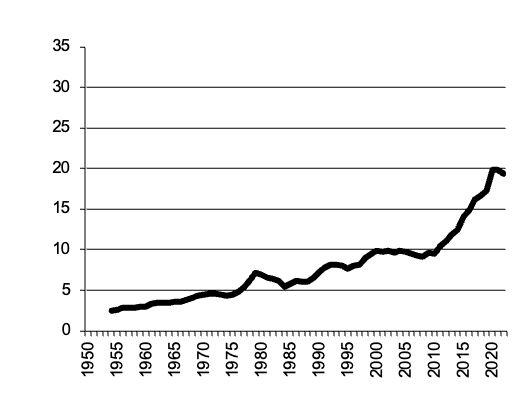
|
Eggs gross value production graph |
Return to top of page |
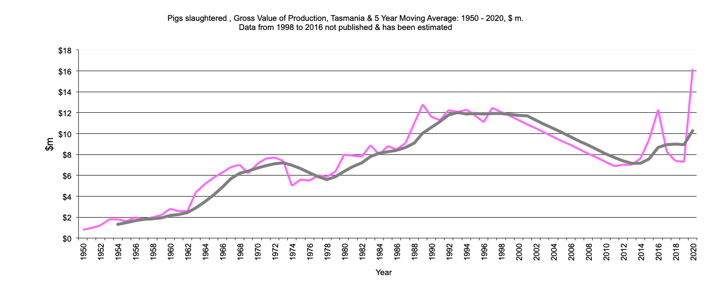
Tasmania, Pigs Gross Value Production
|
Pigs gross value production in $m. 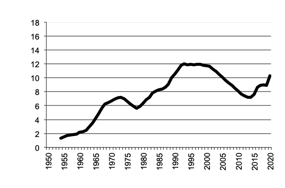
|
Pigs gross value production graph |
Return to top of page |