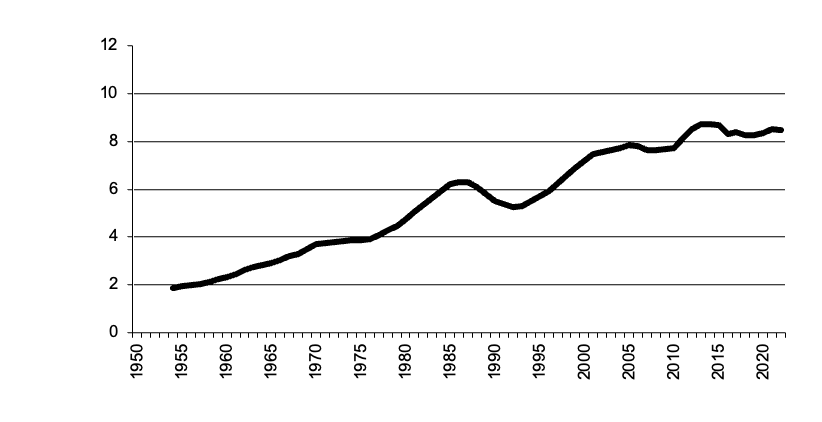
Area of all crops in million hectares 5 year moving average
Western Australia All Crops graph
Western Australia All Crops data
Return to top of page
Back to data for States
Back to front page
This page has Western Australia data for crops from 1950 to the present and the best way 5 year moving average. There is data for the area sown. The crops to be included here are:all crops, barley, oats, wheat, triticale, sorghum, maize, grapes, oilseeds, cotton and potatoes.
|
Go to All crops Go to Barley Go to Oats Go to Wheat |
Go to Triticale Go to Sorghum Go to Maize Go to Rice |
Go to Sugar Go to Grapes Go to Grapes for Wine" Go to Grapes for Other uses" Go to Oil Seeds |
Go to Cotton Go to Potatoes Go to Potatoes Fresh Market Go to Potatoes Processing |
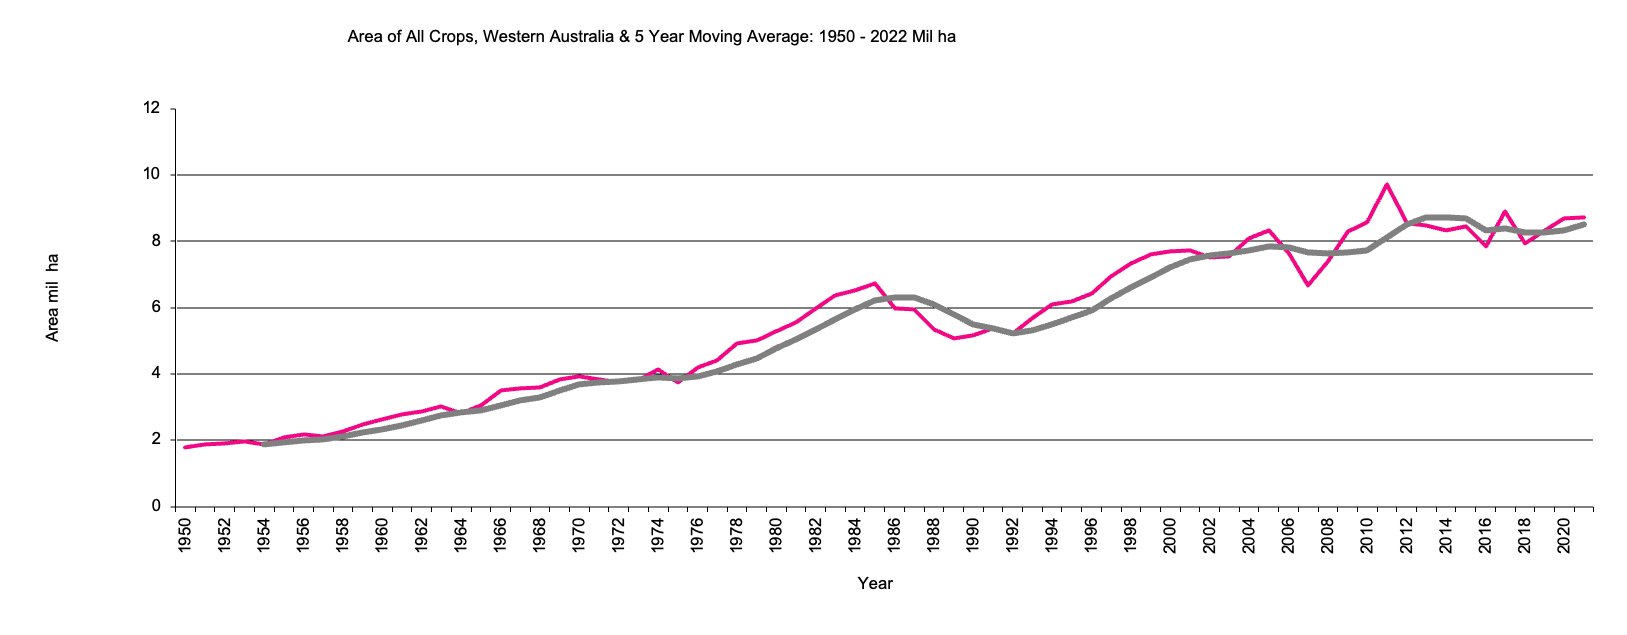
Western Australia All Crops - Area
|
Area of all crops in million hectares 5 year moving average
|
Western Australia All Crops graph |
Return to top of page |
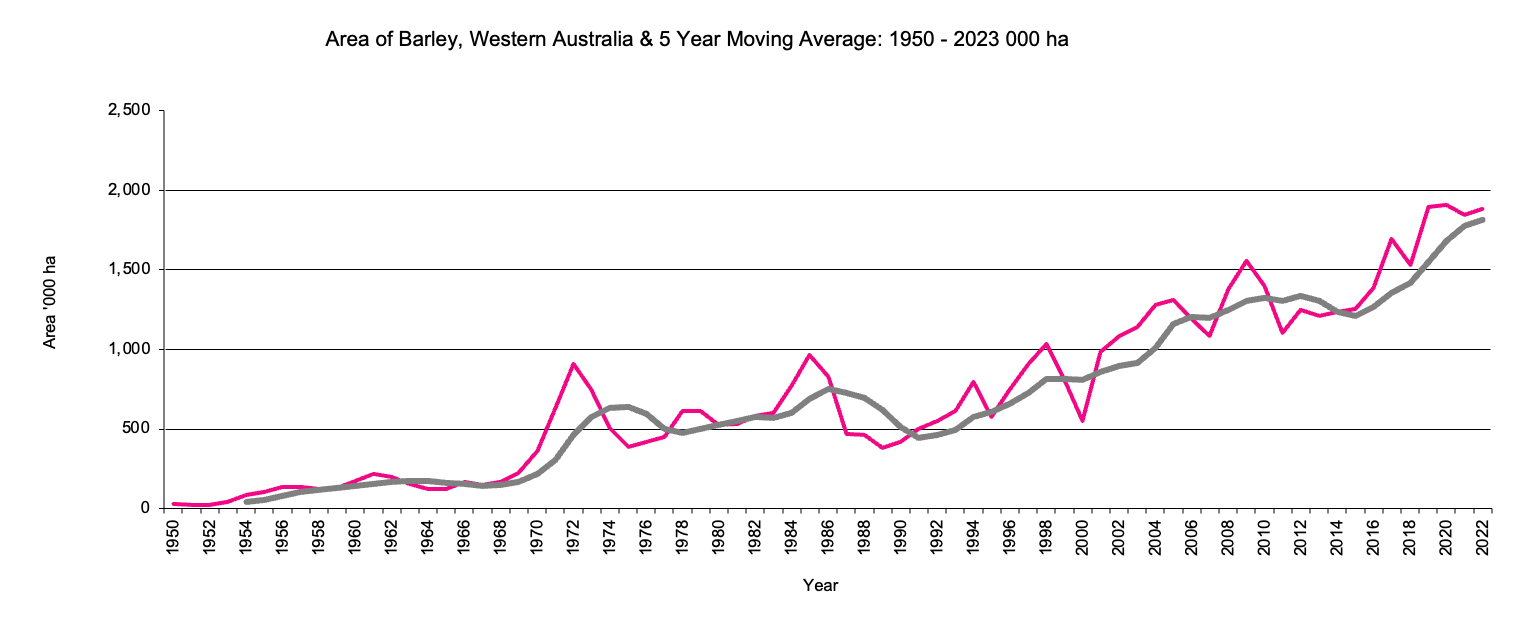
Western Australia Barley - Area
|
Area of Barley in '000 hectares 5 year moving average 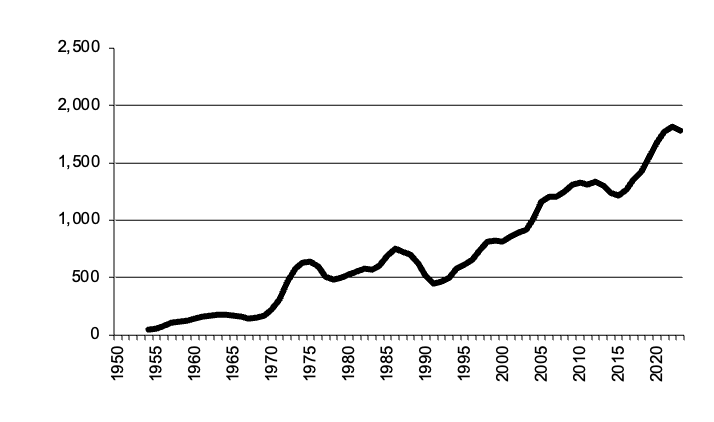
|
Western Australia Barley graph |
Return to top of page |
|
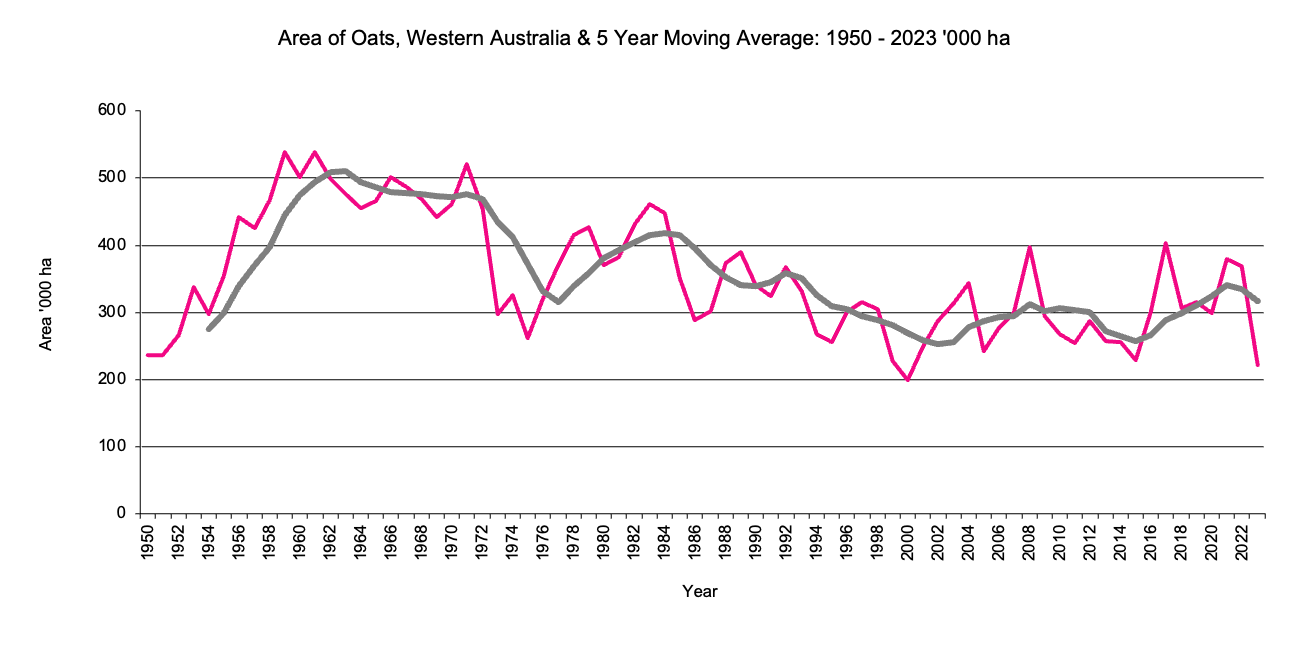
Area of Oats in '000 hectares 5 year moving average 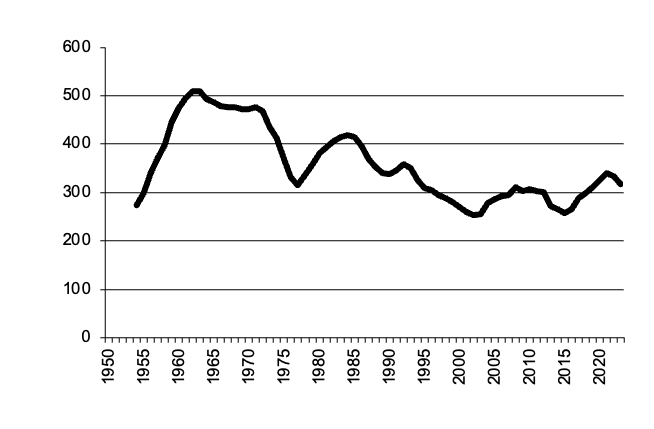
|
Area of Oats graph |
Return to top of page |
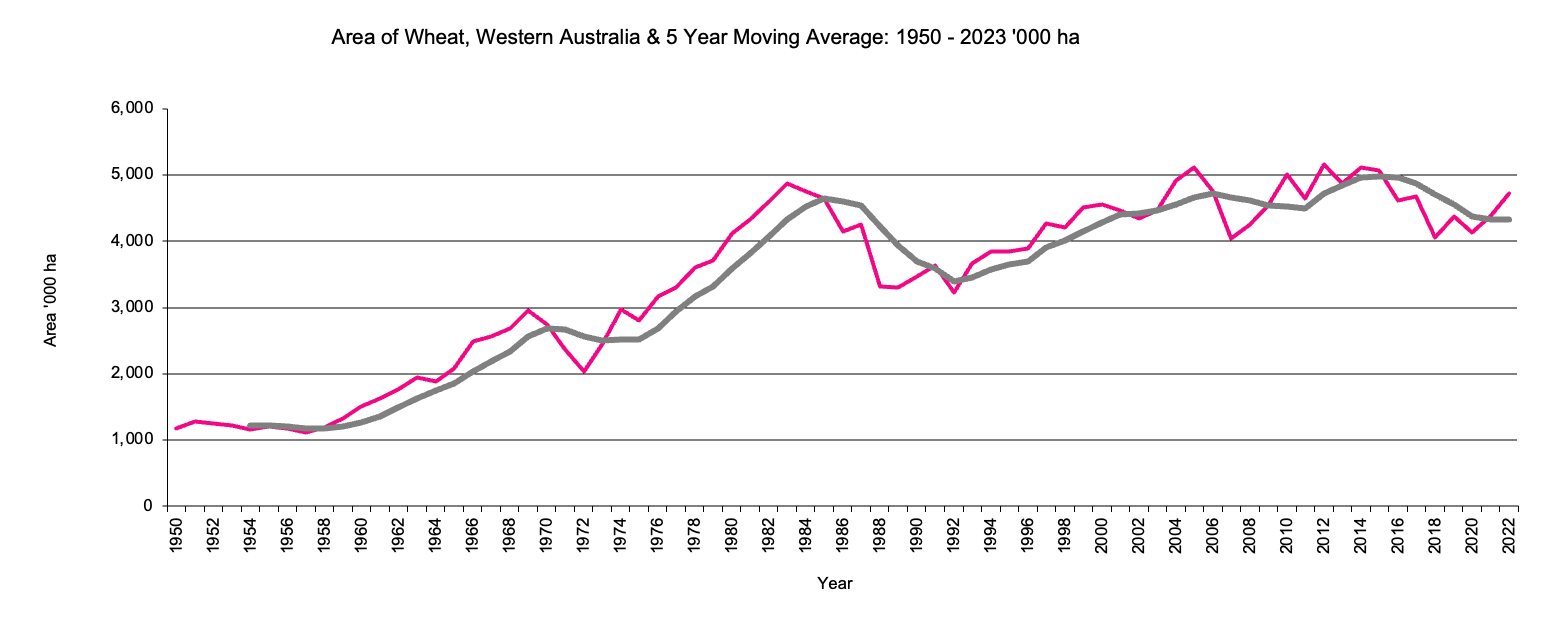
Western Australia Wheat - Area
|
Area of Wheat in '000 hectares 5 year moving average 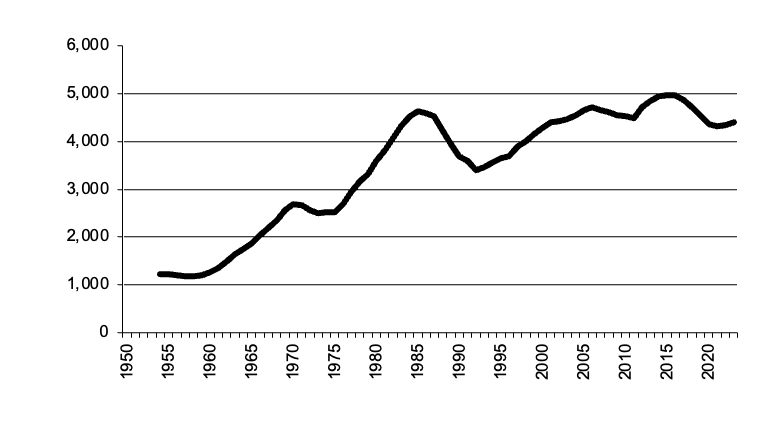
|
Area of Wheat graph |
Return to top of page |
Western Australia Triticale - Area
|
Area of Triticale in '000 hectares 5 year moving average 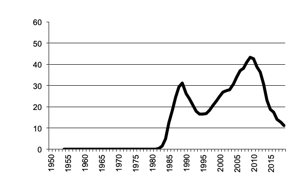
|
Western Australia Area of T Triticale graph |
Return to top of page |
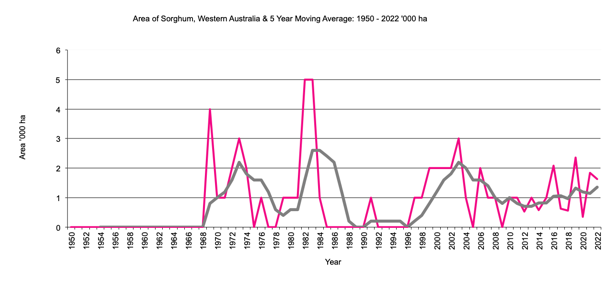
Western Australia Sorghum - Area
|
Area of all Sorghum in '000 hectares 5 year moving average 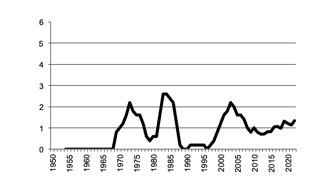
|
Western Australia Sorghum graph |
Return to top of page |
|
Area of Rice in '000 hectares 5 year moving average 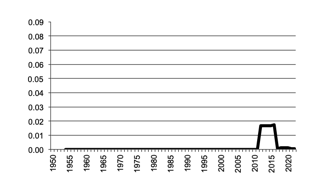
|
Western Australia Area of Rice graph |
Return to top of page |
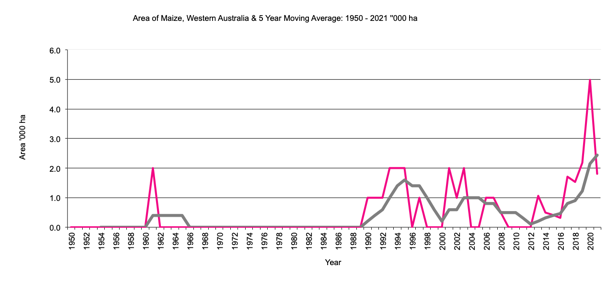
Western Australia Maize - Area
|
Area of Maize in '000 hectares 5 year moving average 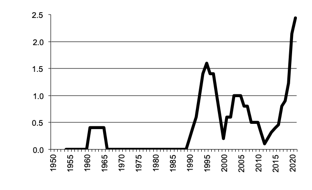
|
Western Australia Maize graph |
Return to top of page |
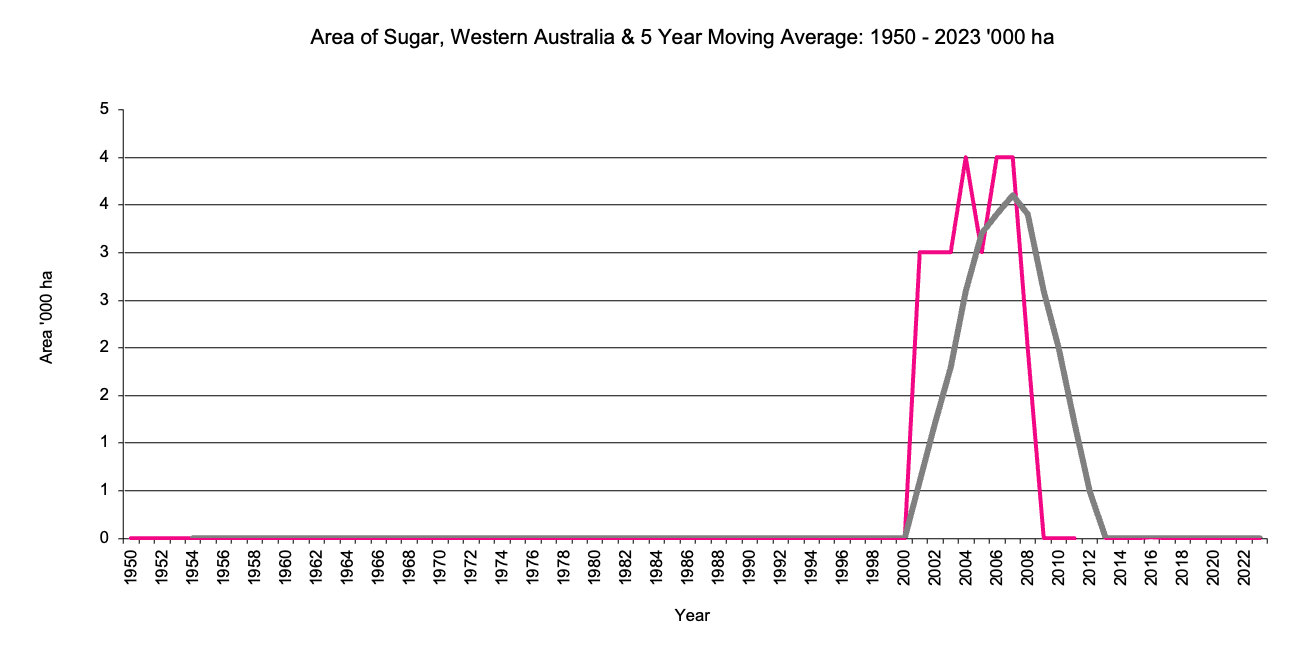
Western Australia Sugar - Area
|
Area of Sugar in '000 hectares 5 year moving average 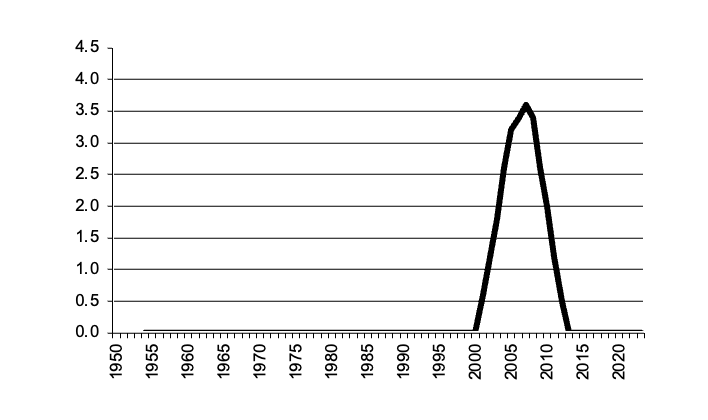
|
Area of Sugar graph |
Return to top of page |
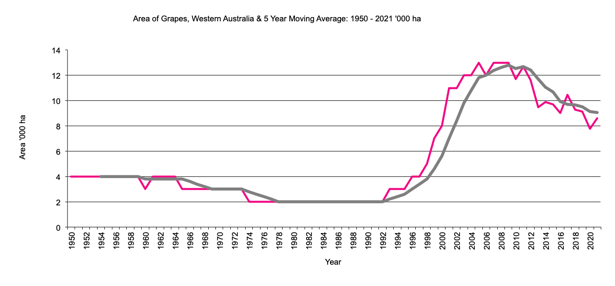
Western Australia Grapes - Area
|
Area of Grapes in '000 hectares 5 year moving average 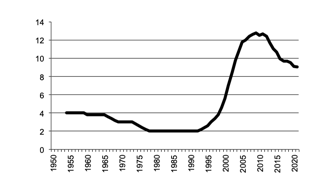
|
Western Australia Grapes graph |
Return to top of page |
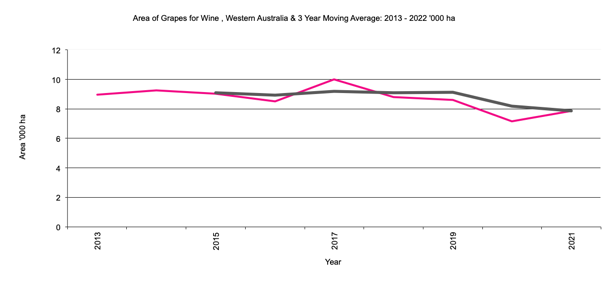
Western Australia Grapes for wine - Area
|
Area of grapes for Wine in '000 hectares, 3 year moving average 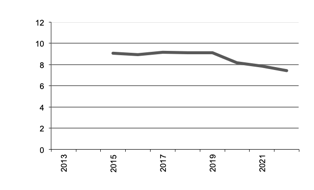
|
Western Australia grapes for wine graph |
Return to top of page |
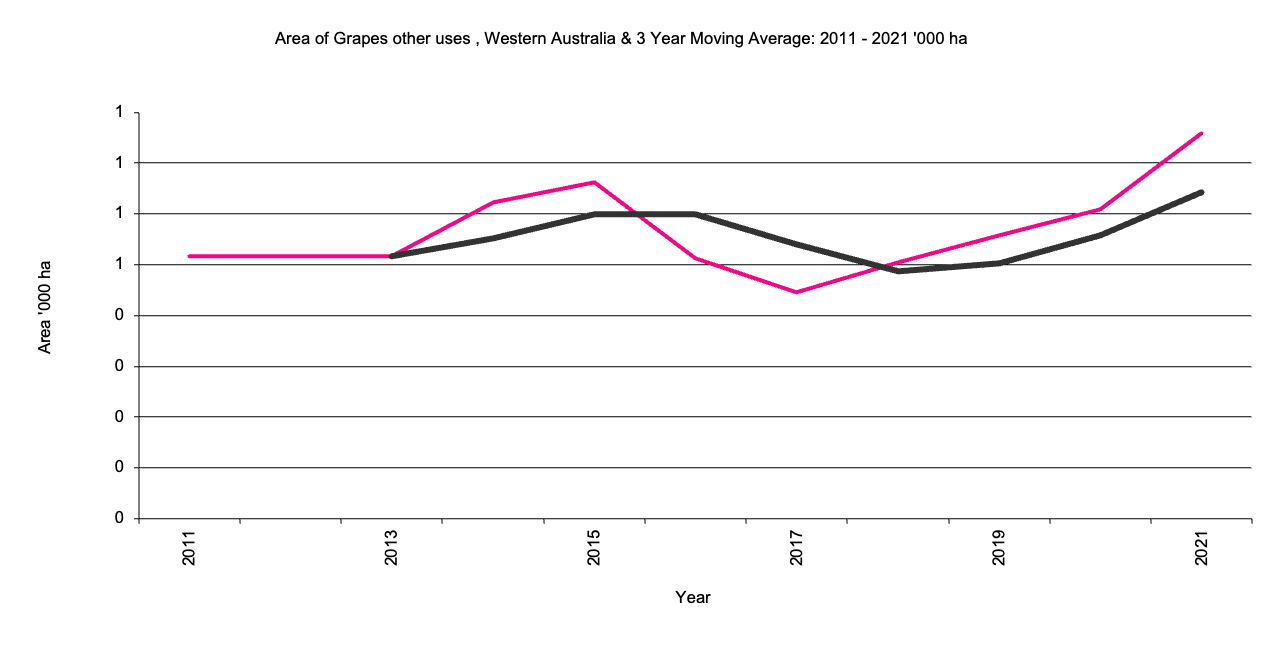
Western Australia Grapes for Other Uses - Area
|
Area of grapes for Wine in '000 hectares, 3 year moving average 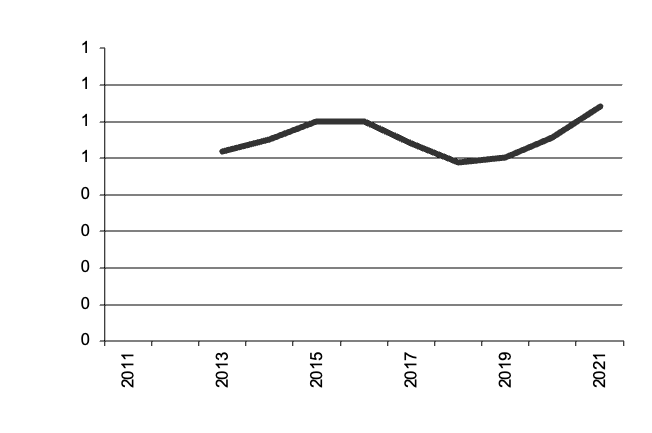
|
Western Australia grapes for Other Uses graph |
Return to top of page |
Western Australia Oil Seeds- Area
|
Area of Oil Seeds in '000 hectares 5 year moving average
|
Western Australia Oil Seeds graph |
Return to top of page |
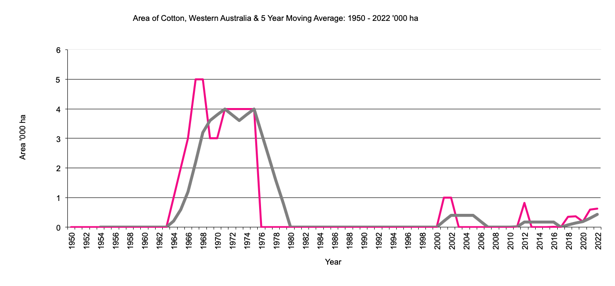
Western Australia Cotton - Area
|
Area ofCotton in '000 hectares 5 year moving average 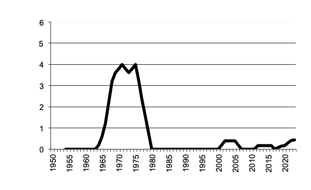
|
Western Australia Cotton graph |
Return to top of page |
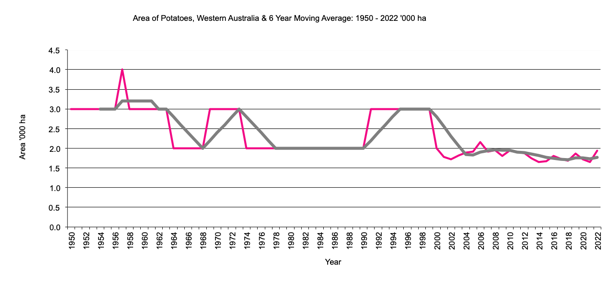
Western Australia Potatoes - Area
|
Area of Potatoes in '000 hectares 5 year moving average 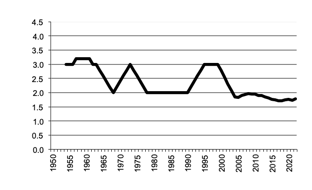
|
Western Australia Area of Potatoes graph |
Return to top of page |
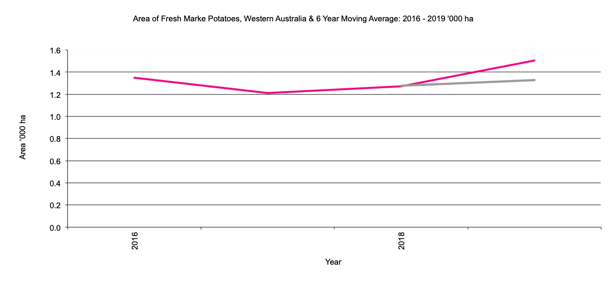
Western Australia Fresh Market Potatoes - Area
|
Area of Fresh Market Potatoes in '000 hectares 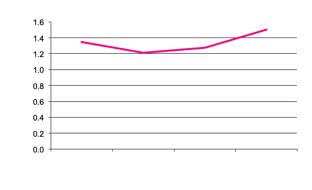
|
Western Australia Fresh Market Potatoes graph |
Return to top of page |
Western Australia Processing Potatoes - Area
|
Area of Processing Potatoes in '000 hectares 
|
Western Australia Processing Potatoes graph |
Return to top of page |