Agricultural Data For Australia, Western Australia Livestock Numbers

 1950 to Current Data

Crops

Introduction

This page has data for West Australia livestock numbers from 1950 to the present and the 5 year moving average.  There is data for cattle, sheep, poultry and pigs.  

LIVESTOCK DATA FOR WEST AUSTRALIA


LIVESTOCK NUMBERS FOR WEST AUSTRALIA

  • Cattle
  • Pigs
    • Sheep
  • Sheep
  • Poultry


  • LIVESTOCK PRODUCTION FOR WEST AUSTRALIA

    (number Slaughtered: production of meat, wool, eggs)


  • Cattle
  • Cattle
  • Pigs
  • Sheep
  • Sheep
  • Poultry


  • GROSS VALUE of PRODUCTION LIVESTOCK FOR WEST AUSTRALIA


  • Total Livestock Slaughtered
  • Total Livestock Products
  • Cattle
  • Sheep
  • Pigs
  • Poultry
  • DATA FILES

    Western Australia Cattle

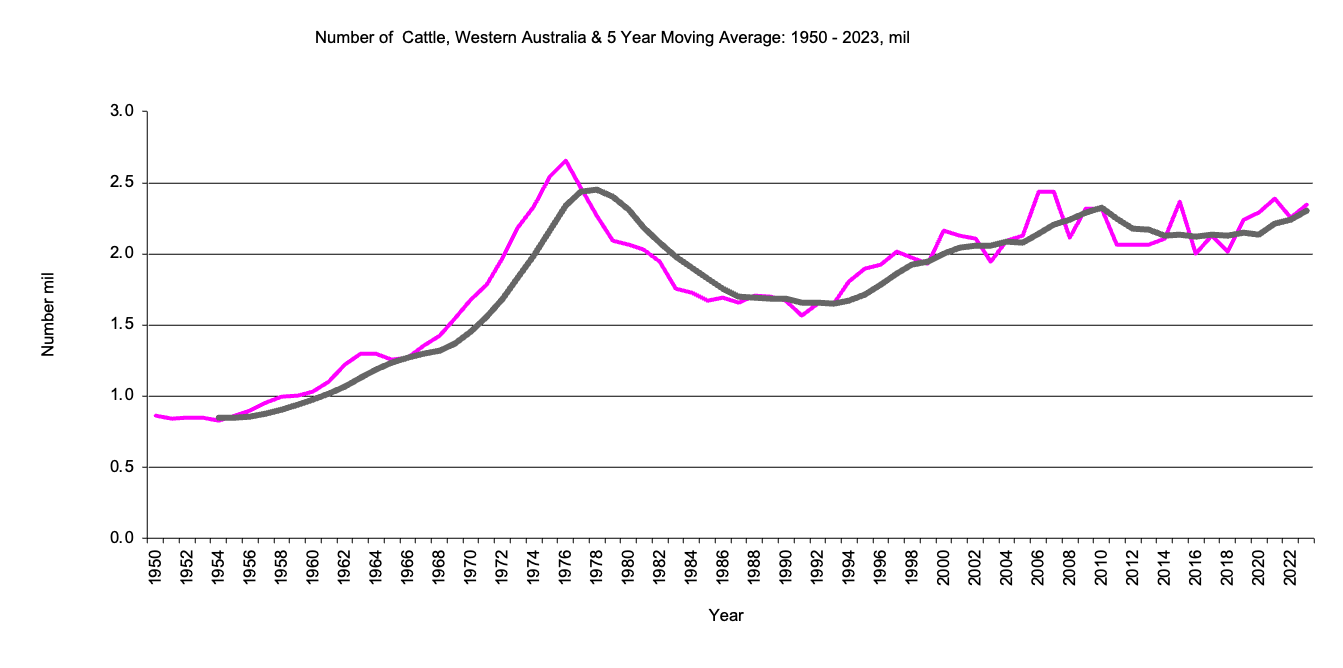
    Number of cattle in millions

    Number of cattle since 1950

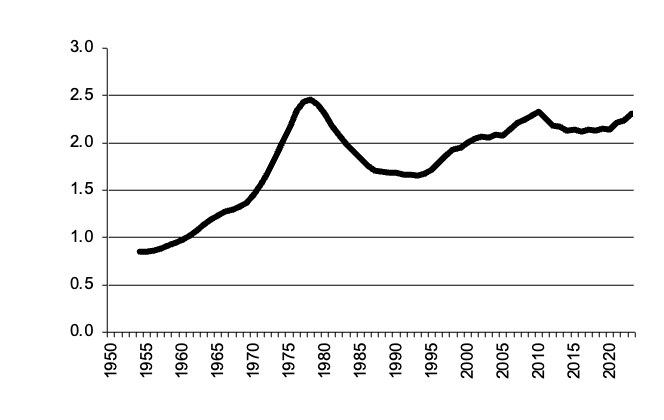
    Cattle numbers graph
    Cattle numbers data

    Return to top of page
    Back to data for States
    Back to front page

    Western Australia Milk Cattle

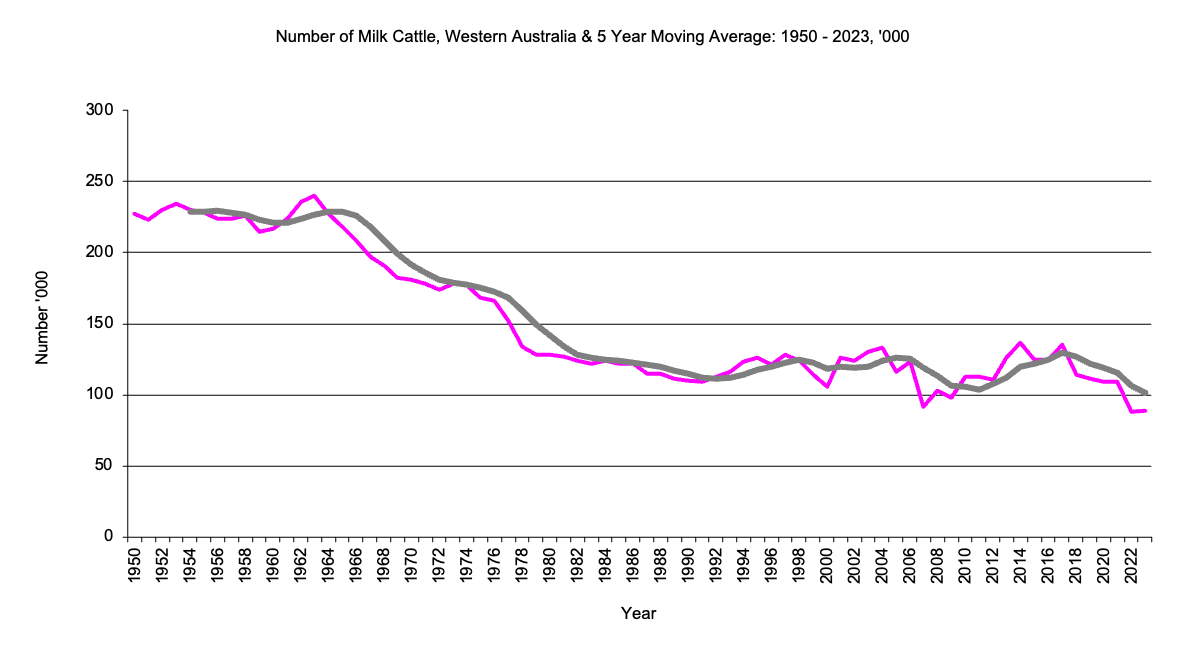
    Number of milk cattle in thousands

    Number of milk cattle since 1950

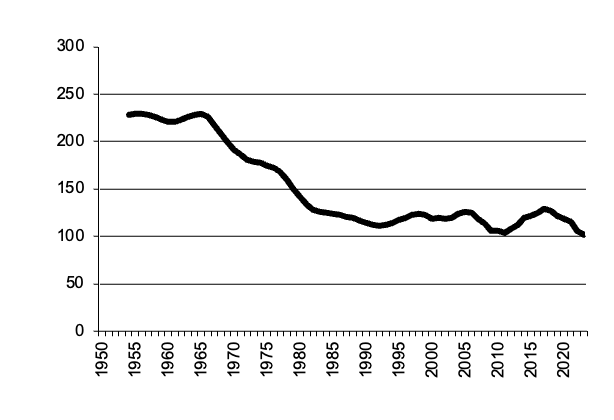
    Number of milk cattle graph
    Number of milk cattle data

    Return to top of page
    Back to data for States
    Back to front page

    Western Australia Beef Cattle

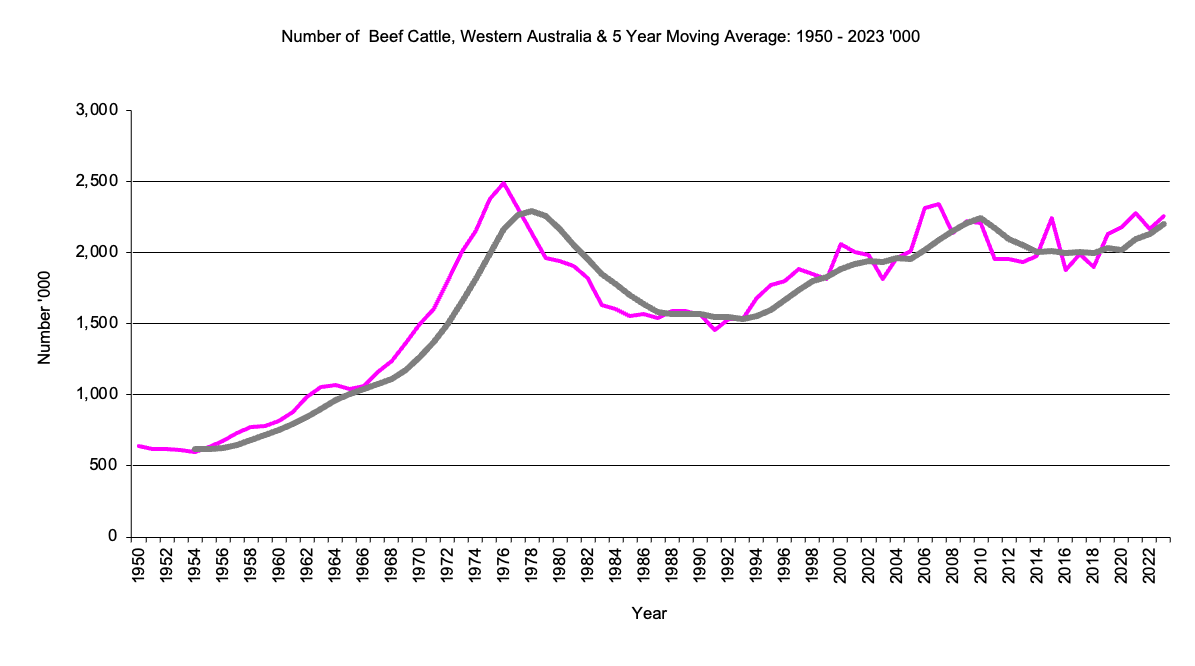
    Number of beef cattle in millions

    Number of beef cattle since 1950

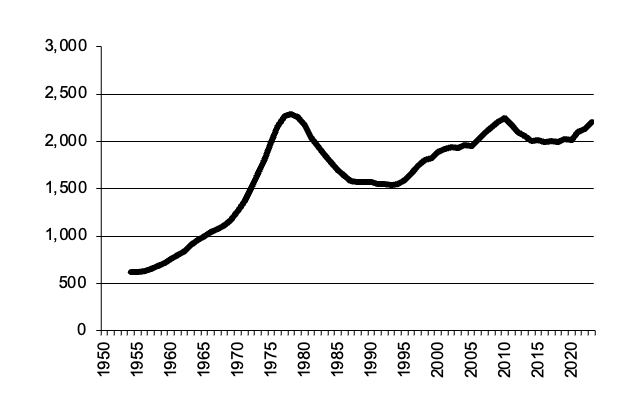
    Number of beef cattle graph
    Number of beef cattle data

    Return to top of page
    Back to data for States
    Back to front page

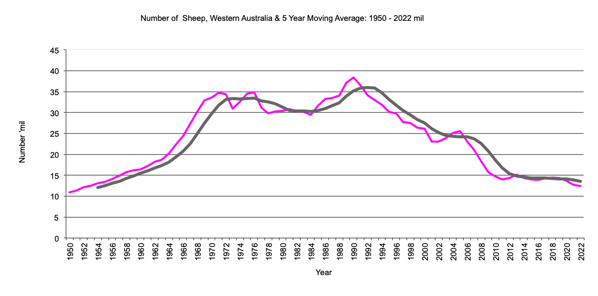
    Western Australia Sheep Numbers

    Number of sheep in millions

    Number of sheep since 1950

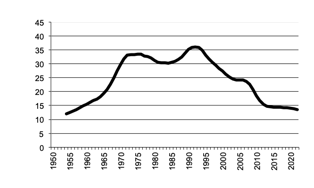
    Number of sheep graph
    Number of sheep data

    Return to top of page
    Back to data for States
    Back to front page

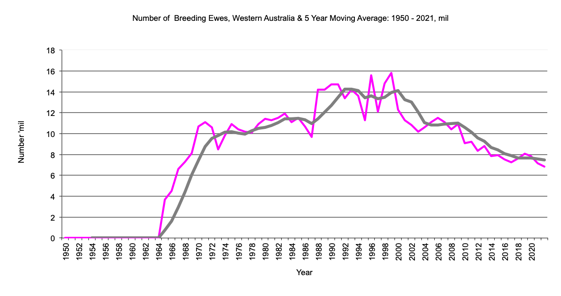
    Western Australia Sheep - Number - Breeding Ewes

    Number of sheep - breeding ewes - in millions.

    Number of sheep - breeding ewes - since 1950

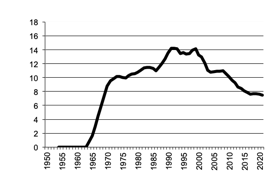
    Number of Sheep - Breeding Ewes graph
    Number of Sheep - Breeding Ewes data

    Return to top of page
    Back to data for States
    Back to front page

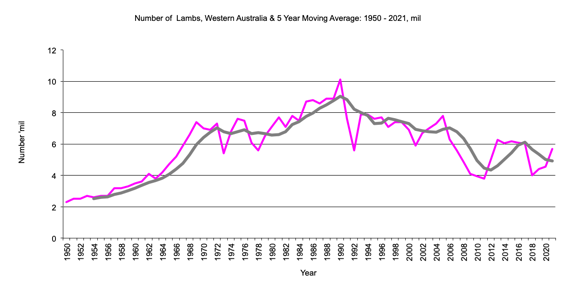
    Western Australia Sheep - Number - Lambs

    Number of sheep - lambs - in millions.

    Number of sheep - lambs - since 1950

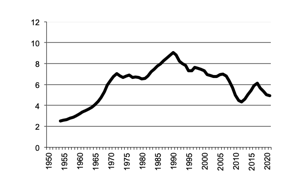
    Number of Sheep - Lambs graph
    Number of Sheep - Lambs data

    Return to top of page
    Back to data for States
    Back to front page

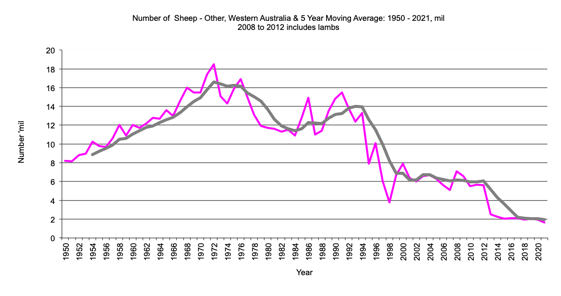
    Western Australia Sheep - Number - Other

    Number of sheep - other in millions.

    Number of sheep - other - since 1950

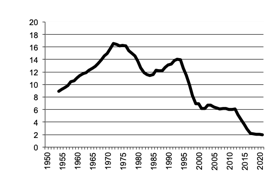
    Number of Sheep - Other graph
    Number of Sheep - Other data

    Return to top of page
    Back to data for States
    Back to front page

    Western Australia Pig Numbers

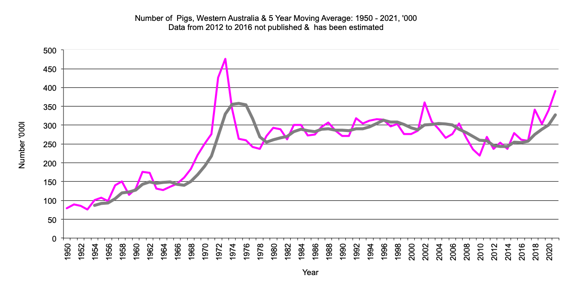
    Number of pigs in thousands

    Number of pigs since 1950

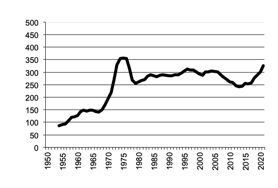
    Number of pigs graph
    Number of pigs data

    Return to top of page
    Back to data for States
    Back to front page

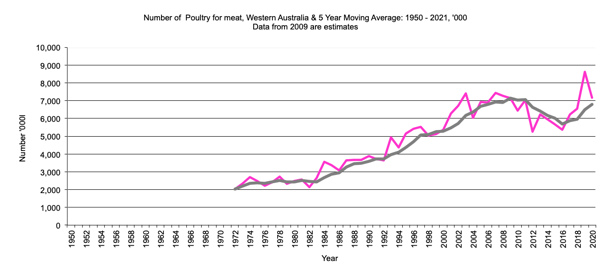
    Western Australia Poultry for Meat

    Number of poultry for meat in thousands

    Number of poultry for meat since 1972

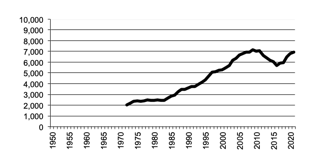
    Number of poultry for meat graph
    Number of poultry for meat data

    Return to top of page
    Back to data for States
    Back to front page

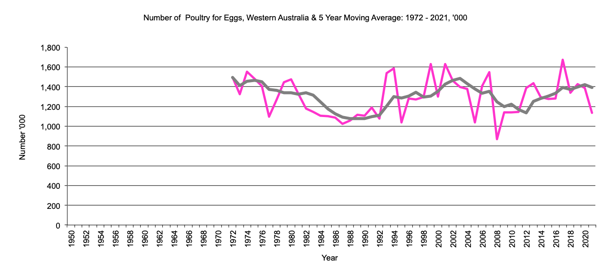
    Western Australia, Poultry for Eggs

    Number of poultry for eggs in thousands

    Number of poultry for eggs since 1972

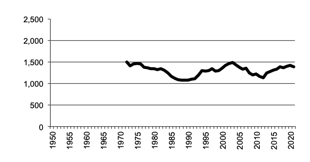
    Number of poultry for eggs graph
    Number of poultry for eggs data

    Return to top of page
    Back to data for States
    Back to front page

            PRODUCTION FILES

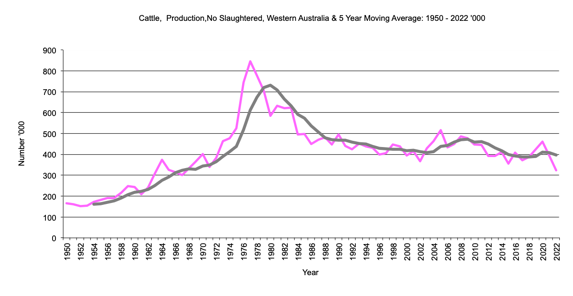
    Western Australia, Cattle, Number Slaughtered

    Number of cattle slaughtered in thousands.
    Prior to 1971 cattle slaughtered included calves slaughtered

    Number of cattle slaughtered since 1950

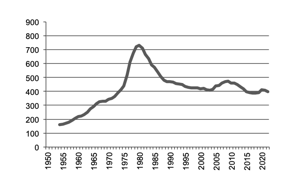
    Western Australia Number of cattle slaughtered graph
    Western Australia Number of cattle slaughtered data

    Return to top of page
    Back to data for states
    Back to front page

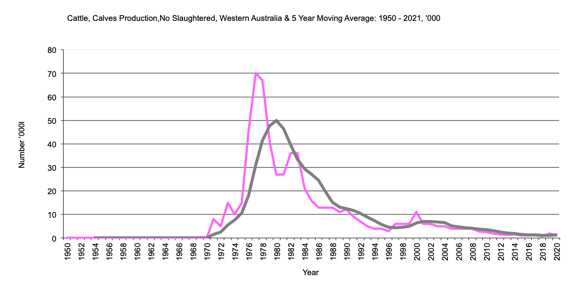
    Western Australia, Calves, Number Slaughtered

    Number of calves slaughtered in thousands.
    Prior to 1971 calves slaughtered included in cattle slaughtered

    Number of calves slaughtered since 1950

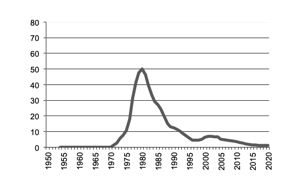
    Western Australia Number of calves slaughtered graph
    Western Australia Number of calves slaughtered data

    Return to top of page
    Back to data for states
    Back to front page

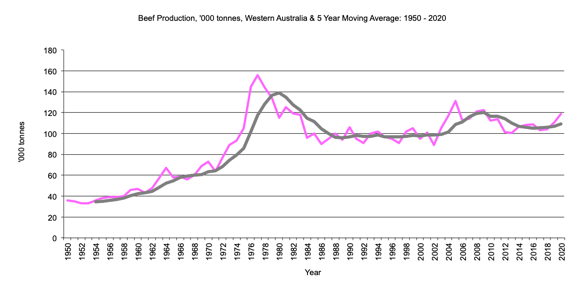
    Western Australia, Beef Production

    Beef production in thousand tonnes.
    From 1950 to 1970 beef production included veal production

    Beef production since 1950

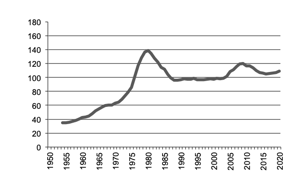
    Western Australia beef production graph
    Western Australia beef production data

    Return to top of page
    Back to data for states
    Back to front page

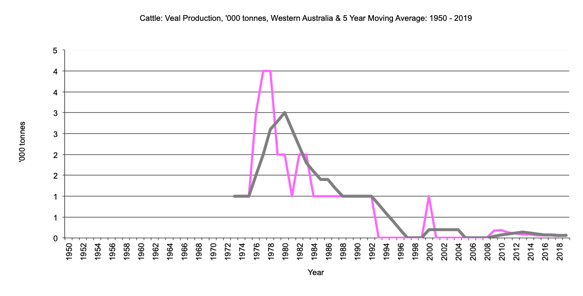
    Western Australia, Veal Production

    Veal production in thousand tonnes.
    Prior to 1971 veal production included in beef production

    Beef production since 1950

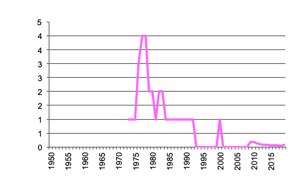
    Western Australia veal production graph
    Western Australia veal production data

    Return to top of page
    Back to data for states
    Back to front page

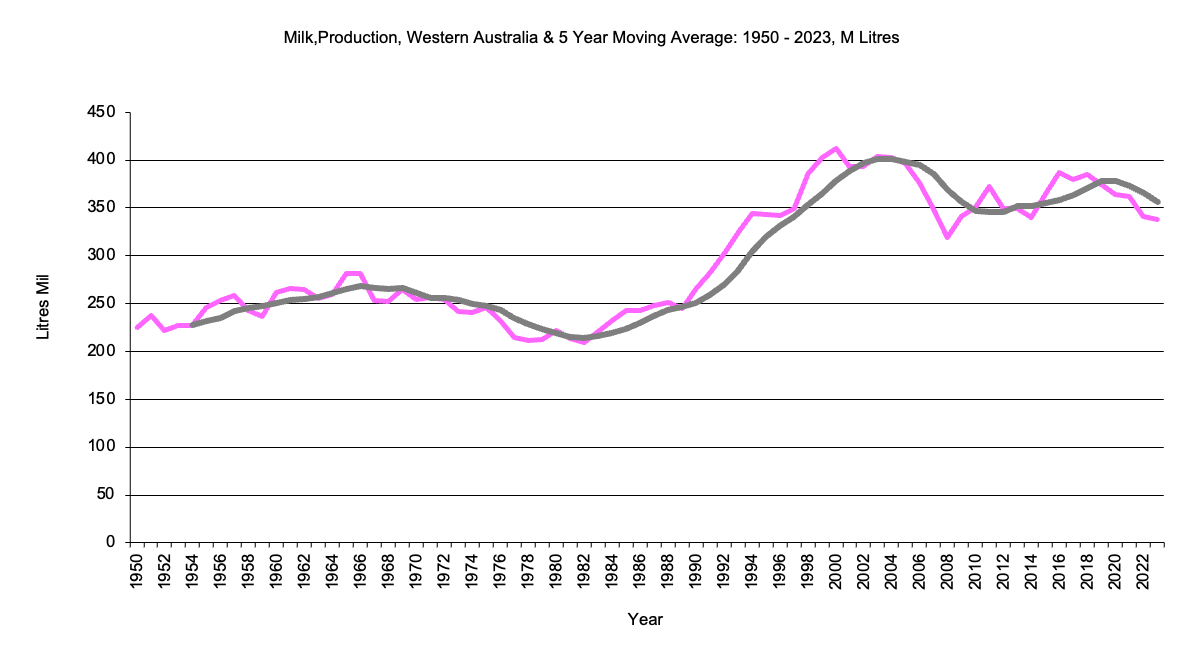
    Western Australia, Milk Production

    Milk production in million lires.

    Milk production since 1950

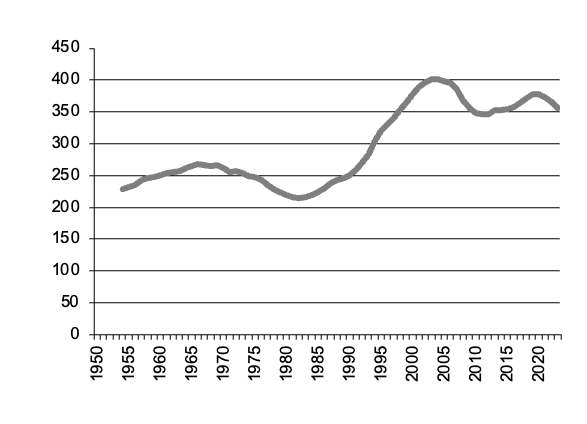
    Western Australia milk production graph
    Western Australia milk production data

    Return to top of page
    Back to data for states
    Back to front page

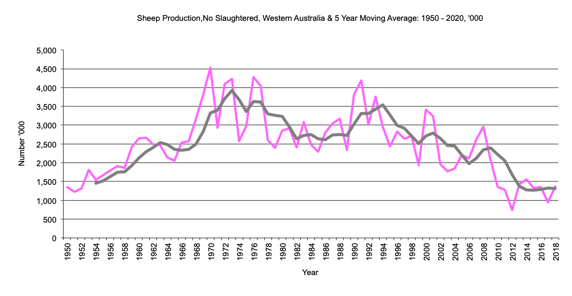
    Western Australia, Sheep, Number Slaughtered

    Number of sheep slaughtered in thousands.
    From 1950 to 1971 sheep slaughtered included lambs slaughtered

    Number of sheep slaughtered since 1950

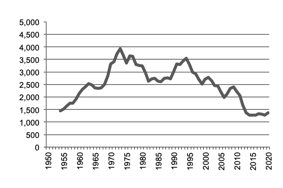
    Western Australia sheep of lambs slaughtered graph
    Western Australia Number of sheep slaughtered data

    Return to top of page
    Back to data for states
    Back to front page

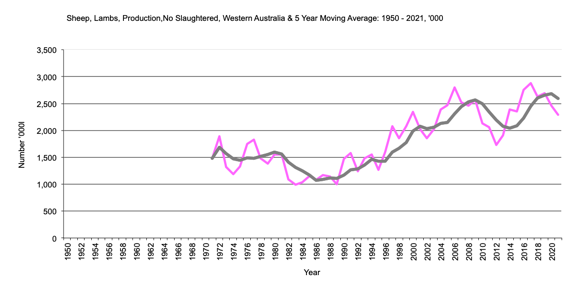
    Western Australia, Lambs, Number Slaughtered

    Number of lambs slaughtered in thousands.
    From 1950 to 1971 lambs slaughtered included sheep slaughtered

    Number of sheep slaughtered since 1950

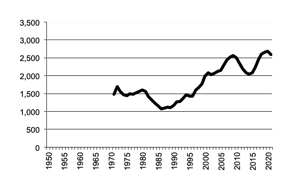
    Western Australia Number of lambs slaughtered graph
    Western Australia Number of lambs slaughtered data

    Return to top of page
    Back to data for states
    Back to front page

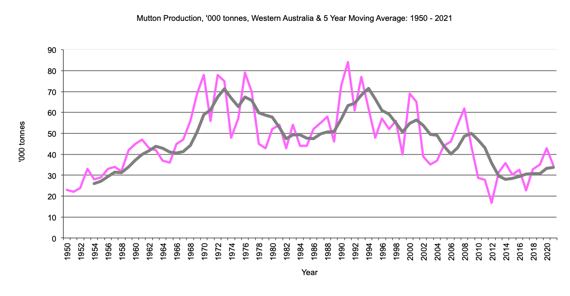
    Western Australia, Mutton Production

    Mutton production in thousand tonnes.
    From 1950 to 1970 includes lamb production

    Mutton production since 1950

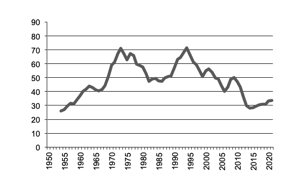
    Western Australia mutton production graph
    Western Australia mutton production data

    Return to top of page
    Back to data for states
    Back to front page

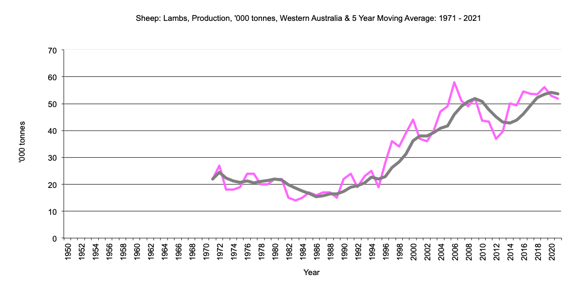
    Western Australia, Lamb Production

    Lamb production in thousand tonnes.
    Prior to 1971 included in mutton production

    Lamb production since 1970

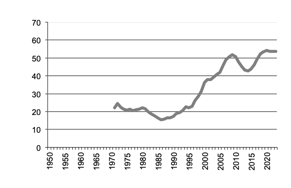
    Western Australia lamb production graph
    Western Australia lamb production data

    Return to top of page
    Back to data for states
    Back to front page

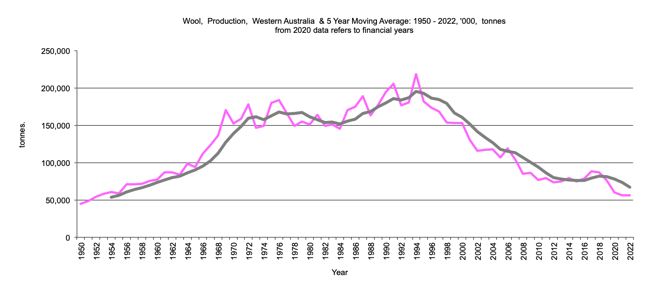
    Western Australia, Wool Production

    Wool production in tonnes.

    Lamb production since 1950

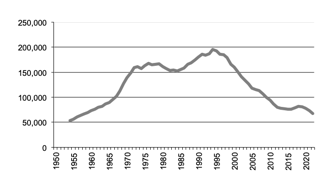
    Western Australia wool production graph
    Western Australia wool production data

    Return to top of page
    Back to data for states
    Back to front page

    Western Australia, Pigs, Number Slaughtered

    Number of pigs slaughtered in thousands.

    Number of pigs slaughtered since 1950

    Western Australia Number of pigs slaughtered graph
    Western Australia Number of pigs slaughtered data

    Return to top of page
    Back to data for states
    Back to front page

    Western Australia, Pig Meat Production

    Pig meat production in thousand tonnes.

    Pig meat production since 1950

    Western Australia pig meat production graph
    Western Australia pig meat production data

    Return to top of page
    Back to data for states
    Back to front page

    Western Australia, Chickens, Number Slaughtered

    Number of chickens slaughtered in thousands.

    Number of chickens slaughtered since 1950

    Western Australia Number of chickens slaughtered graph
    Western Australia Number of chickens slaughtered data

    Return to top of page
    Back to data for states
    Back to front page

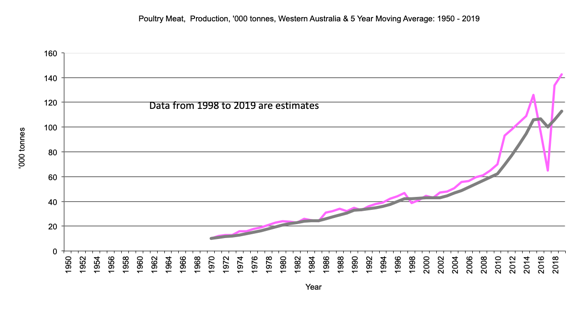
    Western Australia, Poultry Meat Production

    Poultry meat production in thousand tonnes.

    Poultry meat production since 1950

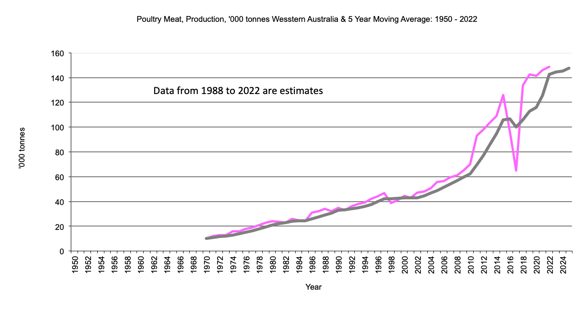
    Western Australia poultry meat production graph
    Western Australia poultry meat production data

    Return to top of page
    Back to data for states
    Back to front page

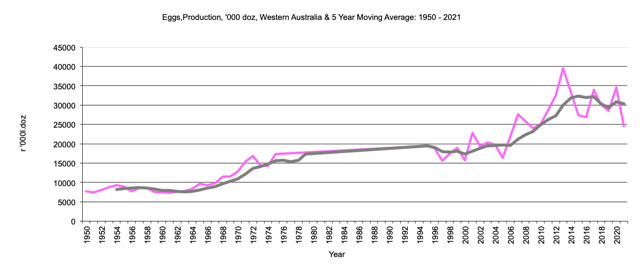
    Western Australia, Egg Production

    Egg production in thousand dozen

    Egg production since 1950

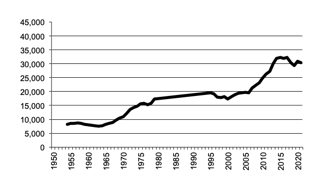
    Western Australia egg production graph
    Western Australia egg production data

    Return to top of page
    Back to data for states
    Back to front page


    AgEc Data
    Last Updated 23 June 2020
    Site prepared by Bob Cason (rgcason@webone.com.au)Email for more information