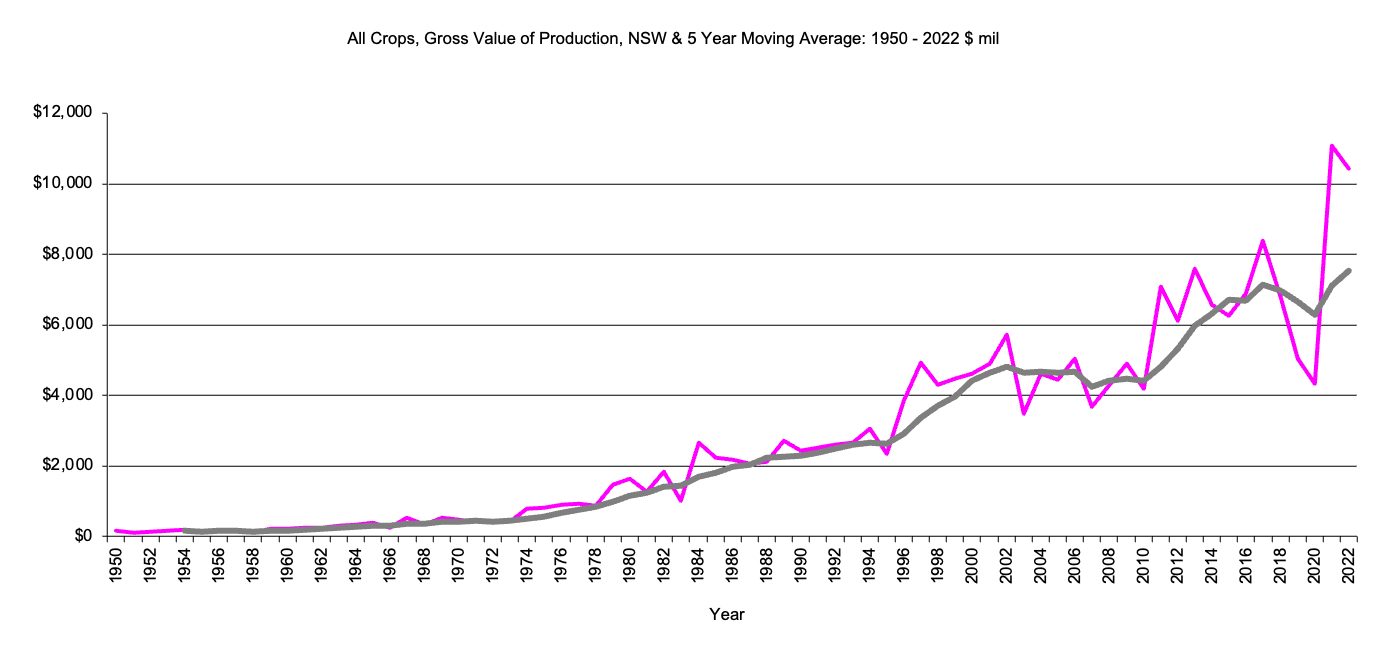
"All Crops - Gross Value of production, $m,5 year moving average"
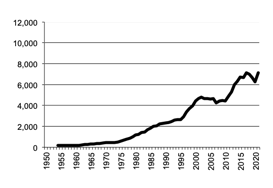
NSW All Crops, Gross Value Production graph
NSW All Crops, Gross Value Production data
Return to top of page
Back to Crops
Back to front page
All Crops includes: crops, fruit & vegetables, grass & hay.
|
|
NSW, All Crops - Gross Value Production
|
"All Crops - Gross Value of production, $m,5 year moving average"
|
NSW All Crops, Gross Value Production graph |
Return to top of page |
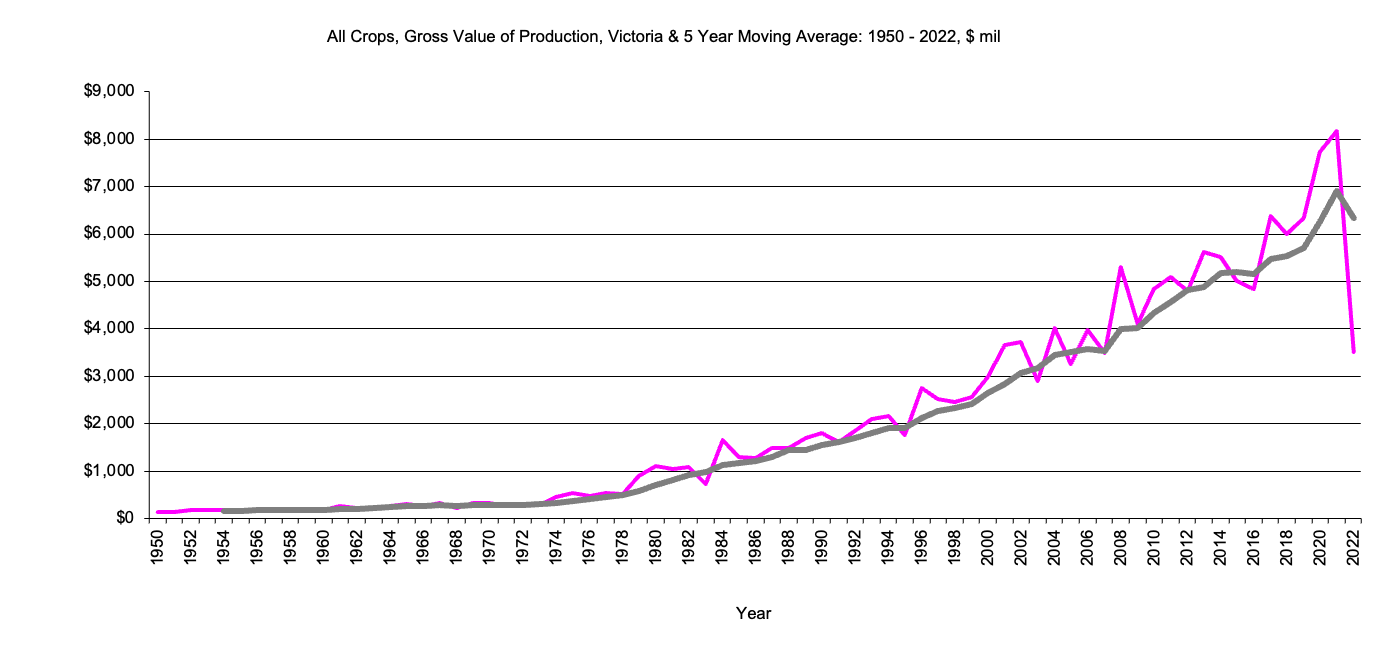
Victoria, All Crops - Gross Value Production
|
All Crops - Gross Value of production, $m,5 year moving average" 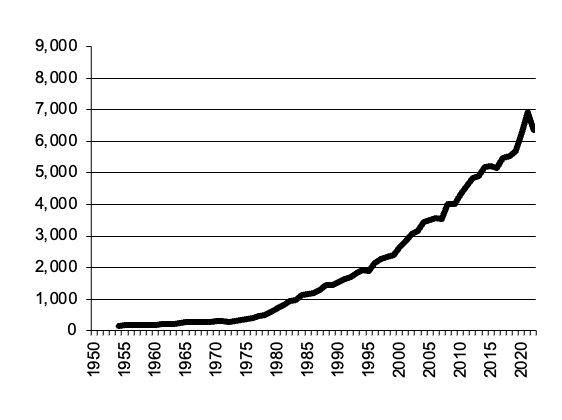
|
Victoria All Crops, Gross Value Production graph |
Return to top of page |
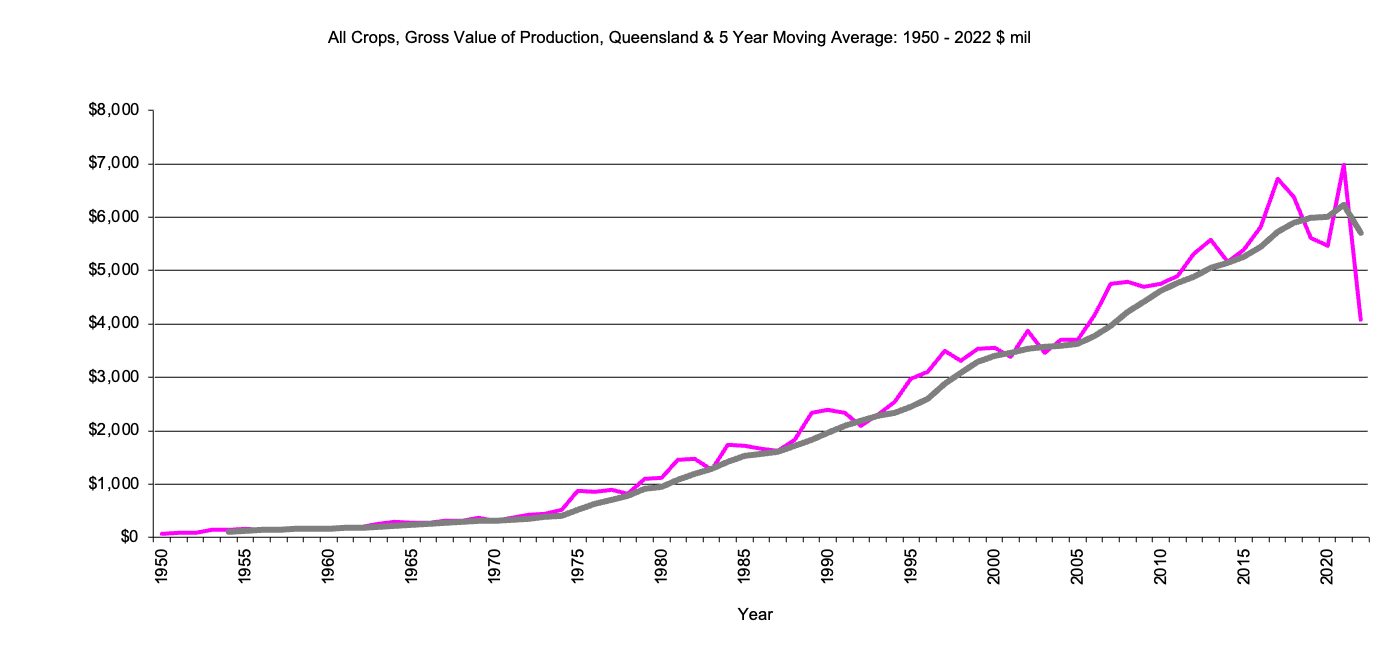
Queensland, All Crops - Gross Value Production
|
All Crops - Gross Value of production, $m,5 year moving average" 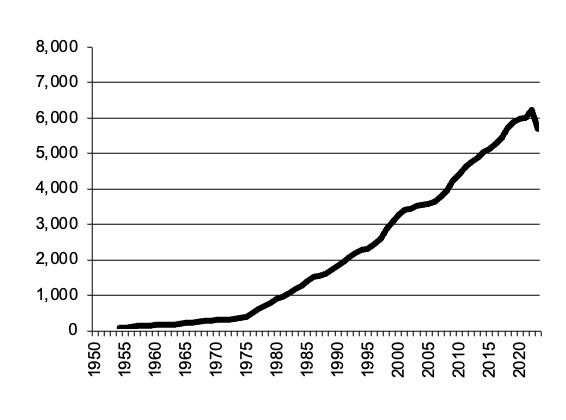
|
Queensland All Crops, Gross Value Production graph |
Return to top of page |
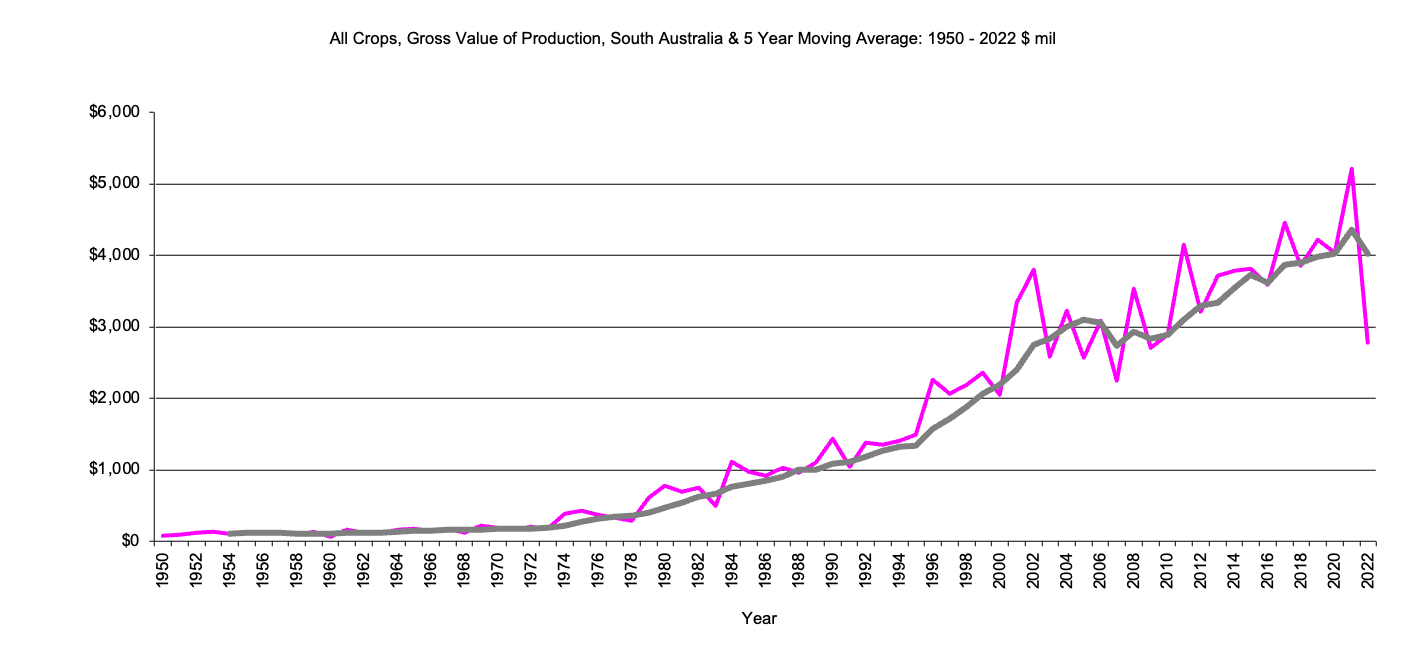
South Australia, All Crops - Gross Value Production
|
All Crops - Gross Value of production, $m,5 year moving average" 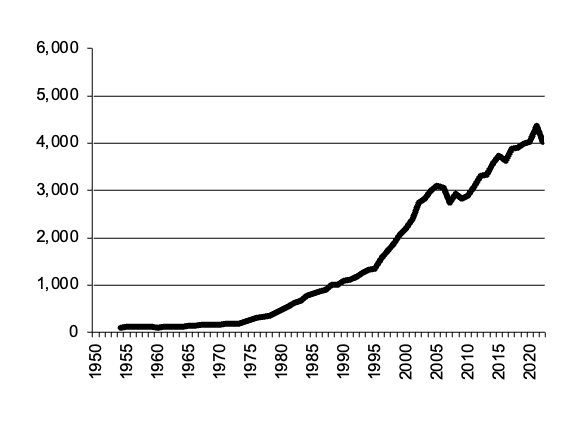
|
South Australia All Crops, Gross Value Production graph |
Return to top of page |
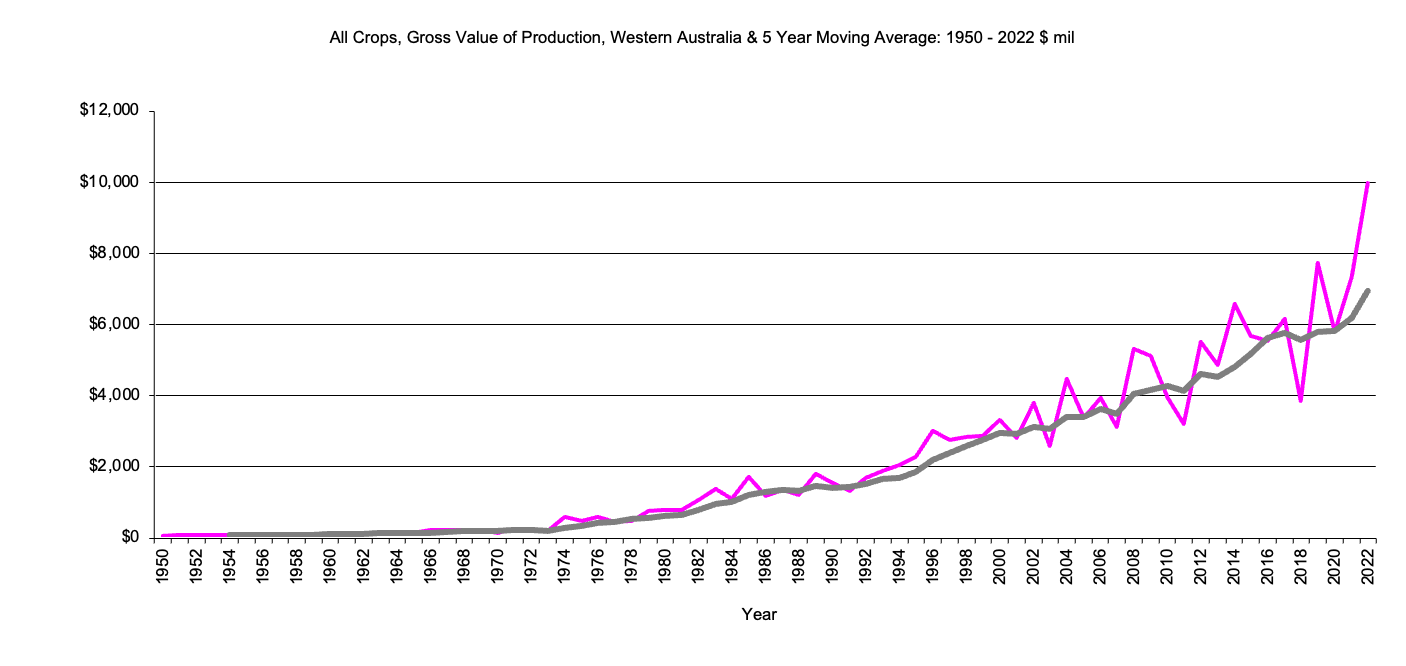
Western Australia, All Crops - Gross Value Production
|
All Crops - Gross Value of production, $m,5 year moving average" 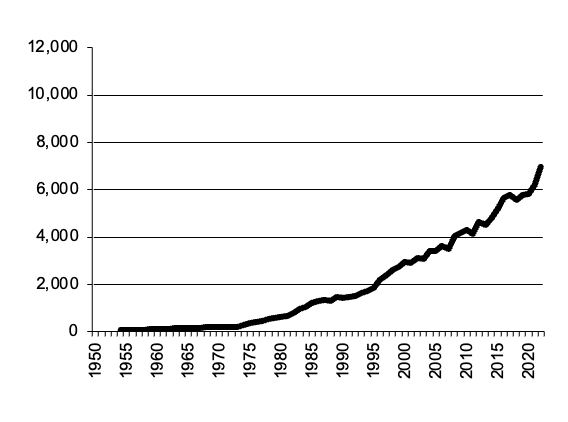
|
Western Australia All Crops, Gross Value Production graph |
Return to top of page |
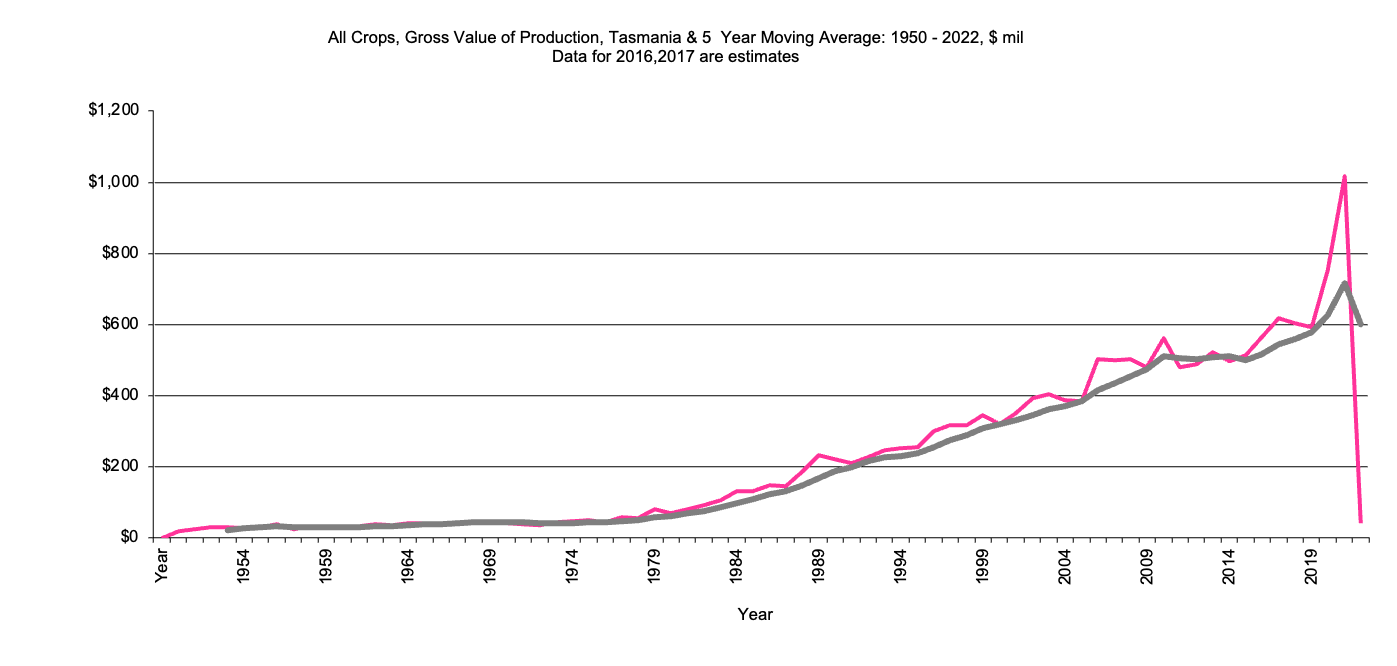
Tasmania, All Crops - Gross Value Production
|
All Crops - Gross Value of production, $m,5 year moving average" 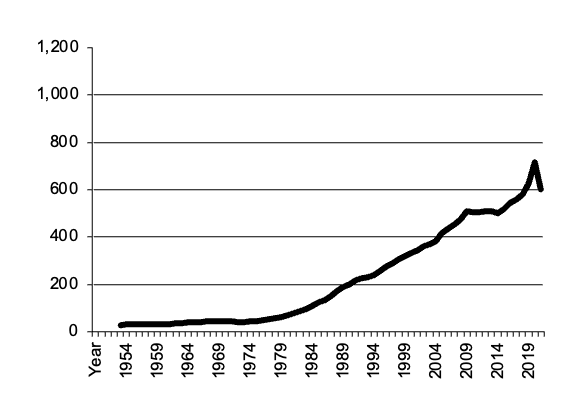
|
Tasmania All Crops, Gross Value Production graph |
Return to top of page |
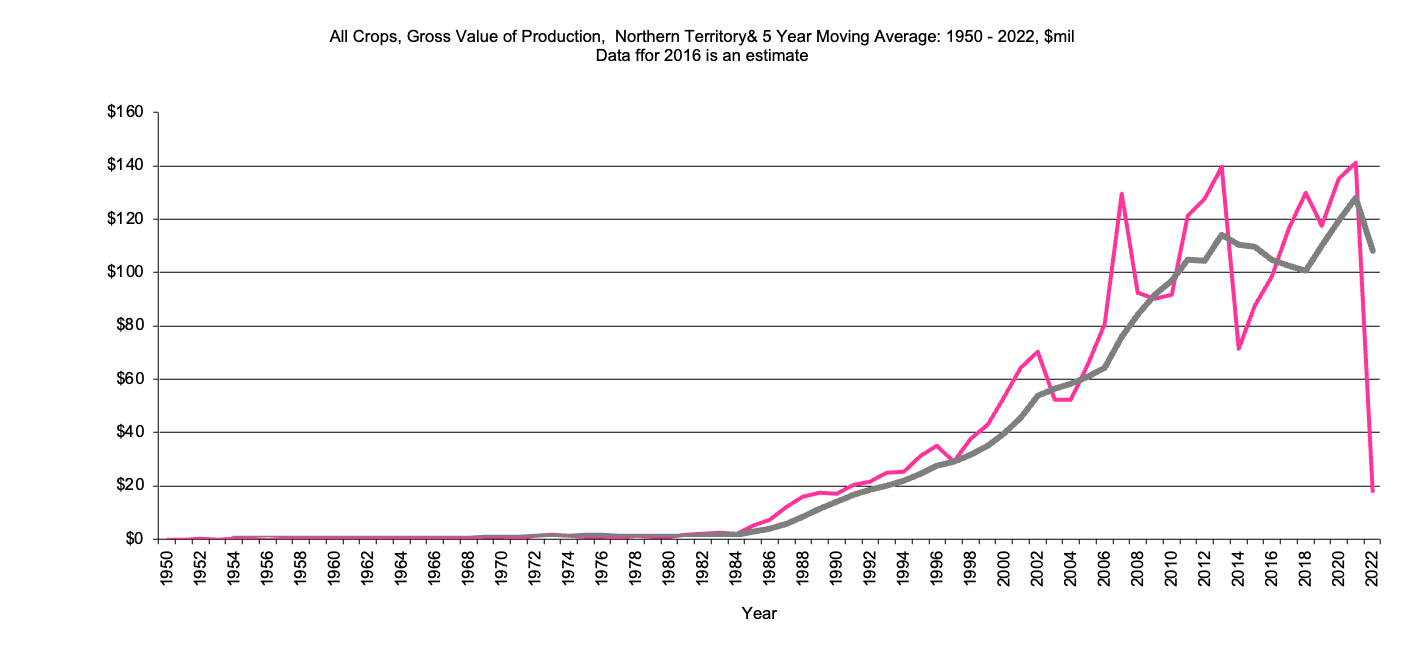
Northern Territory, All Crops - Gross Value Production
|
All Crops - Gross Value of production, $m,5 year moving average" 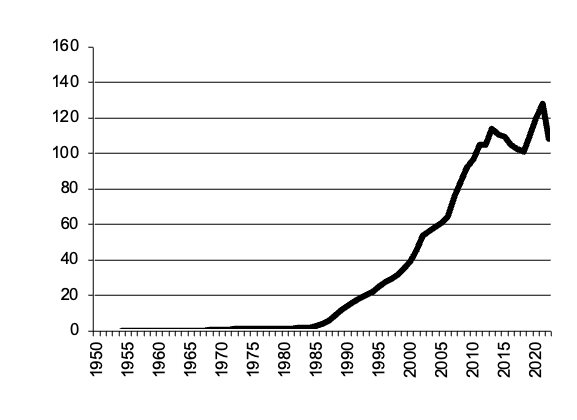
|
Northern Territory All Crops, Gross Value Production graph |
Return to top of page |