This page has data for all agriculture; ie crops and livestock combined, from 1950 to the present and the 5 year moving average.
Data for each state is also available. To see data by state, follow the link to state data.
Total Agriculture Gross Value of Production
|
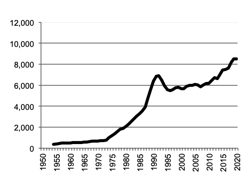
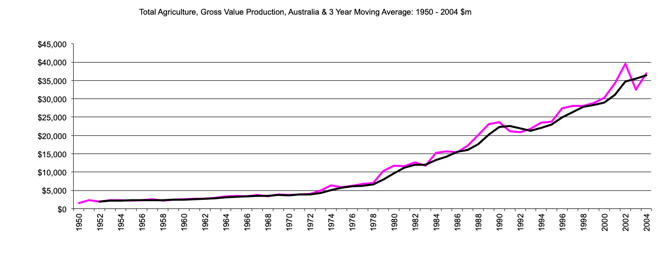
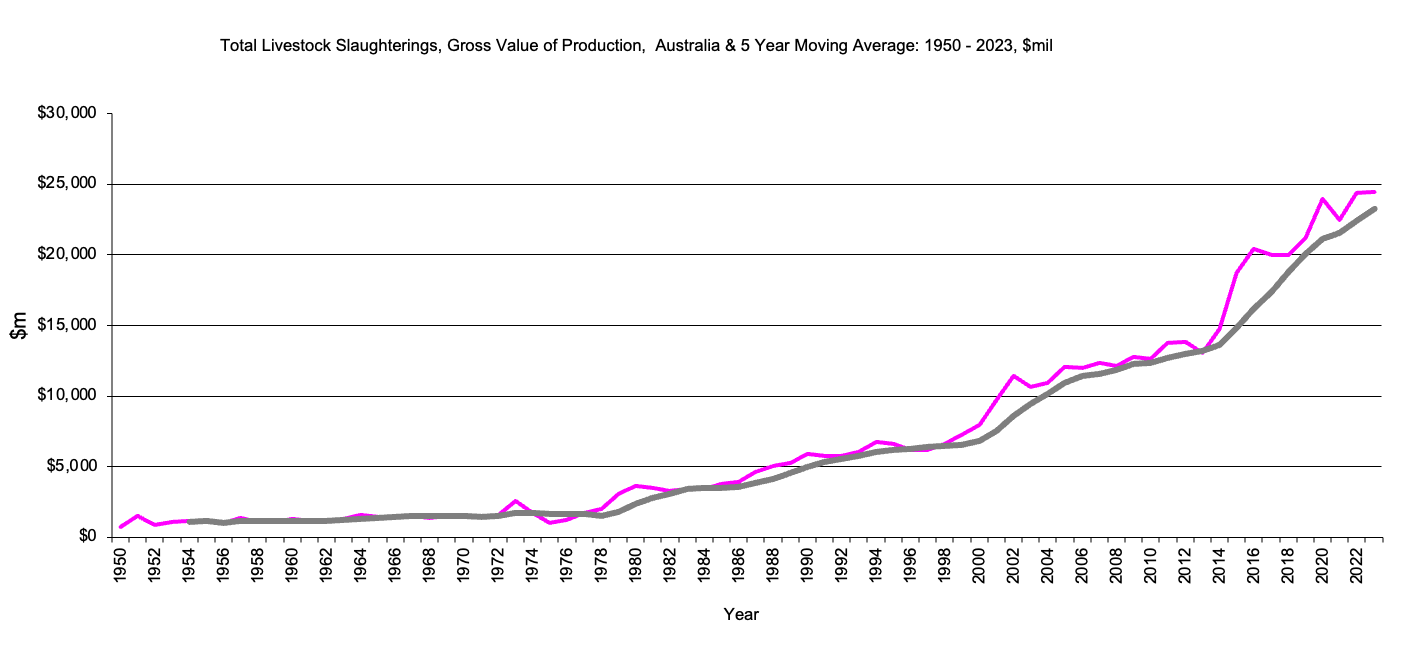
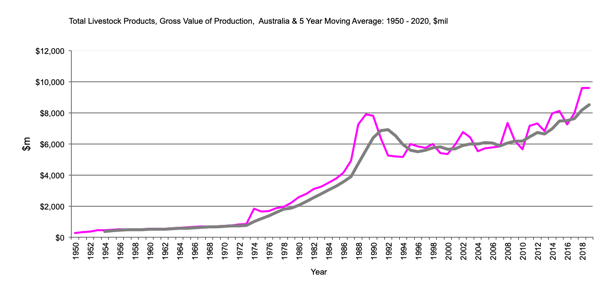
Total Agriculture Gross Value of Production $m 5 year moving average
|
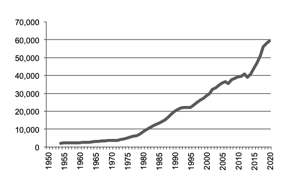
Gross value production, Total Agriculture graph |
Return to top of page |
|
Area of all crops in million hectares 5 year moving average |
Area - All Crops graph |
Return to top of page |
Gross Value Production- All Crops
|
Gross Value Production of all crops in $million5 year moving average |
Gross Value Production- All Crops graph |
Return to top of page |
|
Gross value production livestock slaughtered million dollars
|
Gross value production, Total Livestock Slaughtered graph |
Return to top of page |
Total Livestock Products - Gross Value Production
|
Total Livestock Products Gross Value of Production $m 5 year moving average
|
Gross value production, Total Livestock Products graph |
Return to top of page |