Agricultural Establishments
Introduction
This page has NSW data for agricultural establishments from 1950 to the present and the 5 year moving average. There is data for the area sown.
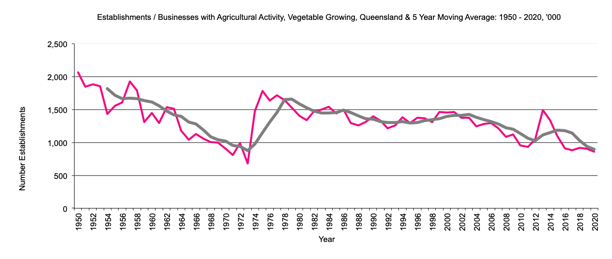
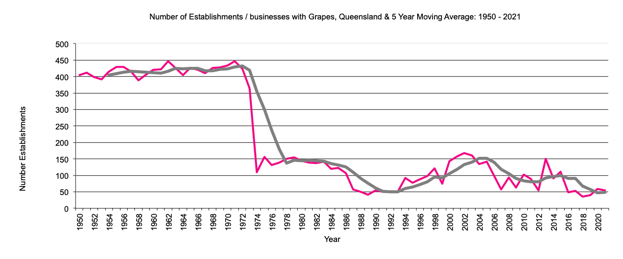
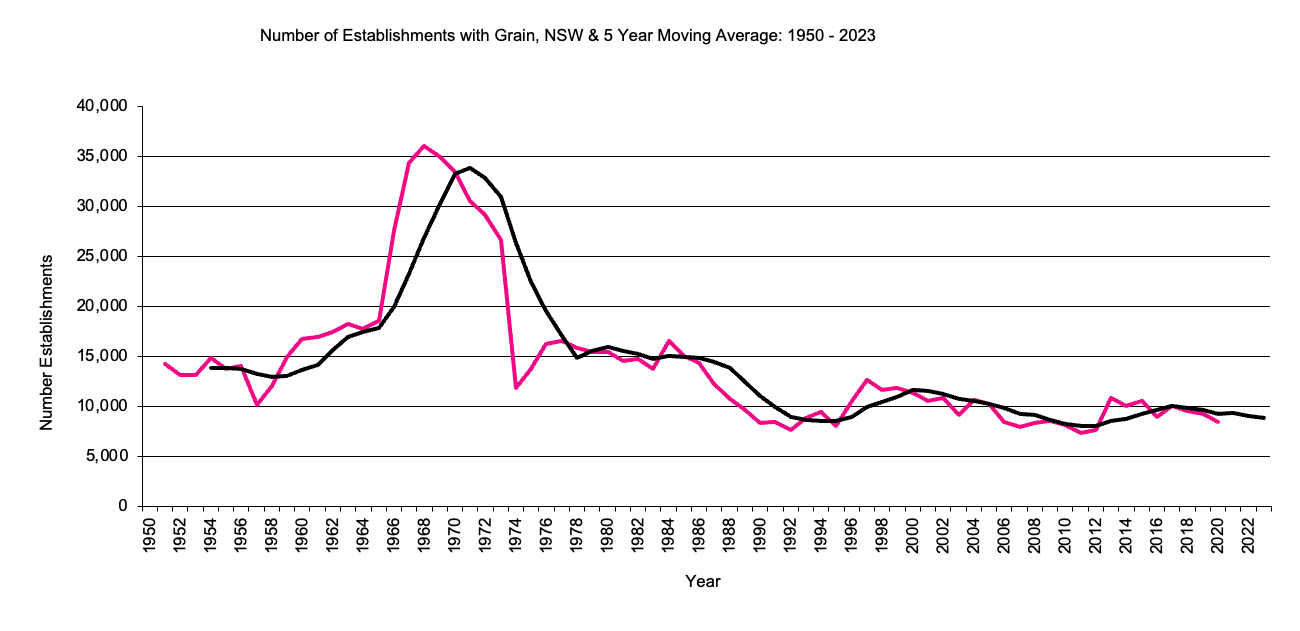
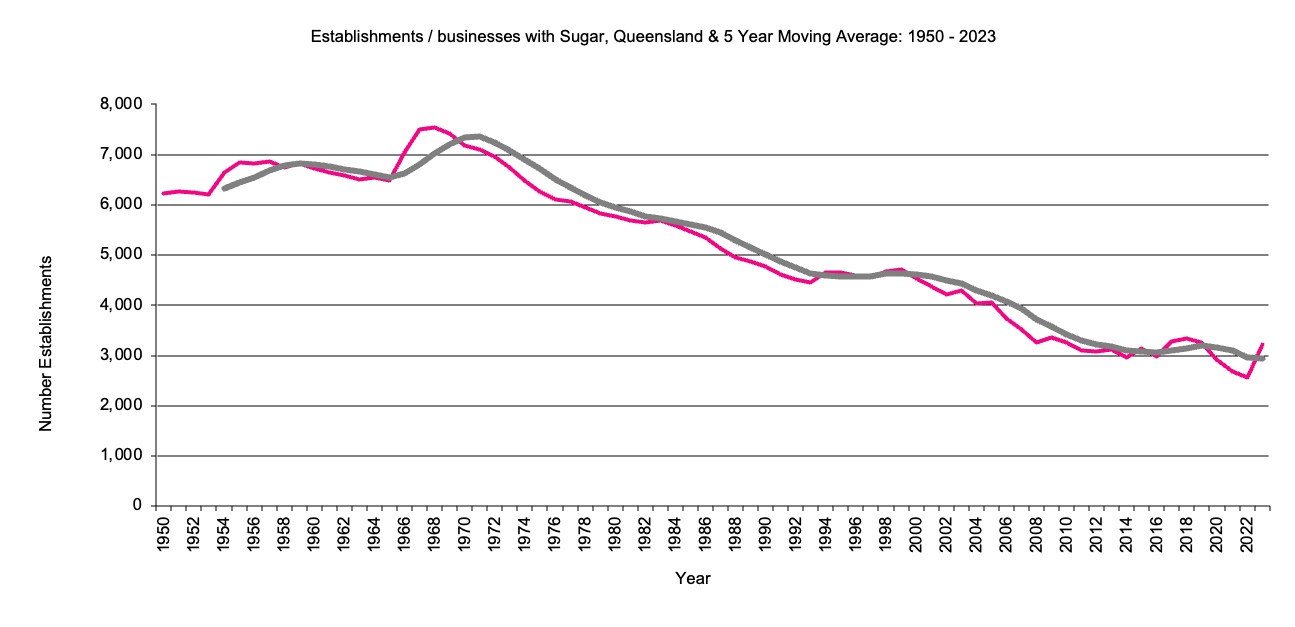
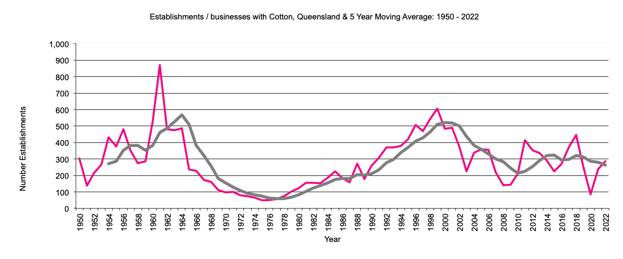
The Establishments to be included here are:all establishments, establishments with Grain; Sugar cane, Cotton growing, Grapes, Vegetables including potatoes.
|
|
Total Establishments/ Businesses
Go to Total Establishments/Businesses
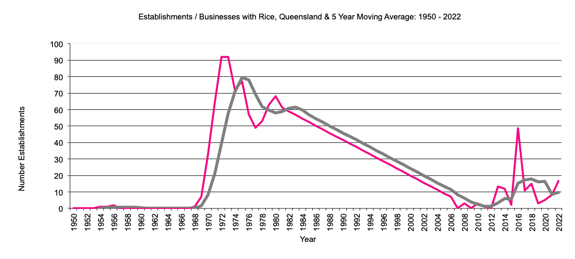
Crop Establishments/Businesses
|
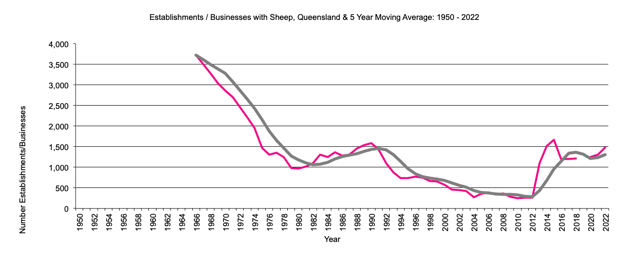
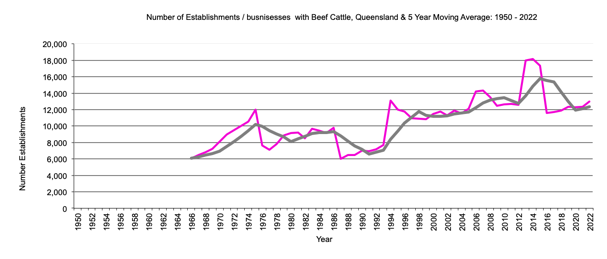
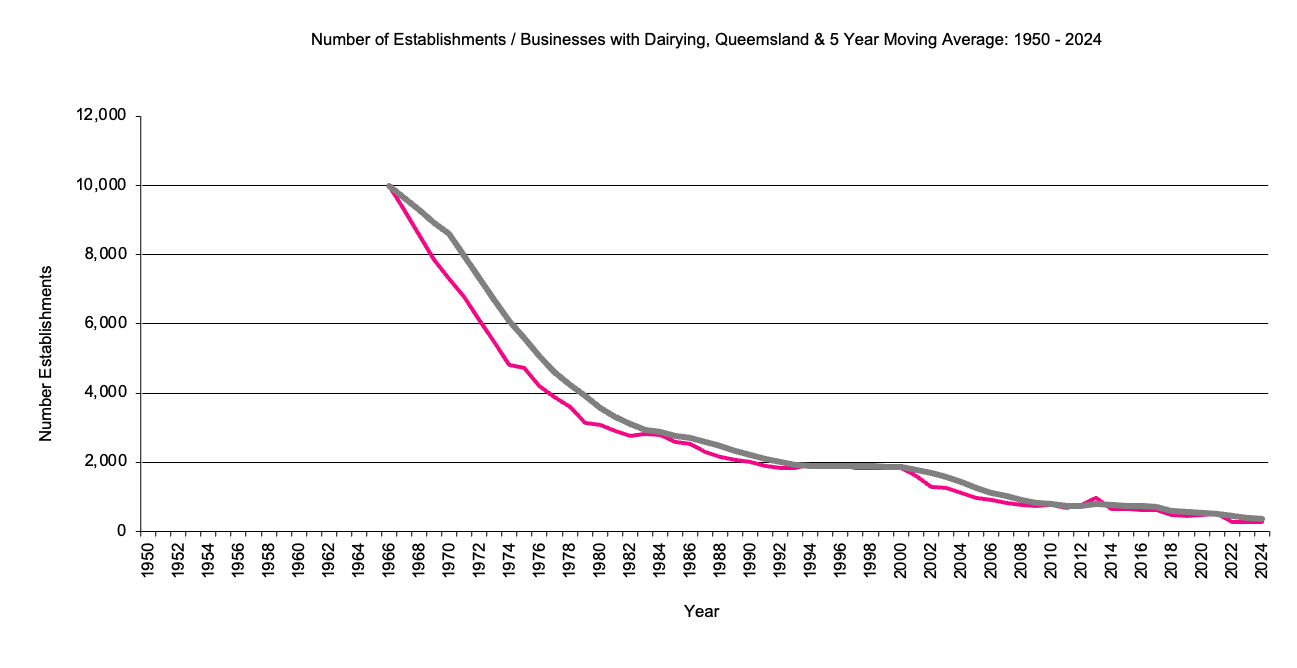
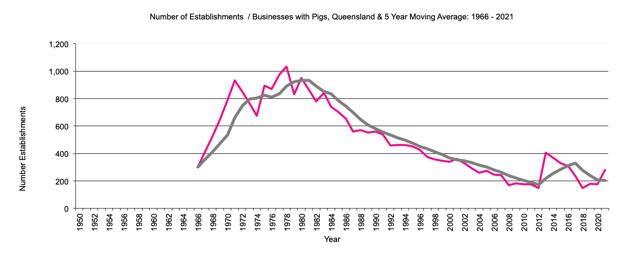
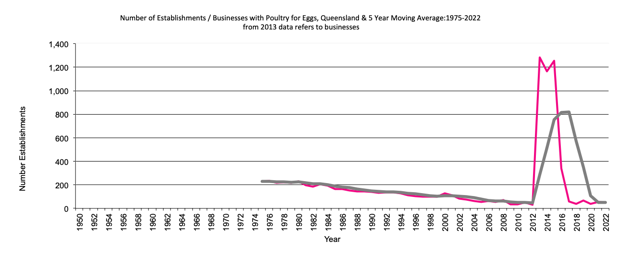
Livestock Establishments/Businesses
Data Series Ceased 2012
|
An establishment is defined as all the operations carried out by one enterprise at a single physical location; where a physical location is regarded as each individual agricultural holding. In addition where two or more holdings in one state are operated by one management and are under one set of accounts these holdings are regarded as one establishment.(Agricultural Sector, Part 1, Structure of Operating Units, 1974-75, Cat No 10.82, ABS February 1977)
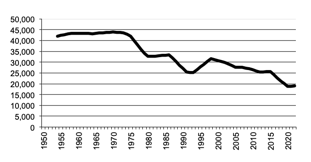
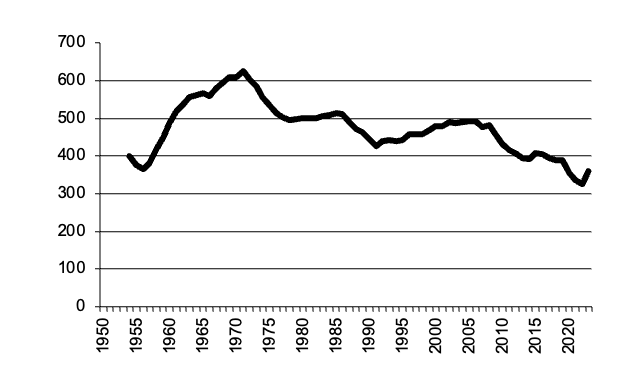
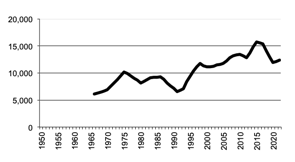
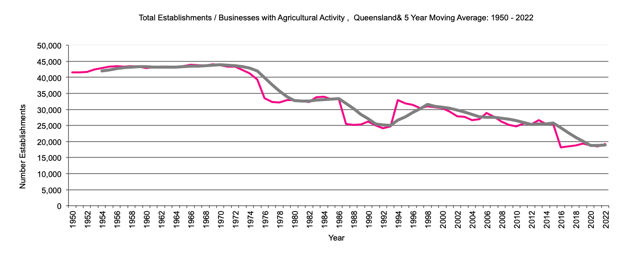
Queensland Establishments with Agricultural Activity - Total
Table width = "100%">
|
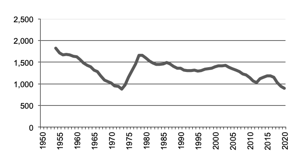
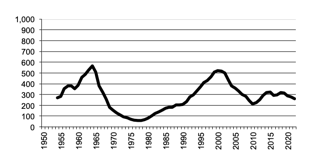
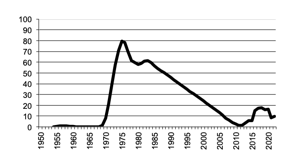
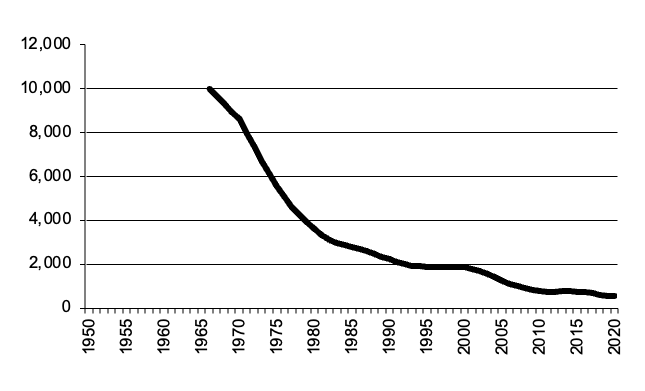
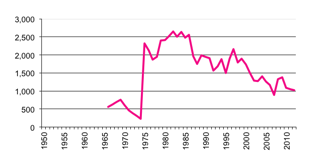
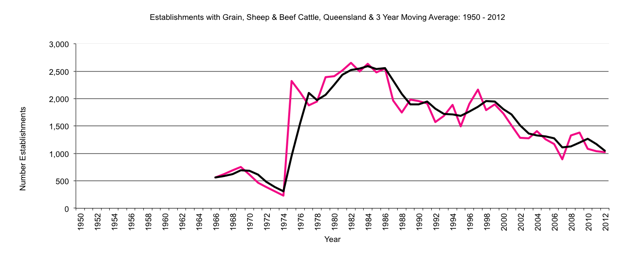
Queensland Establishments with Grain, Sheep & Beef Cattle to 2012
|
Table width = "100%">
|
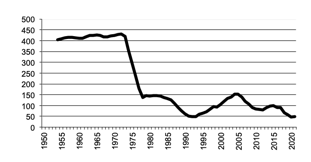
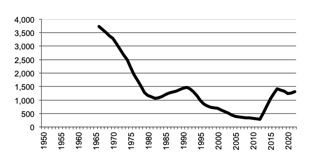
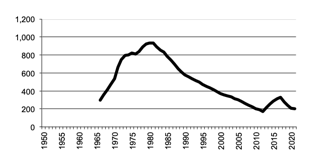
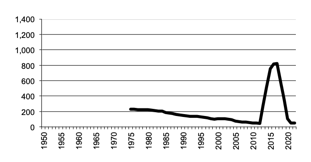
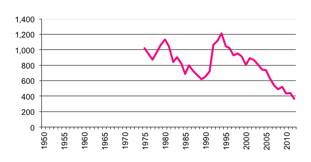
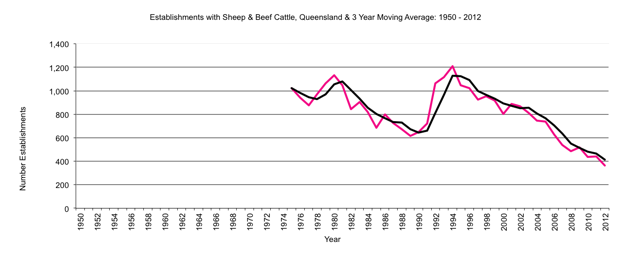
Queensland Establishments with Sheep & Beef Cattle to 2012
|
AgEc Data
Last Updated 3 March 2022
Site prepared by Bob Cason (rgcason@webone.com.au)Email
for more information
