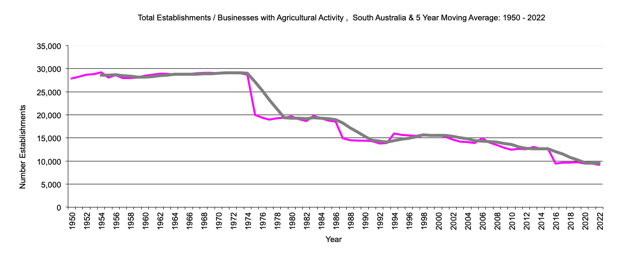
South Australia Establishments with Agricultural Activity - Total
|
number of establishments with agricultural activity 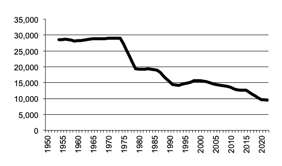
|
South Australia Total establishments with agricultural activity graph |
Return to top of page Back to data for States Back to front page |
|
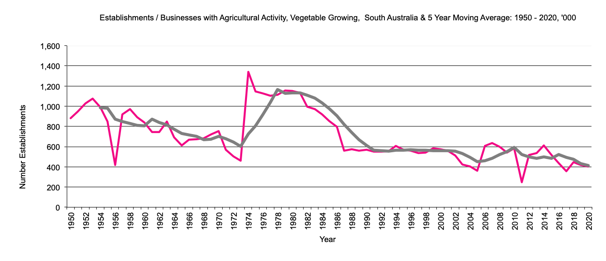
Number of establishments with vegetables 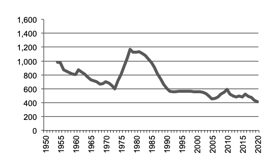
|
South Australia establishments with vegetables graph |
Return to top of page |
|
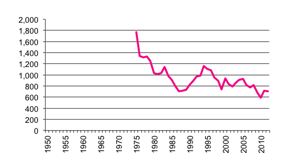
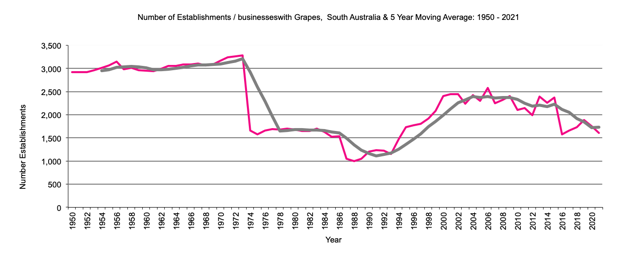
Number of establishments with Grapes, 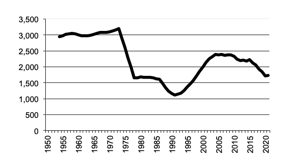
|
South Australia establishments with grapes graph |
Return to top of page |
|
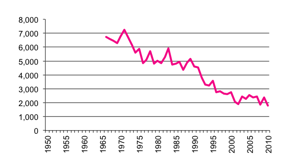
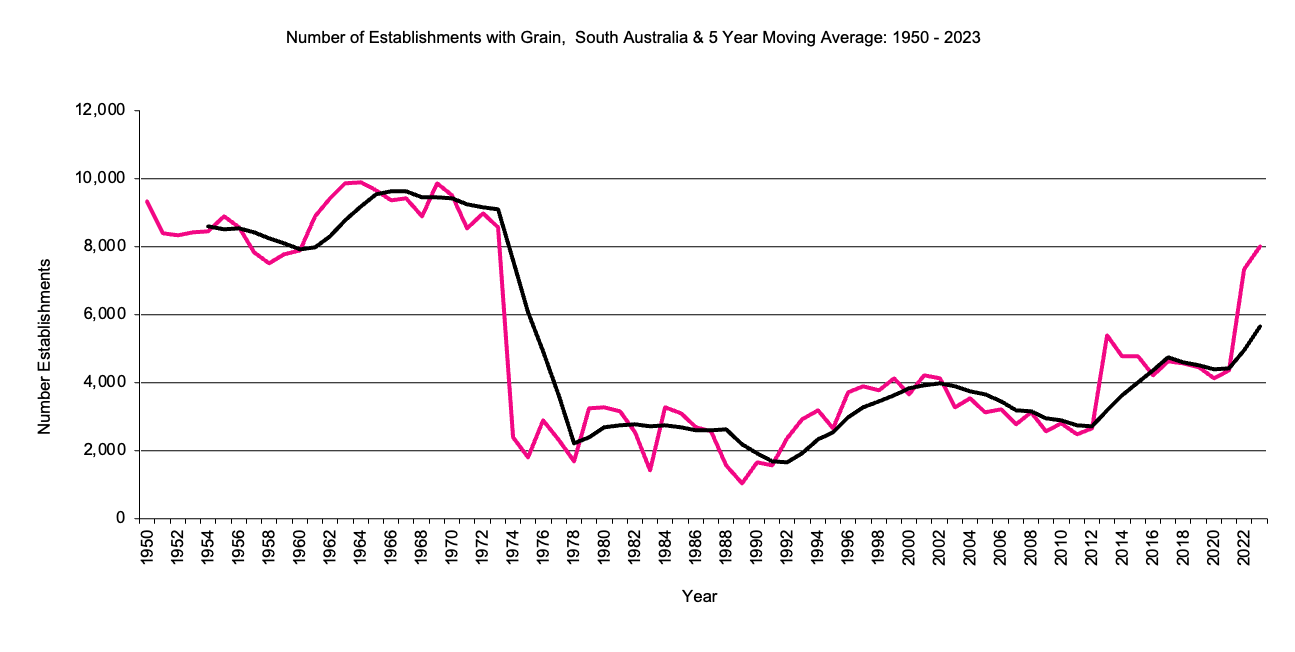
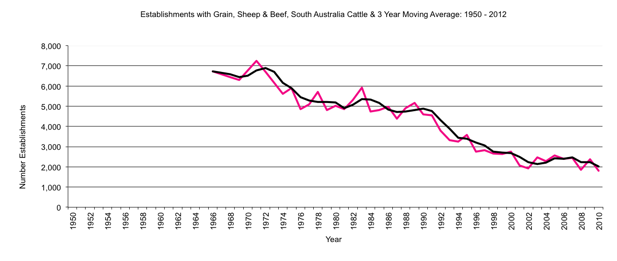
Number of establishments with Grain, 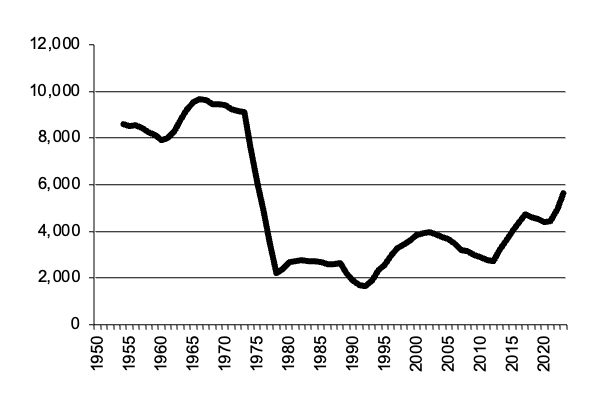
|
South Australia establishments with grain graph |
Return to top of page |
|
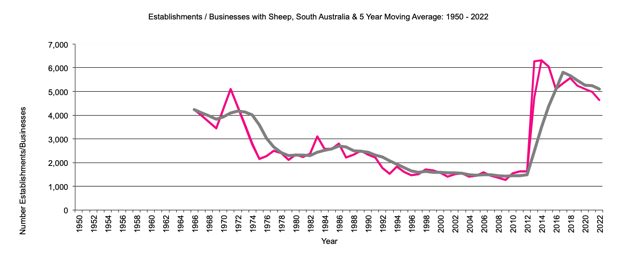
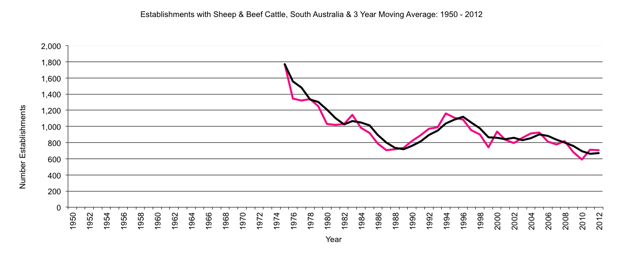
Number of establishments with Sheep, 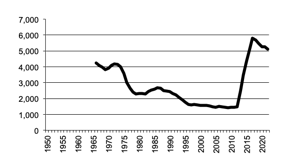
|
South Australia establishments with Sheep graph |
Return to top of page |
|
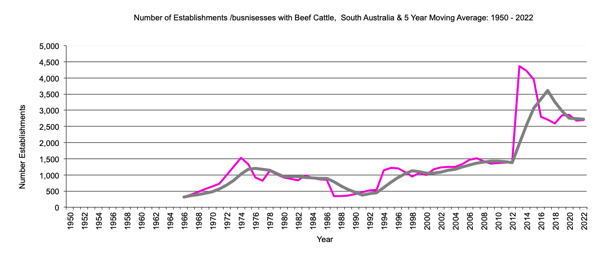
Number of establishments with beef, 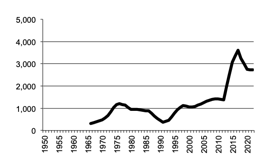
|
South Australia establishments with beef graph |
Return to top of page |
|
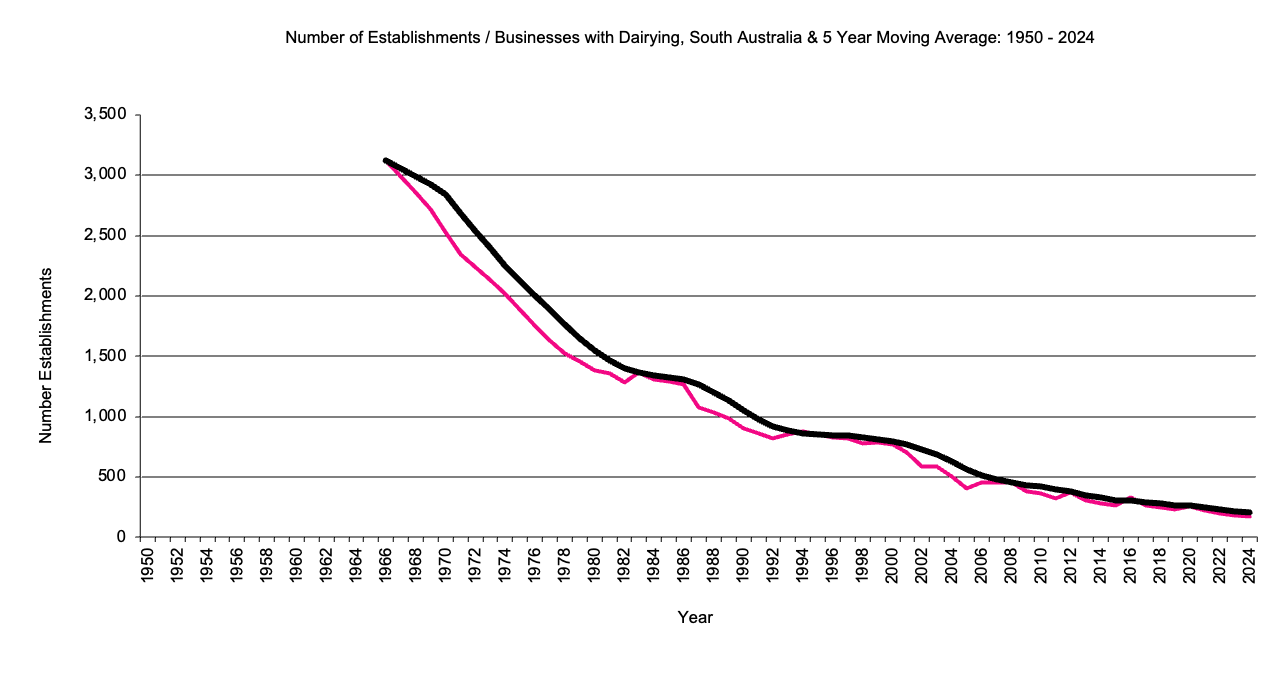
Number of establishments with dairy, 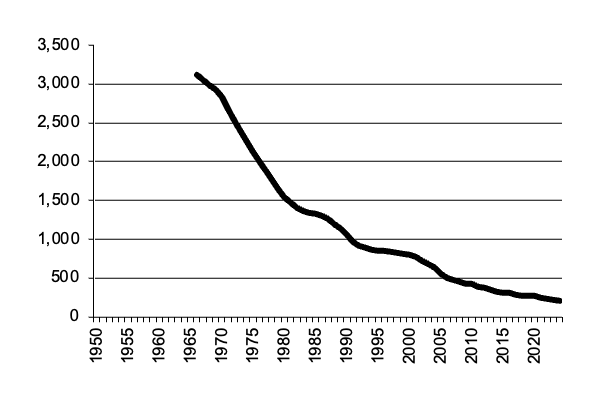
|
South Australia establishments with dairy graph |
Return to top of page |
|
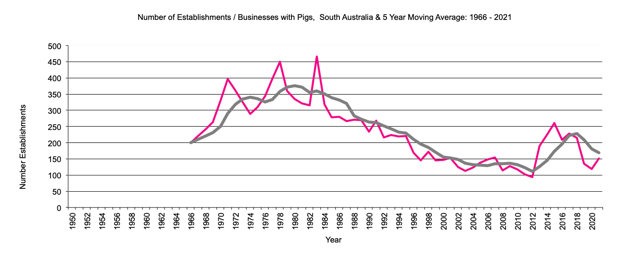
Number of establishments with dairy, 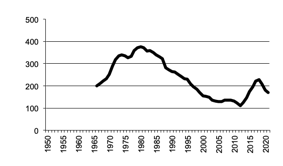
|
South Australia establishments with Pigs graph |
Return to top of page |
|
Number of establishments with Poultry for Meat, 
|
South Australia establishments with Poultry for Meat graph |
Return to top of page |
|
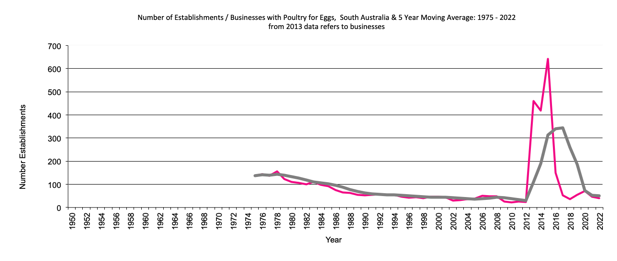
Number of establishments with Poultry for Eggs, 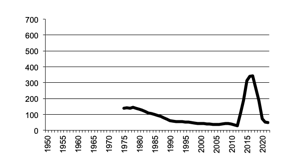
|
South Australia establishments with Poultry for Eggs graph |
Return to top of page |
South Australia Establishments with Grain, Sheep & Beef Cattle to 2012