Agricultural Data For Australia, Tasmania, Livestock Production

 1950 to Current Data

Introduction

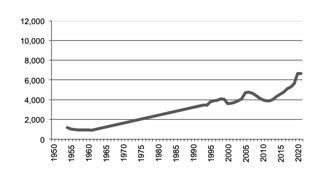
This page has Tasmania data for livestock producction from 1950 to the present and the 3 year moving average.  There is data for cattle sheep and pigs.  

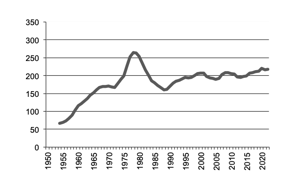
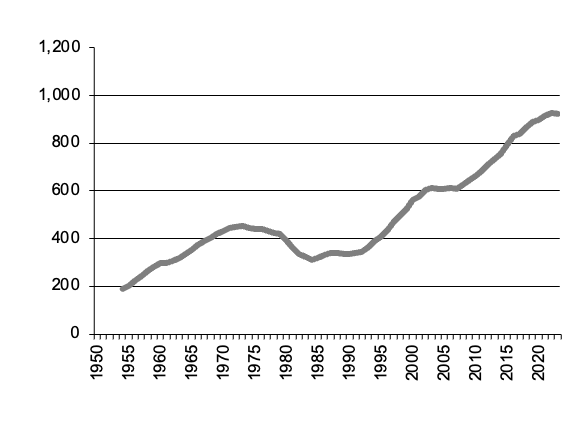
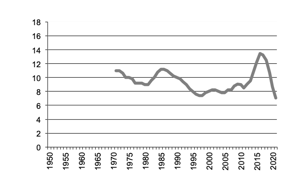
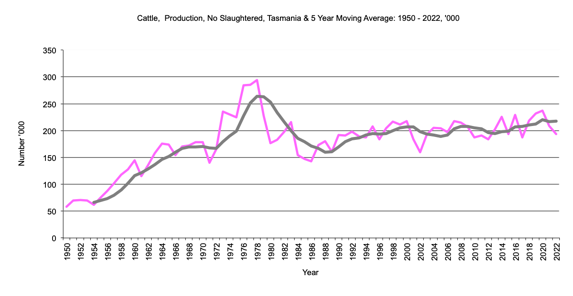
Tasmania, Cattle, Number Slaughtered

Prior to 1971 cattle slaughtered included calves slaughtered

Number of cattle slaughtered in thousands.
5 year moving average

Number of cattle slaughtered since 1950

Tasmania     Number of cattle slaughtered     graph
Tasmania     Number of cattle slaughtered     data

Return to top of page
Back to data for states
Back to front page

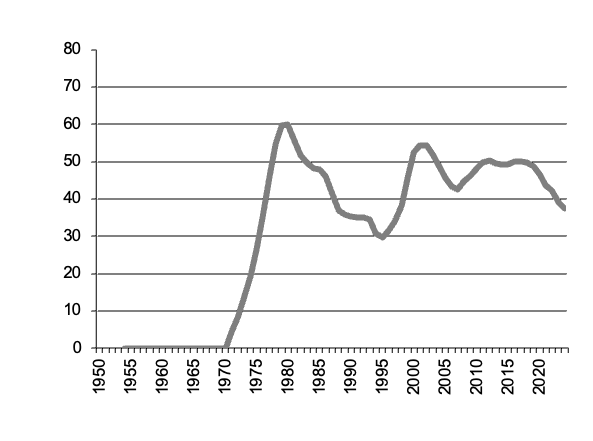
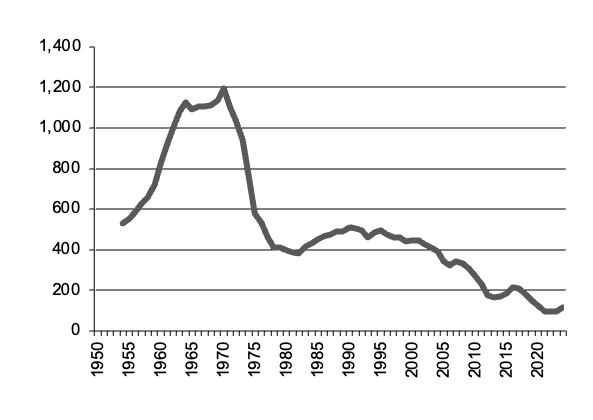
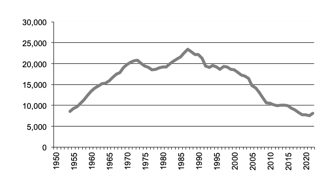
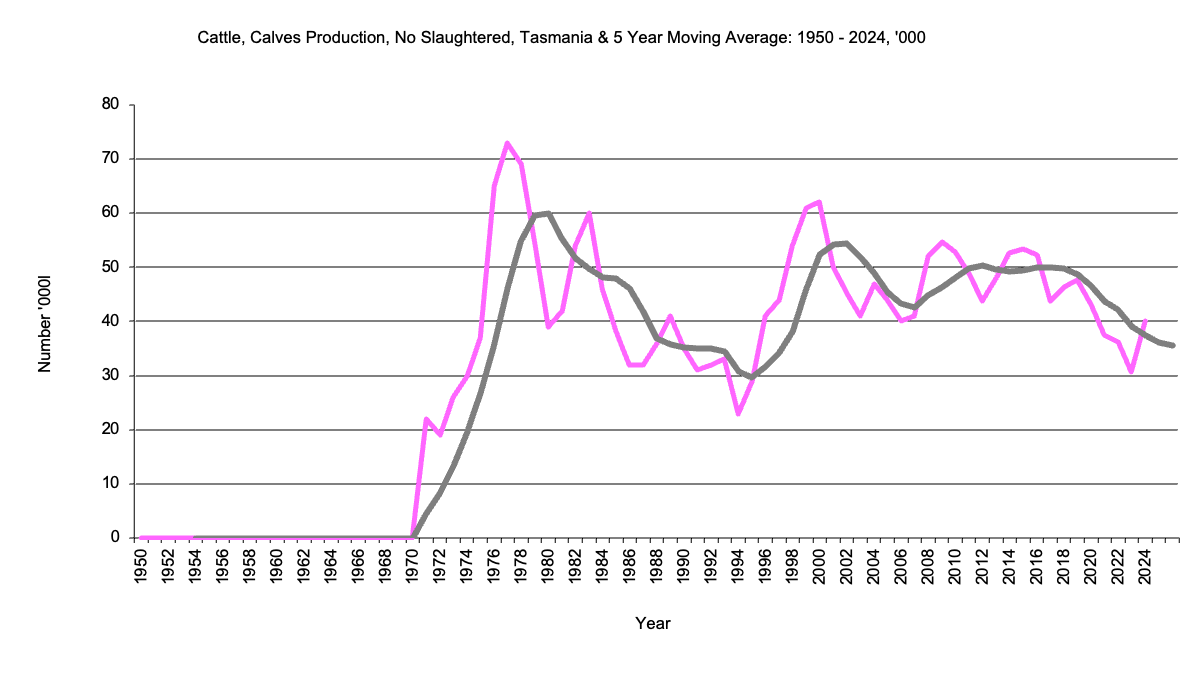
Tasmania, Calves, Number Slaughtered

Number of calves slaughtered in thousands.
5 year moving average

Number of calves slaughtered since 1950

Tasmania     Number of calves slaughtered     graph
Tasmania     Number of calves slaughtered    data

Return to top of page
Back to data for states
Back to front page

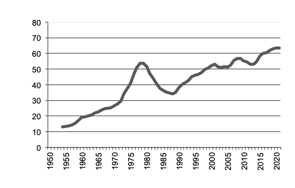
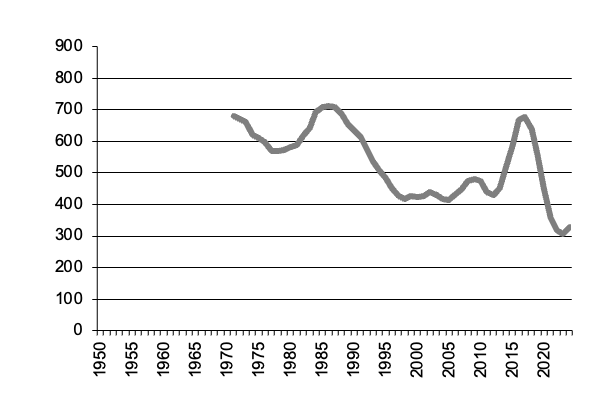
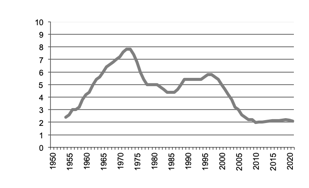
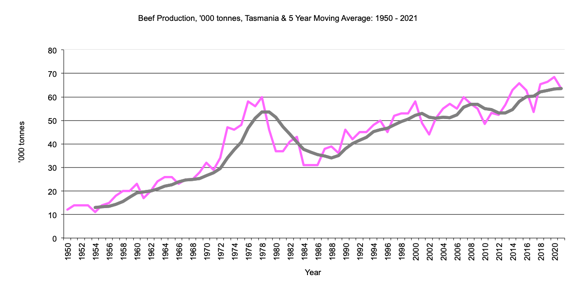
Tasmania, Beef Production
From 1950 to 1970 beef production included veal production

Beef production in '000 tonnes,
5 year moving average

Total number of establishments with agricultural activity, beef production

Tasmania     beef production     graph
Tasmania     beef production    data

Return to top of page
Back to data for States
Back to front page

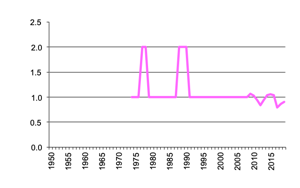
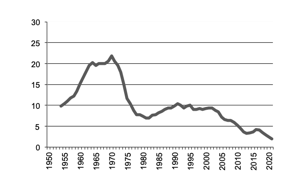
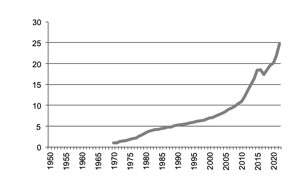
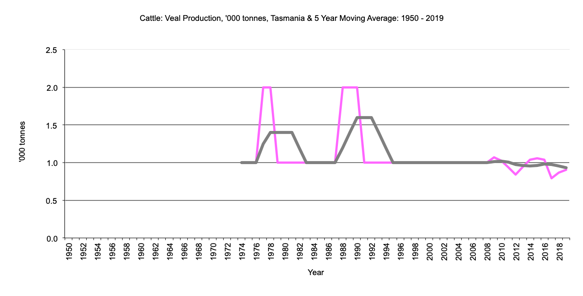
Tasmania, Veal Production

Prior to 1971 veal production included in beef production

Veal production in thousand tonnes.

Beef production since 1950

Tasmania veal production graph
Tasmania veal production data

Return to top of page
Back to data for states
Back to front page

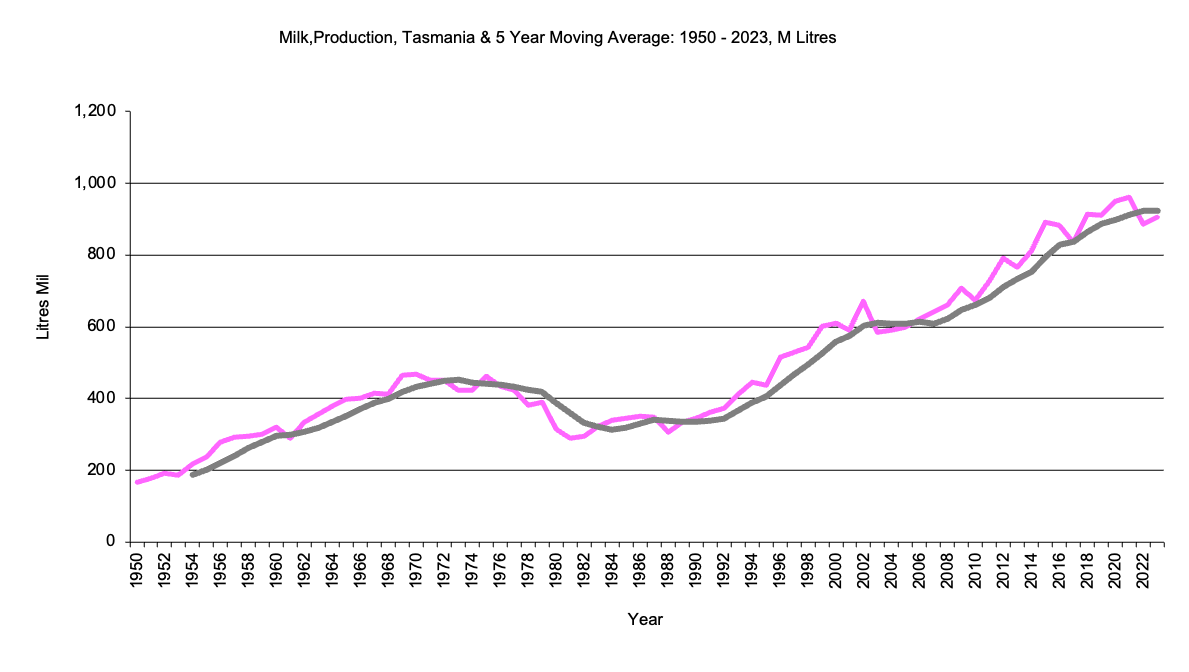
Tasmania, Milk Production

Milk production in million litres.,
5 year moving average

Milk production since 1950

Tasmania     milk production     graph
Tasmania     milk production    data

Return to top of page
Back to data for States
Back to front page

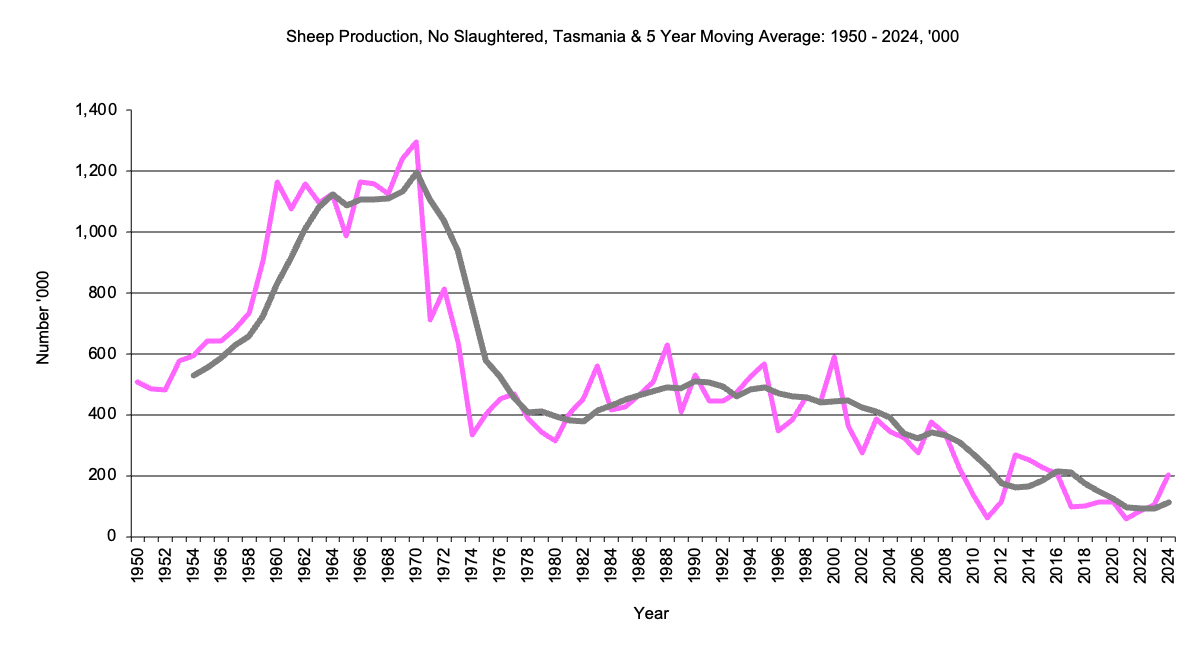
Tasmania, Sheep, Number Slaughtered

From 1950 to 1971 sheep slaughtered included lambs slaughtered

Number Sheep Slaughtered '000,
5 year moving average

Tasmania     Number of sheep slaughtered     graph
Tasmania     Number of sheep slaughtered    data

Return to top of page
Back to data for States
Back to front page

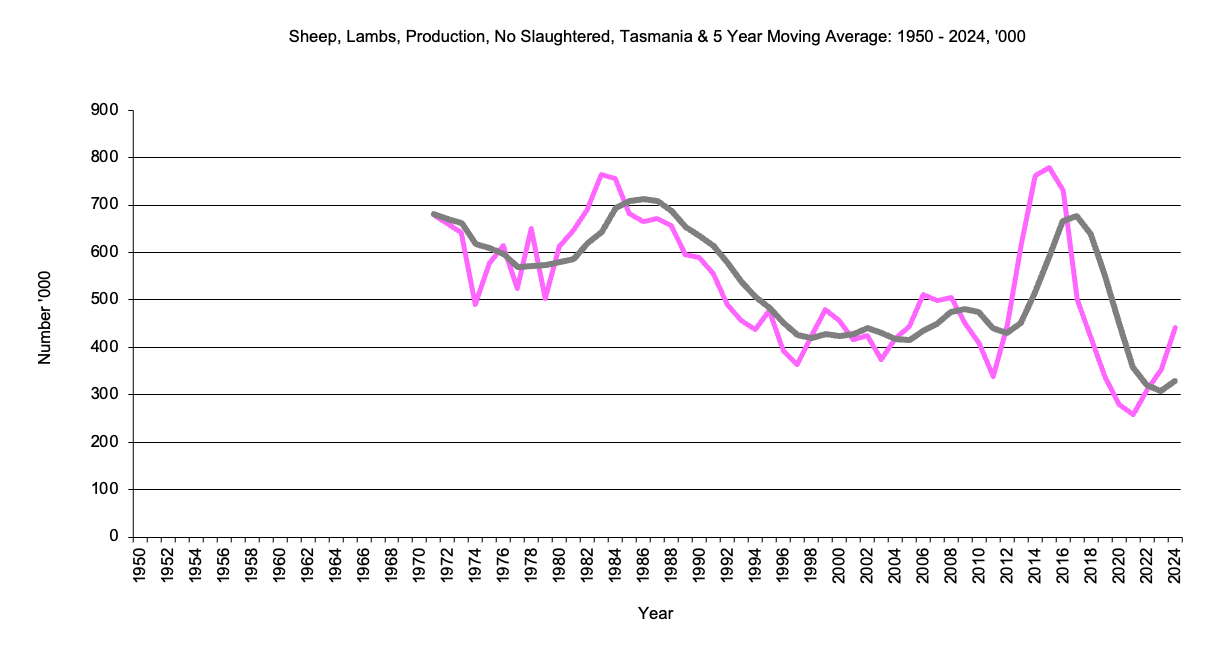
Tasmania Lambs, Number Slaughtered

From 1950 to 1971 Lambs slaughtered included in sheep slaughtered

Number Lambs Slaughtered '000,
5 year moving average

Number of lambs slaughtered since 1970

Tasmania     Number of lambs slaughtered    graph
Tasmania     Number of lambs slaughtered    data

Return to top of page
Back to data for States
Back to front page

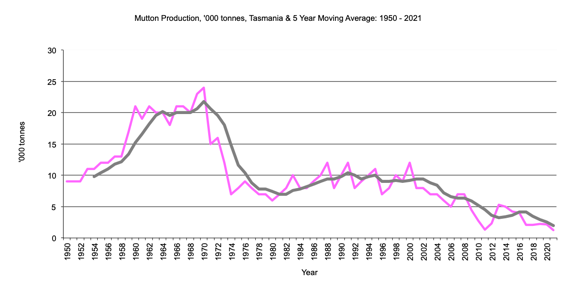
Tasmania, Mutton Production

From 1950 to 1970 includes lamb production

Mutton production in thousand tonnes.
5 year moving average

Mutton production since 1950

Tasmania mutton production graph
Tasmania mutton production data

Return to top of page
Back to data for states
Back to front page

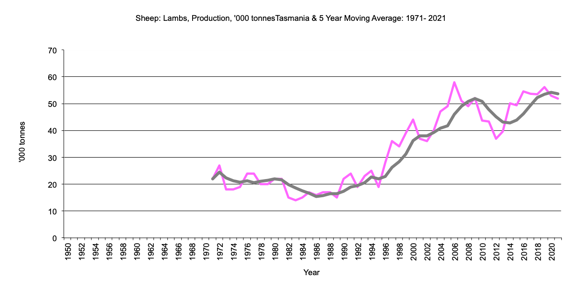
Tasmania, Lamb Production

Prior to 1971 included in mutton production

Lamb production in thousand tonnes.
5 year moving average

Lamb production since 1970

Tasmania     lamb production     graph
Tasmania     lamb production     data

Back to data for states
Back to front page

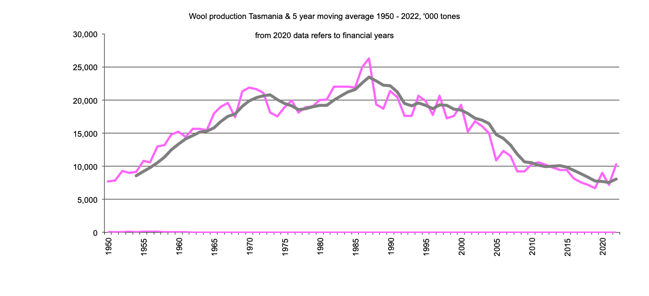
Tasmania, Wool Production

Wool production in tonnes.

Lamb production since 1950

Tasmania wool production graph
Tasmania wool production data

Return to top of page
Back to data for states
Back to front page

Tasmania, Pigs, Number Slaughtered

Number of pigs slaughtered in thousands.

Number of pigs slaughtered since 1950

Tasmania pig meat production graph
Tasmania pig meat production data

Return to top of page
Back to data for states
Back to front page

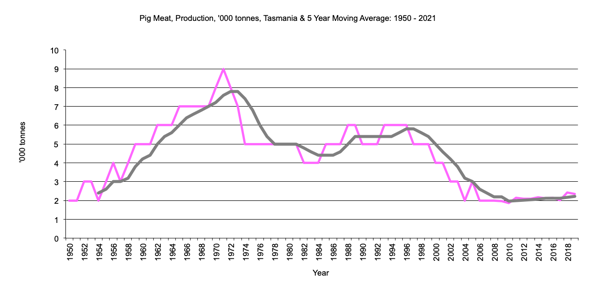
Tasmania, Pig Meat Production

Pig meat production in thousand tonnes.
5 year moving average


Pig meat production since 1950

Tasmania, Pig meat production graph
Tasmania, Pig meat production data

Return to top of page
Back to data for states
Back to front page

Tasmania, Chickens, Number Slaughtered

Chickens, Number Slaughtered in thousands

Number of chickens slaughtered since 1950

Tasmania Number of chickens slaughtered graph
Tasmania Number of chickens slaughtered data

Return to top of page
Back to data for states
Back to front page

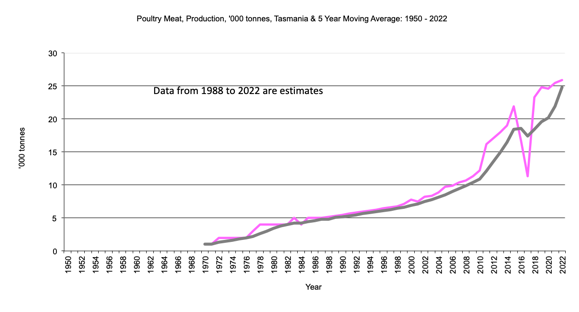
Tasmania, Poultry Meat Production

Poultry meat production in thousand dozen.
5 year moving average

Poultry meat production since 1950

Tasmania poultry meat production graph
Tasmania poultry meat production data

Return to top of page
Back to data for states
Back to front page

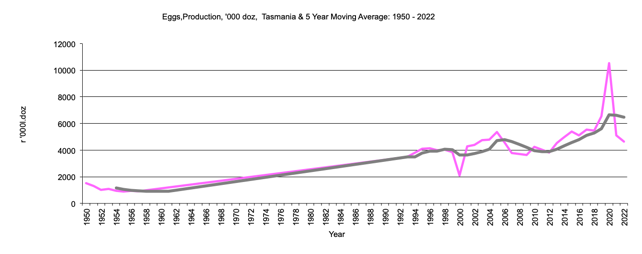
Tasmania, Egg Production

Egg production in thousand dozen.

Egg production since 1950

Tasmania egg production graph
Tasmania egg production data

p>Return to top of page
Back to data for states
Back to front page


AgEc Data
Last Updated 22 May 2023
Site prepared by Bob Cason (rgcason@webone.com.au)Email for more information