1950 to Current Data
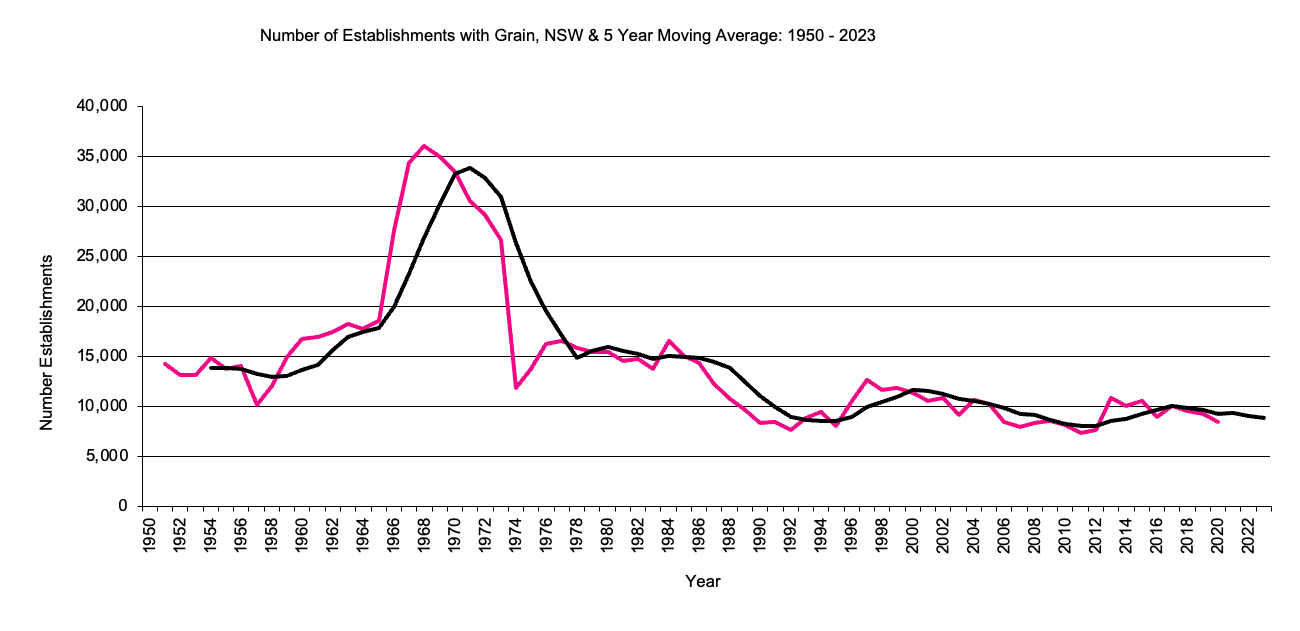
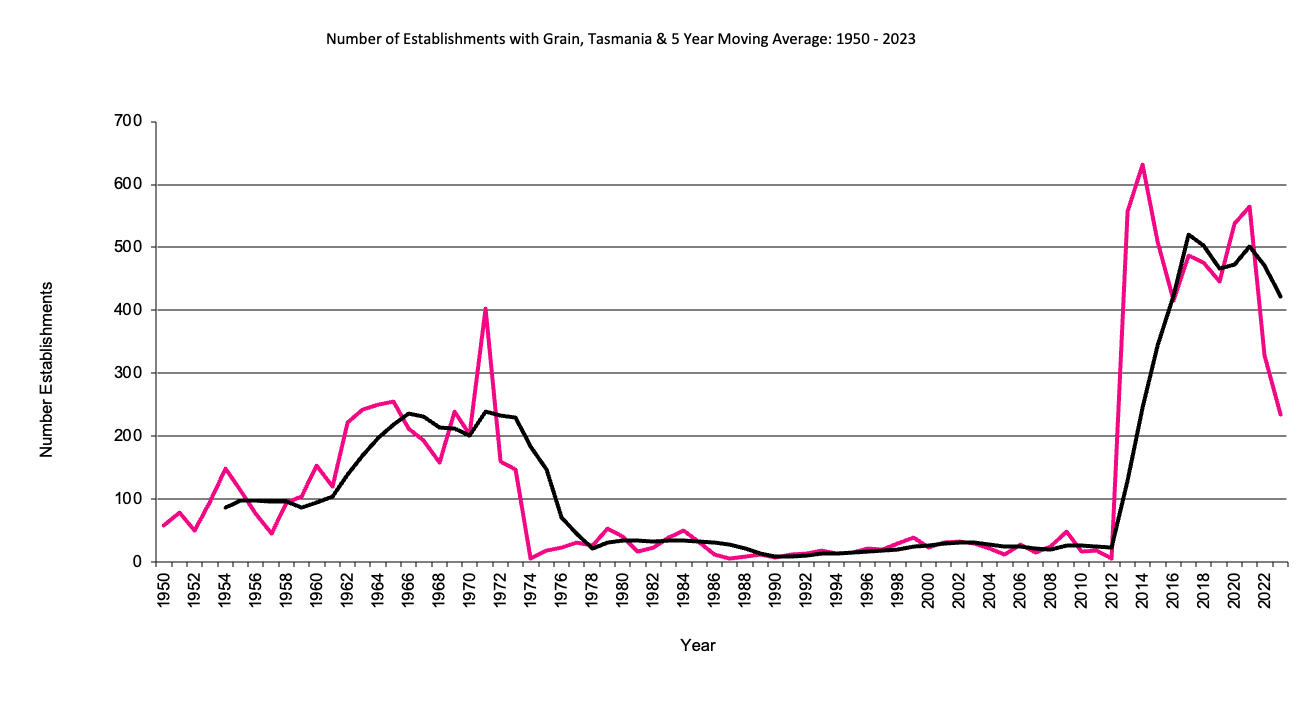
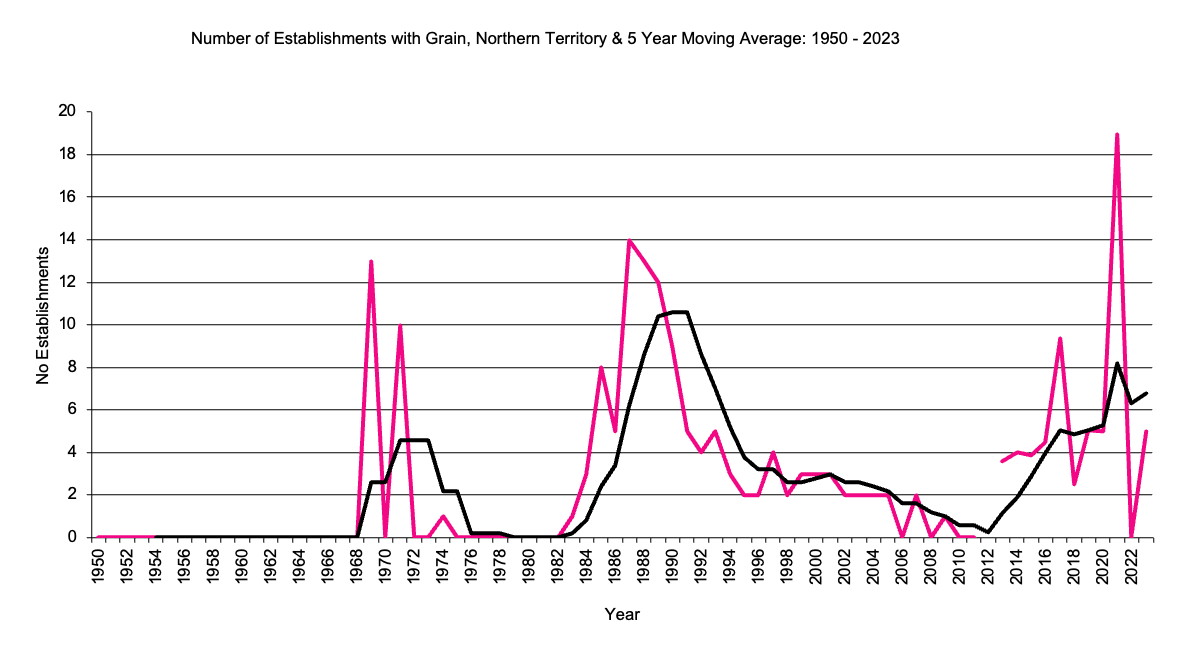
From 1950 to 1973 the data is number of holdings growing wheat.
Other changes in trends may be due to definitional changes. Main definitional changes have been: from 1950 to 1974 data refers to agricultural holdings, from 1975 the data is enterprises over 1 hectare with one or more agricultural establishments, from 1976 the criteria for inclusion changed to 10 hectares or more and an EVAO of $1,500 or more, from 1987 the EVAO criteria changed to $20,000 or more, from 1994 the EVAO criteria was reduced to $5,000 or more. From 2013 the definition changed to number of agricultural businesses with grain. In this data the previous series "grain" has been merged with the previous series "grain/beef cattle", from 2013 the data includes establishments with: wheat, oats, barley, triticale, sorghum and maize.
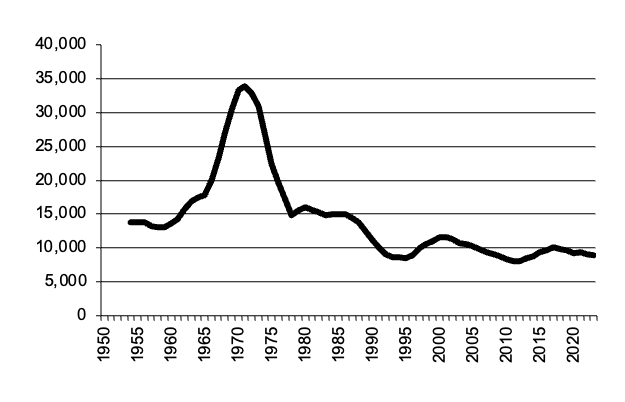
NSW
Establishments Growing Grain
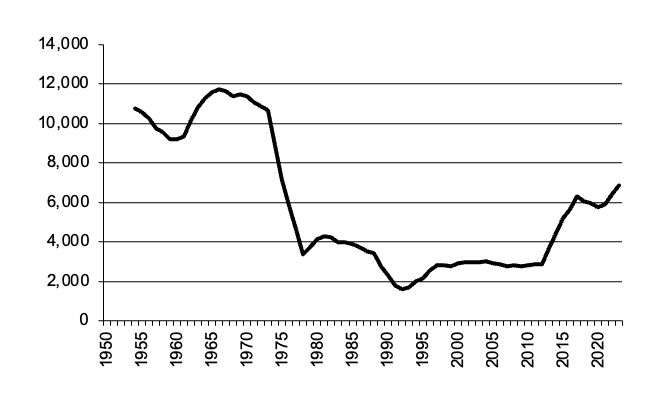
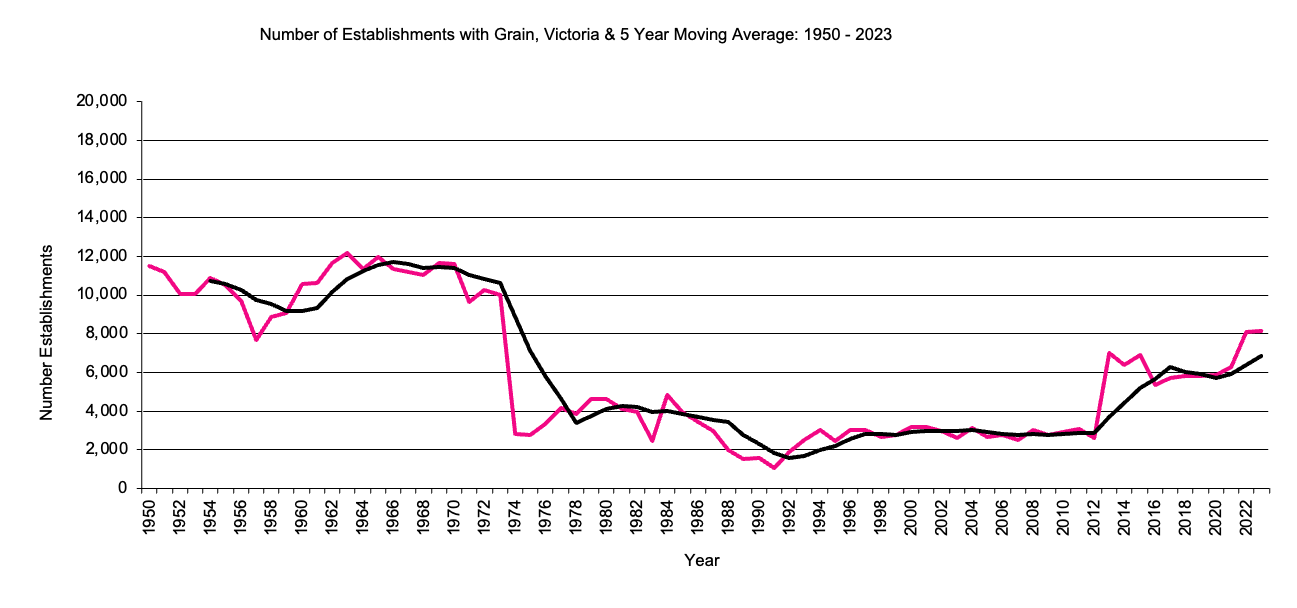
Victoria
Establishments Growing Grain
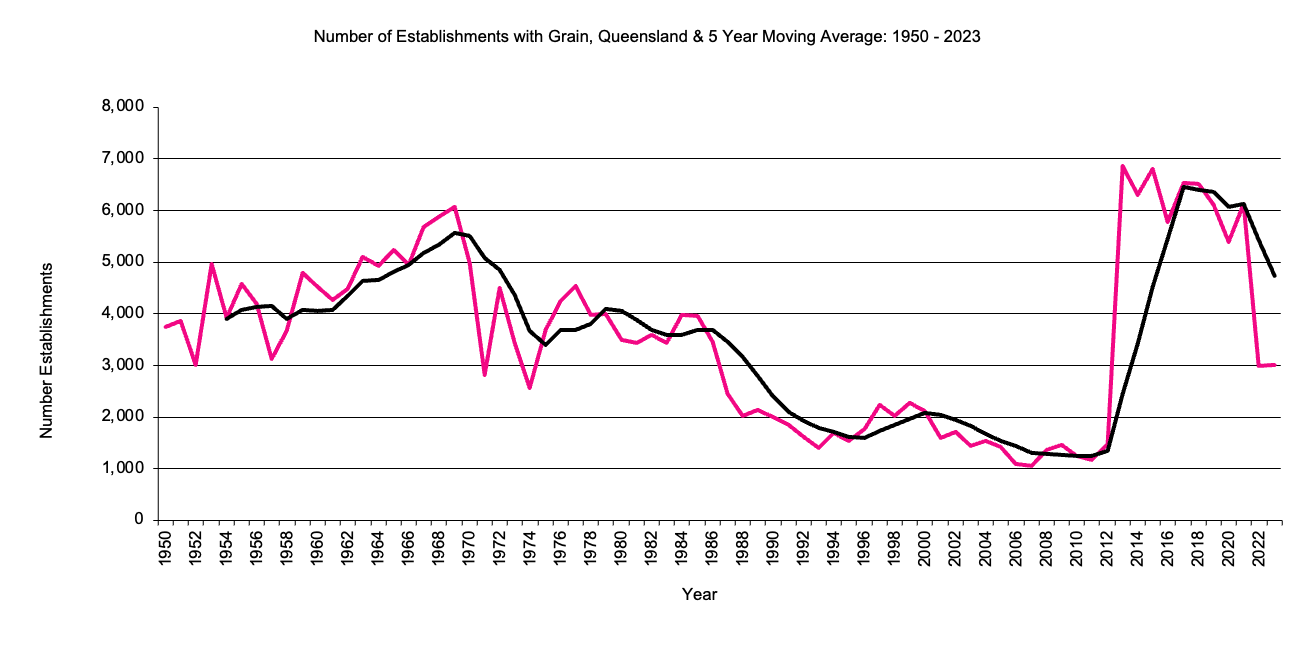
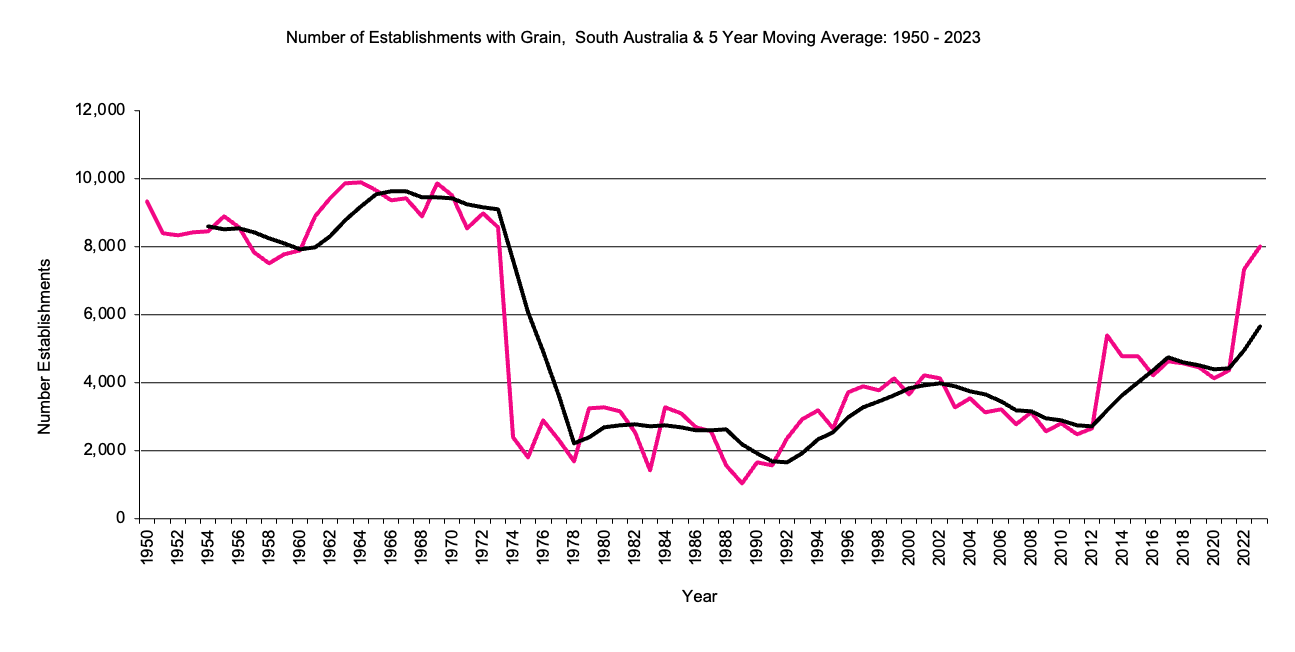
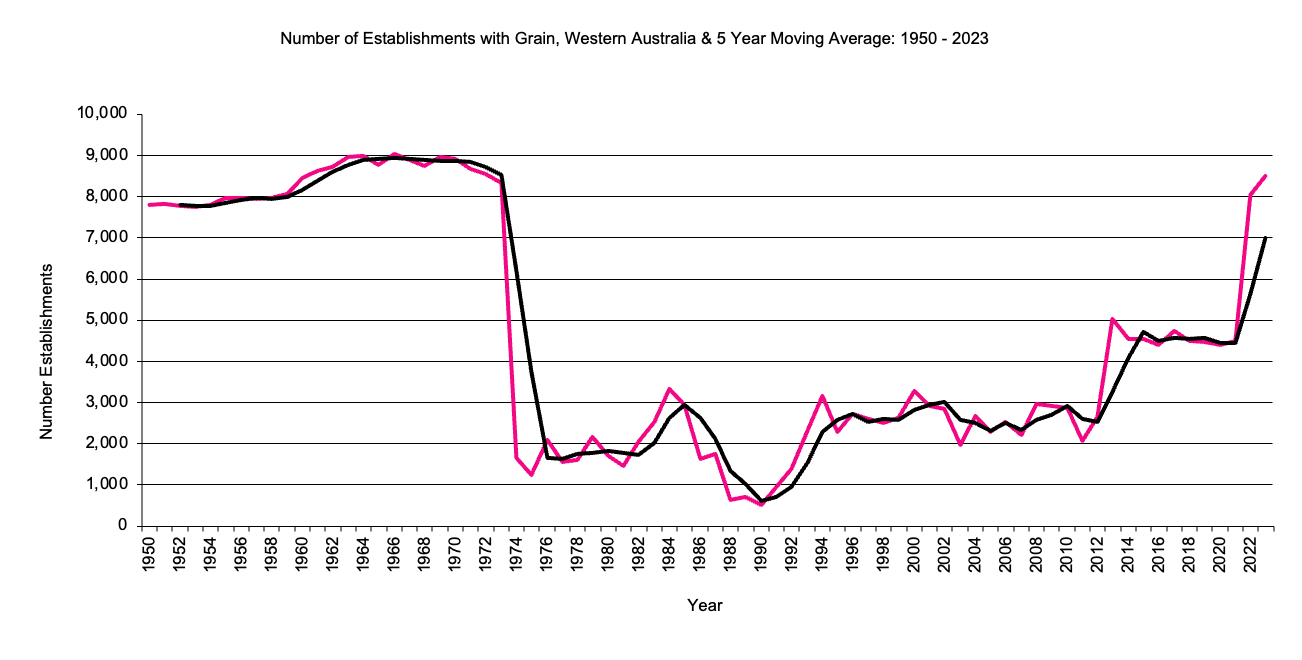
Data for 1950 to 1973 is holdings growing wheat. Data for some years up to 1973 may be an underestimate since there could be more holdings growing other grains such as summer crops.
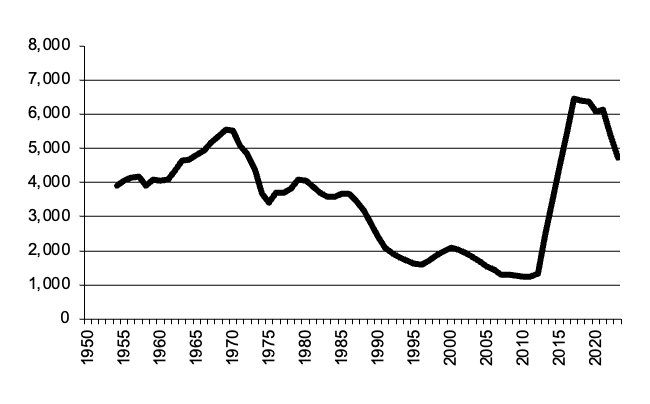
Queensland Establishments Growing Grain
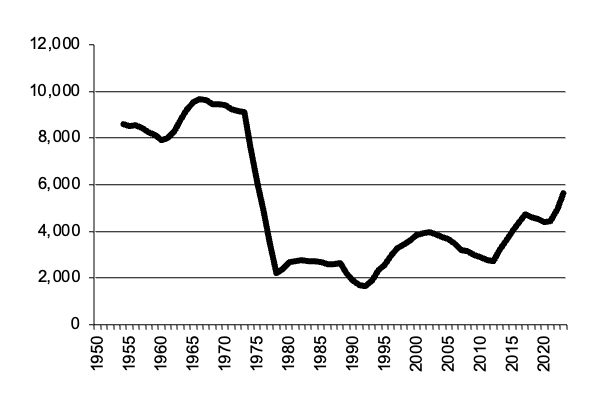
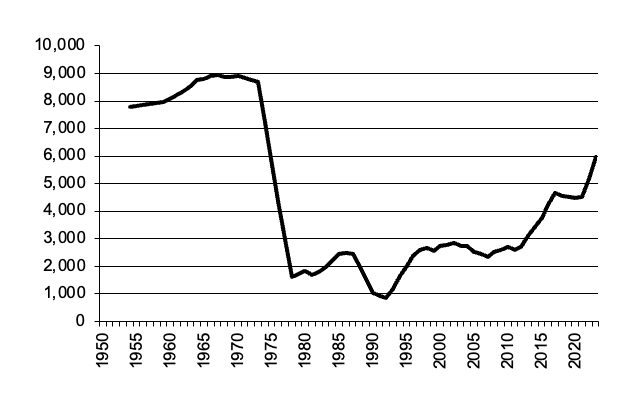
South Australia
Establishments Growing Grain
Western Australia
Establishments Growing Grain
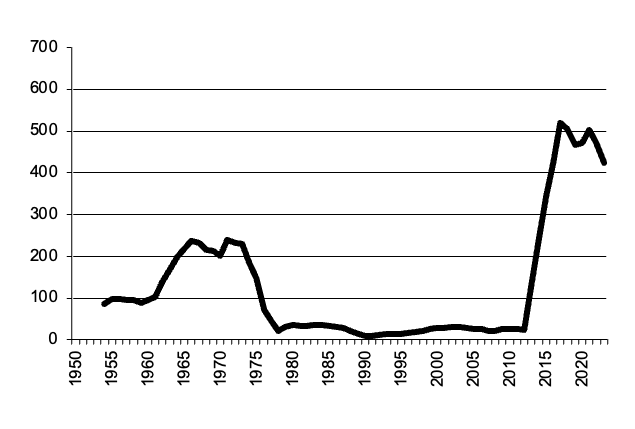
Tasmania Establishments Growing Grain
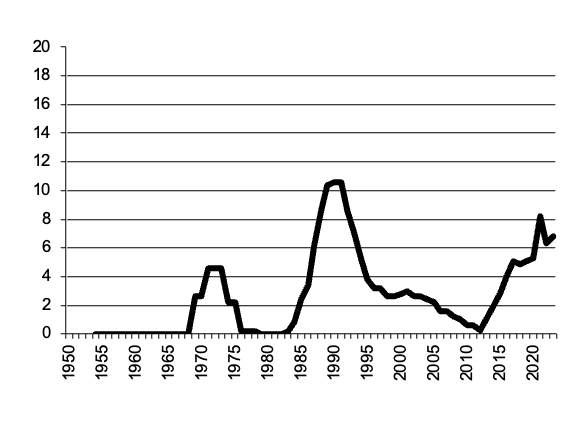
Northern Territory
Establishments Growing Grain
AgEc Data
Last Updated 22 November 2023
Site prepared by Bob Cason (rgcason@webone.com.au)Email
for more information